-
摘要:
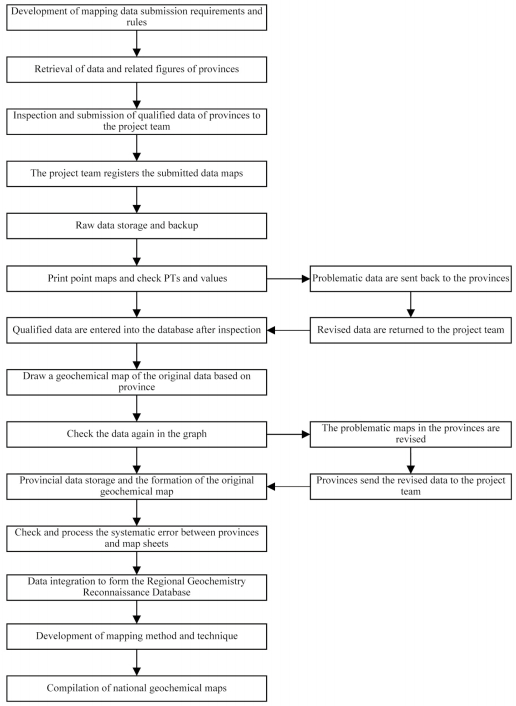
全国区域化探数据库首次汇集了全国28个省(自治区、直辖市)的1:20万和1:50万区域化探39种元素和氧化物的测试数据,共计数据点142万个,近5 540万个数据,涉及1:20万图幅1 299个,1:50万图幅18个,在国内第一次建立了地球化学海量数据库。全国矿产资源潜力评价项目对数据库进行了更新,使全国区域化探数据库汇集数据总量达147万余条记录,数据达6 321万。在此基础上,编制了4万多张各类地球化学系列图件,并建立了空间数据库,为地球化学研究和矿产资源预测相关专业提供了丰富的地球化学信息。该项成果的取得为在全国范围内研究区域地球化学分布、生态环境、基础地质和找矿远景规划提供了最基础的资料。
Abstract:China Regional Geochemical Exploration Database is the first one of its kind that synthesizes the testing data of 39 elements and their oxides from the regional geochemical exploration respectively at scales of 1:200, 000 and 1:500, 000, covering 28 provinces (autonomous regions and municipalities directly under the central government).It features nearly 55.4 million pieces of data collected from 1.42 million data points.The data involves 1, 299 map sheets at scale of 1:200, 000 and 18 map sheets at 1:500, 000.It is China's first massive geochemistry database.The national mineral resources potential evaluation project updated the database, making the national geochemical exploration database cover over 1.47 million records of aggregated data, with the data reaching 63.21 million records.On this basis, more than 40, 000 geochemical maps have been compiled, and a spatial database has been established to provide rich geochemical information for carrying out geochemistry research and predicting mineral resources.This pioneering work is of great significance to improve the level of geochemical exploration and research in China.It provides the most fundamental data for studying regional geochemical distribution of metallogenic elements, ecological environment, and basic geology, as well as for mineral resources prospecting throughout China.
-
Key words:
- national /
- regional geochemical exploration /
- stream sediment /
- geochemical data /
- spatial database
-
1. 引言
中国的区域化探扫面工作,是1978年1月原国家地质总局在上海召开的全国地质局长会议上,由谢学锦、孙焕振、李善芳、方华等专家联名向总局领导提出的“区域化探全国扫面计划”建议,该建议经总局领导组织有关专家认真研讨后,正式纳入地矿部门全国基础地质调查的中长期规划和年度计划,具体工作由总局分管部门和各省、自治区、直辖市组织实施。并计划用3 ~ 5年的时间对区域化探野外工作方法、样品加工方案、样品测试方法和配套方案、质量监控和标准样的制备等方法技术进行试点研究(谢学锦, 1978, 1992;南君亚, 1985)。
通过区域化探野外工作方法和样品分析试点研究,为全国区域化探扫面奠定了基础。1981年5月地质矿产部正式发布了《全国区域化探规划》,1985年2月地质矿产部正式颁发了《区域化探全国扫面工作方法若干规定》,要求各省、自治区、直辖市地质矿产局执行,并在全国按计划、有步骤地开展了大规模的区域化探扫面工作。
全国区域化探工作经过“六五”至“九五”4个五年计划的执行,到2002年已完成覆盖面积650万km2,并取得了举世瞩目的重大找矿成果,到2001年已发现化探异常约5万处,经过对化探异常的初步检查, 见矿异常2 900余处,经过进一步详细异常检查和钻探、槽探验证,发现贵金属、有色金属矿产地700余处,其中:达到大、中型规模的矿床70多处。
为了汇集、整理、抢救20多年来区域化探积累的海量数据,并建立全国区域地球化学数据库,中国地质调查局于2001年下达了地质调查技术方法类项目“全国区域地球化学系列图编制”(向运川, 2001, 2002;谢学锦等,2009)。该项目从2001年10月份开始编写项目设计书和编图实施细则等技术要求,各项工作均按技术要求执行。项目总体按三个阶段进行,第一阶段汇集全国各省的区域化探原始网格化数据;第二阶段检查、核对、整理、调试和拼接数据,将合格的数据输入数据库;第三阶段研究编图方法技术,修改、完善全国区域地球化学数据库,处理系统误差,编制全国地球化学系列图。经过多次反复修改、补充和完善,最终集成后建成了全国区域地球化学数据库,并按照项目任务目标编制完成了全国地球化学系列图。
2006年—2013年国土资源部部署开展了全国矿产资源潜力评价项目,中国地质调查局发展研究中心化探资料应用研究组将全国区域化探数据库按省(自治区、直辖市)分发到各项目组,项目实施中各省(自治区、直辖市)对区域化探数据进行了更新和补充,最终汇集到全国项目组,更新完善全国区域地球化学数据库。
全国区域化探数据库元数据简介见表 1。
表 1. 数据库(集)元数据简表2. 数据采集和处理过程
2.1 数据基础
从1979年试点开始,全国开展了1:20万和1:50万区域化探工作,原地矿系统有28个省(自治区、直辖市)地质矿产局和新疆305项目开展了区域化探工作,1999年国土资源部和中国地质调查局成立后,各省(自治区、直辖市)地质调查院继续开展区域化探工作。
区域化探工作野外采样以水系沉积物为主,少数地区采集土壤和岩石样品。1:20万采样密度一般1 ~ 2个/km2,然后4 km2组合一个样品送实验室分析,1:50万低密度区域化探(青海、西藏、新疆等少数地区)采样密度一般4 ~ 36 km2采一个样品,送单点样分析,分析测试Ag、As、Au、B、Ba、Be、Bi、Cd、Co、Cr、Cu、F、Hg、La、Li、Mn、Mo、Nb、Ni、P、Pb、Sb、Sn、Sr、Th、Ti、U、V、W、Y、Zn、Zr、SiO2、Al2O3、Fe2O3、K2O、NaO、CaO、MgO共39个元素(氧化物)。送分析的所有样品按规范要求测试39种微量元素及氧化物,但是有少数省地质矿产局实验室在20世纪80年代初期由于仪器设备落后,测试方法技术不成熟,测试的元素不够39种。
截止到2010年完成覆盖面积超过760×104 km2,其中,1:50万水系沉积物测量覆盖国土面积约164×104 km2,主要分布在西藏、黑龙江、西天山、西昆仑西段、东昆仑和阿尔金山、西南三江地区北部等工作条件比较困难的区域,1:20万水系沉积物测量覆盖国土面积约610×104 km2。2005年前,全国区域化探数据库汇集数据点共142万个,近5 540万个数据(39种元素),涉及1:20万图幅1 299个,1:50万图幅18个。全国矿产资源潜力评价项目对数据库进行了更新,使全国区域化探数据库汇集数据总量达147万余条记录,数据达6 321万。
2.2 数据工作流程
项目组首先汇集全国各省的区域化探原始分析数据,然后检查、修改、验收、调整各省汇交的数据,将合格的数据入库。
数据工作流程(见图 1)主要按以下步骤进行:
(1) 由中国地质调查局向全国地矿系统各省(自治区、直辖市)函发《关于全国区域地球化学系列图编制数据汇交有关要求的通知》(中地调〔2001〕218号)。
(2) 项目组编写“项目设计书”、“编图实施细则”、“数据汇交及光盘验收细则”等要求。
(3) 各省(自治区、直辖市)按中国地质调查局通知要求,提取全省区域化探数据,数据项主要包括:图幅名、图幅编号、图幅经纬度、元素名称及各点对应的坐标和网格化数据、单元素网格化数据图、全省1:20万国际分幅接图表及区域化探完成情况说明,提交项目组。
(4) 项目组收到各省数据光盘和网格化数据图,按图幅逐项进行登记。
(5) 将收到的全部数据存档,并用光盘备份。
(6) 选1 ~ 2个元素按1:20万图幅打印各省数据点位图,并与网格化数据图对照检查点位及数值的正确性。
(7) 经过检查、核实,对没有问题的图幅进行全省数据检索,并绘制一张Ag等单元素的原始网格化地球化学图。
(8) 经检查,发现存在问题的数据或图幅,与汇交单位沟通,进行复查、修改、补充。某些省的此项工作经多次反复,直至正确无误为止。
(9) 利用信息化手段分别按省建立数据子库,并做出单元素原始数据图和地球化学图。
(10) 分别将每个省的数据图和原始的地球化学图与相关地质矿产图再次进行宏观对比,如发现地质背景与异常区带等可疑点,及时与有关省联系,共同复查、纠正存在的问题。
(11) 将全部原始数据及分省的原始网格化地球化学图检查后存入全国区域化探数据库。
(12) 对各省原始网格化数据存在的图幅间、省际间系统误差进行校正处理。
(13) 完成数据集成与规范化,建立全国区域化探数据库。
全国区域化探数据库的应用主要是在全国矿产资源潜力评价项目中,为资源潜力评价和基础地质研究提供化探信息。化探资料的应用重点为数据处理、解释与编图工作,化探资料应用的主要数据源是区域地球化学数据,其次是各省收集的中大比例尺化探数据。通过应用地球化学数据处理技术,对化探数据进行二次开发研究,分析与信息提取,并进行推断解释,进而编制地球化学系列图、推断解释图和矿产资源找矿预测图。
化探资料应用工作技术流程如图 2所示。
2.3 汇交数据验收
项目组收到汇交资料,首先根据数据汇交要求,从整体上检查接图表、数据光盘、网格化数据图等几部分内容是否齐全,再检查各部分内容的具体情况。
(1) 针对数据光盘,检查数据记录格式、各数据点对应坐标、元素个数、网格数据点个数。
实际汇交中包括8种类型的数据格式:MS Access mdb格式、MS Excel xls格式、省级区域地球化学数据库系统PGD 1.0或PGD 2.0的020格式及dbf格式、文本文件txt格式、MapGIS det格式、Foxpro或Dbase数据库的dbf格式。
(2) 网格化数据图或大格编码图,检查数值与入库数据的一致性,图幅数与入库数据是否对应。
(3) 接图表及说明,检查图幅的图名、图幅号、行列数、左下角点坐标、数据的输入顺序等。
经过初查的资料进行登记,其内容包括汇交单位、地址、汇交时间、提交人姓名、联系电话、提交途径、汇交内容。
汇交内容逐条详细登记,包括:
(1) 接收的光盘。盘面进行标注,并记述文件名等内容。
(2) 接收的网格化数据图。分幅登记图名、图幅号并在图头打印省内顺序编号:例如福建省国标代码为35FJ,则它的图编号应从350001起,其全省共25张图,图的顺序编号到350025结束。偶有一张图内包含几个边角图幅时,顺序编号相同,同幅有多张不同元素图时,其顺序编号不变,加脚码-n进行区分。
(3) 接收的接图表及说明。在资料接收过程中凡发现疑点,立即与汇交单位反复交换意见,并最终达成处理结果。经初步验收合格的数据,由中国地质调查局签发验收文据,发往各汇交数据资料的单位。
2.4 汇交数据管理
由各省(自治区、直辖市)汇交的资料内容分两大部分,即原始资料和核查资料。
原始资料包括全国各省汇交的1:20万及1:50万区域化探资料共30套,分省装盒。全部资料分类统计有(截止2005年数据库统计):分省的接图表 29张(无宁夏自治区接图表)、网格化数据图或大格编码图共944张、数据光盘64张、数据软盘20张,汇集了近39个元素及氧化物的1 421 213个数据点(总数据量约5 540万个),见表 2。
表 2. 全国区域化探数据汇总资料统计核查资料包括按照每省建立一套检查验收文档,共有30套,内容包括,通过分省数据库中打印各幅网格化数据图、及分省原始彩色地球化学图和各类验收表格等,见表 3。
表 3. 全国区域化探数据检查资料统计2.5 数据处理
数据处理的目标是为确保数据的正确性和真实性,为建立全国地球化学数据库和编图提供一套可靠的、高质量的基础数据。主要从以下几个方面进行:
(1) 重复点检查
将数据检索、转储成新的入库文件mdb,录入区域地球化学数据管理信息系统GeoMDIS,重复点被检测出来并显示在反馈信息模板上。通过清除反馈的重复点信息,重新入库。
(2) 入库状态检测
对上报数据转入GeoMDIS系统数据库以及转入后系统更新、数据检索等过程的跟踪检测、故障排除。主要针对入库失败,或入库报溢出或系统错误等情况,查找数据异常,并排除错误。
(3) 极大、极小值检测
极大、极小值检测主要针对超标或非法值的错误。包括符号错误、非法值等。反馈到各省后,经省内对错误数据修正后重新入库,并重新形成上报数据。
(4) 计量单位检测与调整
针对上报数据Ag、Au、Hg、Cd等元素计量单位存在多种可能的问题,对数据进行检测,通过直接对比相邻图幅或省,并绘制数据图进行比较,发现计量单位错误,经与提交数据的省核实后进行修正。
(5) 元素、图幅缺失情况检测
通过GeoMDIS系统功能建立BMP图像库,检测元素、图幅缺失情况是否与上报说明一致。并对元素、图幅缺失情况严重的省反复进行了核实。
(6) 点位图制作与上报蓝图校对检测、图形图像检测
利用GeoMDIS系统功能,根据具体情况和实际需求编制一些辅助程序进行。排除相关冗余错误,得到一份各省重新形成的上报数据表,进入点位图制作与上报蓝图校对检测、图形图像检测。发现坐标错位、行列错误等情况,再反过来重新审视是否与上报的原始数据一致,排除入库错误可能,记录错误与省联系,确认错误后,重新上报正确数据,重新入库并生成新的上报数据表。
(7) 检测结果的记录、认定和改正错误
对各省上报数据的调整和改正是一项极为严肃、认真的工作。数据的更正必须通报各省上报数据的当事人(主管或数据文件直接制作人),并且得到各省上报数据当事人确认。改数据必须有理有椐,必要时责成其将改好的数据重新上报。
3. 数据样本描述
数据库对地球化学数据的检索,是以图幅(代码)或省区(代码)为单位进行的,通常不存在对单个元素的检索。数据结构如表 4。
表 4. 区域地球化学元素主数据4. 数据质量控制和评估
4.1 基础数据质量
各省(自治区、直辖市)的区域化探工作,从80年代初期开始,按地质矿产部的统一部署,遵照原地矿部颁发的《区域化探全国扫面工作方法若干规定》以及随后颁布的《区域化探规范》开展工作。从工作布置、采样方法、样品加工、标样制备、样品分析,到资料整理等,都按照规范的规定统一进行,因此,各省(自治区、直辖市)报来的数据,质量都比较高。
但是,由于各省(自治区、直辖市)进行区域化探的时间跨度很长,相当多的省(自治区、直辖市)工作时间超过20年,也由于各省(自治区、直辖市)的具体情况,管理方式、技术措施,以至分析方法的不同,致使报来的数据质量参差不齐,为保证高质量数据入库在数据入库前作了认真的检查,进行质量控制。
数据检查质量控制采用的方法:
(1) 主要是根据报来的光盘数据以及随盘报来的资料(全省接图表、图幅网格编码图)对照进行核对,检查数据位置是否如接图表、网格编码图所标示的那样。若某省(自治区、直辖市)报来的是某元素的网格数据图,除检查坐标位置外还对数据进行核对,尤其是对高值点数值及其坐标着重进行检查。
如湖北黄陂幅Ag的光盘上数据点位置与网格编码图坐标不符,与其他元素坐标也不符,在远距离联系未果的情况下,到湖北收集Ag网格数据图确认系录入错误,遂将该图幅Ag元素重新录入入库。
发现福建平阳幅、浮鹰岛幅纵坐标错位2 km,指出后由福建重新修改。
发现河北康保幅库内CaO数据与网格数据图对比横坐标错位2 km,经修改后入库。
云南河口幅Hg数量级错,全幅数据应除1 000,恢复到10-9数量级。云南的西昌幅数据坐标有错,采用四川同一幅的正确数据置换。
(2) 其次,采用报来数据成图用图像显示的方式进行检查。将各省(自治区、直辖市)报来数据建立数据工作区,用该省(自治区、直辖市)数据按地球化学图制作方法在屏幕上分别生成39幅数据图像,与地质图及已知成矿带对照,通过检视数据图像,检查数据质量。
如西藏东部三江带在屏幕图上呈北东向延伸,与实际情况明显不符,经检查原来是上报数据时将西藏东部几个图幅的起始点由左下角错弄成了左上角。又如河南洛阳幅39个元素图像明显变异,经查原来是该图幅录入时行列数给错。再如湖南会同幅部分元素(Cr、Hg、Ni、U)在屏幕图上全图幅呈北东东向规则条带,与多数元素展示情况不符,经查原来是该图幅的这几个元素另录入时行列数给错。岳阳幅Th图像奇变,系录入错误。
在采用屏幕图像对数据进行检查时,发现多数省(自治区、直辖市)在省际、省内各个图幅间,甚至1:5万图幅间存在明显的采样、分析系统误差,有的省(自治区、直辖市)还比较严重,对于这些已察觉的系统误差,入库时未作处理,保持数据的原始面貌。
(3) 统计数据特征点的方法:通过统计特征值,找到一些明显属于录入错误的数据,例如极大值中SiO2 > 100%,Fe2O3、MgO等于99%等,均改正后入库。
检查结果,认为吉林、江苏、浙江、安徽、福建、山东、广东、海南、贵州、陕西、北京11个省市报来的数据质量较好。
河北、河南、湖北、湖南、广西、四川、云南、内蒙古、甘肃、西藏10个省(自治区)在检查中发现一些问题,经反复与省内有关人员联系研究后,进行了解决,总体质量也较好。
江西、山西、辽宁、青海、黑龙江5个省,有的图幅缺部分元素分析数据,有的可能是早期进行工作的图幅,部分图幅有些元素缺分析结果,元素数据质量较差。
宁夏、新疆305项目问题较多。宁夏有部分元素在全区各图幅上均出现明显的东西向横条带,这在全国是唯一的特例,造成数据这种情况的原因目前难以确定。新疆由于参加区域化探扫面的单位较多,尤其是305项目承担工作的图幅,数据存在一些问题,已无法再找原工作单位核实、查对、改正。
4.2 编图质量
按照化探资料应用技术要求,全国资源潜力评价化探组制定了全国化探资料汇总工作方案,后经专家多轮修改,最终形成了《化探资料汇总工作方案》。全国汇总图件均按《化探资料汇总工作方案》要求的编图要素、编图方法技术流程和图件表示方式来执行。地球化学编图工作主要在MapGIS或GeoExpl软件平台上进行,按照数据模型进行规范,形成符合数据要求的图件。图件编制后经过100%自检、100%互检,部分图件已打印输出,经过专家组检查及检查后的意见修改完善,完全符合编图技术要求。图件的图式图例表达符合化探编图数据模型和相应规范。
4.3 成果数据库建设质量
图件数据库建设是在编图过程中,按照化探数据模型对于全国性成果图建立属性数据库。采用GeoMag、MapGIS、GeoExpl等软件平台实现,为确保属性内容质量,属性内容由有丰富经验的专业人员严格按照全国矿产资源潜力评价相关技术要求采集,尽可能采集完整的信息。全国相关资料汇总后对成果图属性数据利用软件与人工交互的方式进行了全面的检查,总体质量符合技术要求。
5. 结论
(1) 全国区域化探工作30多年来,国家投入大量资金,取得海量的具有时代意义的基础数据,在矿产勘查、地学科学研究等方面取得了重要成果。但由于数据分散在各个地勘单位,加之机构的调整变化,部分数据濒于失散。通过此项建库工作,及时挽救了这些宝贵的数据资源。
(2) 首次汇集了全国28个省(自治区、直辖市)的1:20万和1:50万区域化探39种元素和氧化物的测试数据,2005年建立的全国区域化探数据库,共计数据点142万个,近5 540万个数据,涉及1:20万图幅1 299个,1:50万图幅18个。全国矿产资源潜力评价项目补充更新,使全国区域化探数据库数据总量达147万余条记录,数据达6 321万。
(3) 研制开发了基于GIS和网络技术的大型区域地球化学数据管理系统,建立了全国区域地球化学数据库。
(4) 本次地球化学编图汇集全国28个省、自治区、直辖市的1:20万和1:50万区域化探39种元素和氧化物的测试数据,汇集、整理、抢救了30多年来区域化探积累的海量数据,并建立了全国区域地球化学数据库。该成果资料已经、并将持续在矿产普查找矿、成矿远景区划、资源潜力预测、地质填图与基础地质研究、环境与土地质量评价以及其他相关领域的应用中发挥巨大的作用。
(5) 编制的各类地球化学图件,成果性图件按照《化探资料应用数据模型》和项目信息要求建立了空间数据库。
1. Introduction
The regional geochemical exploration in China initiated with the introduction of Regional Geochemistry Exploration——Nationwide Scanning Program (RGE-NSP).Xie Xuejin, Sun Huanzhen, Li Shanfang, Fang Hua and other experts jointly put forward the proposal for RGE-NSP to the head of the General Administration of Geology of People’s Republic of China in January 1978 at the National Conference of Geological Directors organized by the former National Directorate General of Geology in Shanghai.This proposal was formally incorporated into the medium and long-term plans as well as the annual plans of national basic geological survey of the Ministry of Geology and Mineral Resources of China after a meticulous discussion by relevant experts arranged by the leaders of General Administration.The specific tasks were organized and implemented by departments under the General Administration of Geology in addition to provinces, autonomous regions, and municipalities directly under the central government.It was planned to take 3 to 5 years to conduct pilot studies on fieldwork methods, sample processing schemes, sample testing methods and supporting programs, quality control, and standard sample preparation techniques of regional geochemical exploration (Xie Xuejin, 1978, 1992; Nan Junya, 1985).
The pilot study on fieldwork methods and sample analysis of the regional geochemical exploration laid the foundation for RGE-NSP.The Ministry of Geology and Mineral Resources of China formally issued China Regional Geochemical Exploration Plan in May 1981 and Regulations on the Working Method for Regional Geochemical Exploration——Nationwide Scanning Program (RGE-NSP) in February 1985, requiring all the provincial bureaus of geology and mineral resources to implement these issues.In addition, the Ministry carried out a large-scale regional geochemical exploration work in a planned and systematic manner throughout the country.
Through the implementation of the four Five-Year Plans, i.e., 6th Five-Year Plan to the 9th Five-Year Plan, the nationwide regional geochemical exploration covered an area of 6.5 million km2 by the year 2002 and yielded remarkable major prospecting results.By the year 2001, about 50, 000 geochemical exploration anomalies had been discovered.After a preliminary inspection of geochemical exploration anomalies, more than 2, 900 ore anomalies were seen.Moreover, after detailed anomaly inspections, drilling inspections and trench tests, more than 700 precious metal and non-ferrous metal ore deposits were discovered, including more than 70 large and medium-sized deposits.
In order to gather, sort and rescue the massive amount of regional geochemical exploration accomplishments accumulated over the past 20 years and establish a nationwide regional geochemical database, China Geological Survey issued the geological surveying technology method project “Compilation of National Geochemical Series Maps” in 2001 (Xiang Yunchuan, 2001, 2002; Xie Xuejin et al., 2009).Technical specifications of the project, such as project design documents and drafting implementation rules, were compiled from October 2001.All the work was performed according to technical specifications and the project was carried out in three phases.The first phase brought together the raw grid data of regional geochemical exploration from the provinces across the country.The second phase involved checking, collating, arranging, debugging, and assembling the data before entering qualified data into the database.The third phase involved studying the mapping method and technology, modifying and improving the national regional geochemical database, correcting systematic errors, and compiling national geochemical maps.After multi-cycled modifications, supplements, improvements, and realizing data integrations, the nationwide regional geochemical database was finally established.In addition, a series of national geochemical maps were completed according to the project’s objectives.
Table 1 is a description of metadata of China Regional Geochemical Exploration Database.
Table 1. Metadata table of Database (Dataset)2. Data Acquisition and Processing
2.1 Database
Starting from the pilot study in 1979, the 1:20, 000 and 1:500, 000 regional geochemical exploration had been carried out nationwide.Regional geochemical exploration was carried out by bureaus of geological and mineral resources of 28 provinces (autonomous regions and municipalities directly under the central government) under the original geology and mining system and Xinjiang’s National Project 305.After establishion of Ministry of Land and Resources and China Geological Survey in 1999, all the geological survey bureaus in provinces (autonomous regions and municipalities) continued to carry out regional geochemical exploration.
All samples sent for analysis were tested for 39 trace elements and oxides according to the specifications.However, in the early 1980s, due to the backward instrumentation and equipment and immature testing methods and techniques, the number of tested elements was less than 39 in the labs of the bureaus of geology and mineral resources of minor provinces.
Samples of stream sediments dominated field sampling in regional geochemistry exploration, while soil and rock samples were collected in minor areas.Therefore, the data submitted mainly comprises the test data of 1:200, 000 and 1:500, 000 stream sediment samples before the year 2002.The sampling density was generally 1-2 samples/km2, and a composite sample in an area of 4 km2 was sent for laboratory analysis.Moreover, as to the 1:500, 000 low-density regional geochemical exploration (only in minor provinces such as Qinghai, Tibet and Xinjiang), the sampling density was generally 1 sample per 4~36 km2, and the analyzed sample was exclusively a single point sampling result.The database contains a total of 1.42 million regional geochemical data points and nearly 55.4 million data (39 kinds of elements), involving 1, 299 maps at the scale of 1:200, 000 and 18 maps at the scale of 1:500, 000.
2.2 Data Workflow
The project team first gathered the original analysis data of regional geochemical exploration of all provinces in the country, and then inspected, modified, accepted and adjusted the data submitted by the provinces, before inputting qualified data into the database.
The data workflow (See Fig 1) mainly follows the steps below:
(1) China Geological Survey issued Notice on the Relevant Requirements for the Data Collection for Compilation of Regional Geochemical Series Map Data (CGS official document [2001] No.218) to the provinces (autonomous regions and municipalities directly under the central government) under the national geology and mining system.
(2) The project team compiled the “Project Design Scheme”, “Mapping Rules”, “Data Collection and Data-CD Acceptance Rules” and other requirements.
(3) All provinces (autonomous regions and municipalities directly under the central government) extracted their regional geochemical exploration data in pursuance of the notice of the China Geological Survey and submitted them to the project team.The data items mainly include map title, sheet designation, map latitude and longitude, element name, coordinates for each point, grid data, single-element grid data map, the 1:200, 000 international index map of the province, and information about the completion of regional geochemistry exploration.
(4) The project team received the data CDs and grid data graphs of all provinces and registered them based on the map sheet.
(5) All the received data was archived and backed up on CDs.
(6) One or two elements were selected to print the data point map of each province with the scale of 1:200, 000, and the points and values were checked for accuracy against the grid data graph.
(7) After checking and verification, the team conducted provincial data retrieval on the maps without problems, and drew a single-element grid geochemical map of Ag and other elements.
(8) In the event of a problem in data or maps, the team communicated with the original data submission units for review, modification and supplementation.In some provinces, this step was repeated multiple times till everything is correct.
(9) Information technology was employed to form a sub-database for each province, and single-element raw data maps and geochemical maps were made.
(10) Separate macro comparisons were made between the data maps of each province and the original geochemical maps, and related geological and mineral resources maps.Moreover, in the case of suspicious events, such as the discovery of geological backgrounds and anomalous zones, relevant provinces were timely contacted for reviewing and correcting the errors.
(11) All the original data and original grid geochemical maps of each province were deposited into the Regional Geochemical Exploration Database.
(12) The team corrected systematic errors between maps and between provinces in the original grid data of provinces.
(13) Data integration and standardization was accomplished, and the Regional Geochemical Exploration Database was established.
The application of geochemical exploration data focuses on data processing, interpretation and mapping, which is based on the geochemical data.The main sources of geochemical exploration data are regional geochemical data and geochemical exploration data of medium and large scales collected by the provinces.Through the application of geochemical data processing technology, the secondary development, analysis, information extraction and inferred interpretation of geochemical exploration data are carried out.Later on, a series of geochemical maps, inferred interpretation maps and prognostic maps for mineral resources prospecting are prepared.
Geophysical data application workflow is shown in Fig 2.
2.3 Data Selection
After receiving the data, the project team first checked whether the contents of the index map, data CD, grid data graph and other parts are complete according to the data collection requirements.Later on, the team checked the specific conditions of each part.
(1) For data discs, it is necessary to check the data record format, the corresponding coordinates of each data point, the number of elements, and the number of grid data points.
There are 8 types of formats for the data submitted: MS Access mdb format, MS Excel.xls format, PGD1.0 or PGD 2.0 of 020 format and dbf format of provincial Regional Geochemical Exploration Database system, .txt format, MapGIS det format, Foxpro, or dbf format of Dbase database.
(2) For grid data graphs or large-grid code maps, it is necessary to check consistency between the values and data in the database, and between the sheet designation and data in the database.
(3) For the index map and description, it is necessary to check the map title, sheet designation, number of rows and columns, the coordinates of the lower left corner, and the input order of data.
The data passing a preliminary investigation was registered.The registration contents included the submission unit, address, submission time, submitter name, contact phone number, submission way and submission content.
The submissions were registered one by one, including:
(1) The disc, which was marked and file name and other contents were described.
(2) The grid data graph.The map title and sheet designation were registered and the province’s serial number on the figure’s head was printed.For example, the national code of Fujian province is 35FJ, so its figure number should start from 350001.If there are 25 maps for the entire province, the map’s sequence number would end at 350025.Occasionally, when there are several corner frames in a picture, the sequence number would be kept the same.When there are multiple pictures of different elements in the same sheet, the sequence number does not change, and the foot code-n is added for distinguishing the case.
(3) The index map and description.If any doubt is discovered in the process of data receiving, the receiver would contact the submission units to resolve the problem.After data’s preliminary acceptance, the China Geological Survey issued acceptance certificates and sent them to the units that provided the data.
2.4 Data Management
The data submitted by the provinces (autonomous regions and municipalities directly under the central government) was divided into two major parts: raw data and verification data.
The original data include 30 sets of 1:200, 000 and 1:500, 000 regional geochemical exploration data provided by provinces across the country.These data were classified according to provinces.All data in classified statistics include 29 index charts of all provinces, excluding Ningxia Autonomous Region, a total of 944 grid data map or large-grid code maps, 64 data discs, and 20 data floppy disks, with a total of 1, 421, 213 data points (the quantum of aggregate data reaching 55.4 million) of nearly 39 elements and oxides (See Table 2).
Table 2. Summary of Statistics of China Nationwide Regional Geochemical Exploration DataThe verification data includes 30 sets of inspection and acceptance documents established for each province.The contents of the documents include printed grid data maps of database of each province, original color geochemical maps of each province and various acceptance forms, as shown in Table 3.
Table 3. Inspection Data for Nationwide Regional Geochemical Exploration Data2.5 Data Processing
The objective of data processing is to ensure the accuracy and authenticity of data.The idea is to provide a set of reliable and high-quality underlying data for the establishment of a national geochemical database and mapping.The team carried out data processing from the following main aspects:
(1) Checking Repetitions
Data were retrieved and placed into a new document (mdb) for storage, before being inputted into the regional geochemical data information management system, GeoMDIS.Repetitions were detected and displayed on feedback information template.Data were put into the database again after removing repetitive information.
(2) Detection of Storage Status
Tracking, detection and troubleshooting were carried out during the processes of system update, data retrieval, and transferring of reported data into GeoMDI system database.Data anomalies were traced and errors were eliminated, which mainly related to storage failure, storage overflow or system error.
(3) Detection of Maximum and Minimum Values
Detection of maximum and minimal values applies principally to the error of “out of limits” or “illegal values”, including symbol errors.After being sent as feedback to the related province, the incorrect data were corrected by the province and put into the database again.
(4) Detection and Adjustment of Unit of Measurement
Detection was carried out to address the issue that there may be several possible units of measuring Ag, Au, Hg and Cd and other elements in reported data.Moreover, methods of direct comparison with adjoining sheet or province and preparation of data diagram for comparison were employed to identify and correct errors pertaining to measurement units after verifying with the province reporting data.
(5) Detection of Missing Elements and Sheets
BMP image library was established using the GeoMDIS system to detect whether the absence of elements and sheets is consistent with the reporting instructions.Repetitive verifications were carried out for serious absence of elements and sheets.
(6) Preparation of Bitmaps, Proofreading and Detection of Reported Blueprints and Graphic Images
Some auxiliary programs were prepared for this work by utilizing the function of GeoMDIS system according to specific circumstances and actual needs.Relevant redundancy errors were eliminated to obtain a table of reported data re-formed by each province, for subsequent preparation of bitmaps, proofreading and detection of reported blueprints and graphic images.Where coordinate dislocation and errors of rows and columns were found, re-examination was carried out to determine whether they were consistent with reported original data.In this way, the possibility of entry errors was eliminated.Later on, the errors were recorded and the related provinces were contacted.After the confirmation of error, correct data were reported again and put into the database to form a new table of reported data.
(7) Recording, Appraisal and Correction of Detection Results
Adjustment and correction of data reported by each province is a serious and careful work.The person responsible for reporting the data of each province (supervisor or direct producer of data document) was informed of data correction.The person responsible for reporting the data of each province confirmed the results.Correction of data was provided with reasonable basis and corrected data were reported again when necessary.
3. Description of Data Sample
Geochemical data in the database was retrieved according to the mapsheet (code) unit or province/region (code).Generally, no single-element retrieval was practical.Data structure is shown in Table 4.
Table 4. Main Data Table of Regional Geochemical Elements4. Data Quality Control and Evaluation
4.1 Quality of Basic Data
Regional geochemical exploration work in each province (autonomous region and municipality) started in early 1980s.It was carried out under the unified arrangements of the Ministry of Geology and Mineral Resources and in accordance with the Regulations on Regional Geochemistry Exploration——Nationwide Scanning Program (RGE-NSP), issued by the former Ministry of Geology and Mineral Resource, and Specifications of Regional Geochemical Exploration.The work was carried out uniformly in accordance with the relevant specifications on work arrangement, sampling method, sample processing, standard sample preparing, sample analysis to organization of data, etc.To this end, each province (autonomous region, and municipality) reported high-quality data.
However, the reported data varied in quality for two main reasons: long time span of regional geochemical exploration carried out in each province (autonomous region and municipality), wherein the working period of many provinces (autonomous region and municipality) exceeded 20 years; and difference in specific circumstances, management methods, technical measures, and methods of analysis of each province (autonomous region and municipality).In order to guarantee high-quality data, the reported data were subjected to strict examination and quality control prior to entry.
The following steps were adopted for data examination and quality control:
(1) The reported CD data and accompanying materials (provincial index map and sheet grid coded diagram) were checked if the data positions are consistent with index map and sheet grid coded map.
If a province (autonomous region, and municipality) reported the grid data diagram of an element, then the data was also verified in addition to the examination of coordinate positions.Moreover, special emphasis was laid on the examination of high-point values and coordinates.
For example, the data point position of Ag in Huangpi sheet, Hubei was found to be inconsistent with the coordinates on grid-coded diagram.It was also inconsistent with the coordinates of other elements.Entry error was confirmed in Hubei grid data diagram of Ag owing to ineffective communication attributable to the remote nature of the area.Subsequently, Ag element of the sheet was entered into the database again.
Moreover, coordinates of Pingyang sheet and Fuyingdao sheet of Fujian were found to be dislocated by 2 kilometers.Such errors were pointed out and subsequently corrected by Fujian.
Furthermore, by comparing the CaO data in the Kangbao sheet of Hebei with grid data diagram, it was found that abscissas were dislocated by 2 km.Therefore, the data was re-entered after correction.
Meanwhile, the order of magnitude of Hg in Hekou sheet of Yunnan was inaccurate.Therefore, all the data figures in the sheet were divided by 1, 000 to reach the magnitude order of 10−9.Coordinates of data in Xichang sheet of Yunnan were also inaccurate.They have been replaced with the accurate data in the same sheet of Sichuan.
(2) Maps were prepared by using reported data.
They were examined by means of image display.Data reported by each province (autonomous region and municipality) were used for establishing data workspace.The data of the provinces (autonomous region and municipality) were used for generating 39 data images per the preparation method of geochemical maps.Later on, they were compared with geologic maps and known metallogenic belts.The quality of data was examined through viewing data images.
For example, Sanjiang metallogenic belt in the east of Tibet extends toward northeast on the screen image, which is apparently inconsistent with the reality.After examination, it was found that the starting points in multiple sheets of Tibet were set at the top left corner by mistake (should have been lower left corner) at the time of data reporting.
Moreover, the images of 39 elements in Luoyang sheet of Henan showed evident variations.After examination, it was found that the number of rows and columns were mistaken at the time of sheet entry.
Furthermore, some elements (Cr, Hg, Ni and U) in Huitong sheet of Hunan showed an NEE regular stripe throughout the sheet on the screen image.It was inconsistent with majority of elements.After examination, it was found that the number of rows and columns of such elements in this sheet were mistaken at the time of separate entry.Distortion of Th image in Yueyang sheet is attributable to “entry error”.
Meanwhile, when examining data with screen images, sampling and analysis system errors were found for a number of provinces (autonomous regions and municipalities) among both inter-provincial and provincial sheets and even among 1:50, 000 sheets.The issue was relatively worse for some provinces (autonomous regions and municipalities).These identified errors remained untreated at the time of entry to maintain the original conditions of data.
(3) Methodology of Statistics of Data Characteristics
The data with evident entry errors were identified through statistics of characteristic values.For instance, in maximum values, SiO2 > 100%, Fe2O3, MgO = 99%, etc.These data were inputted after correction of errors.
According to examination results, data of a relatively better quality were reported by 11 provinces and cities: Jilin, Jiangsu, Zhejiang, Anhui, Fujian, Shandong, Guangdong, Hainan, Guizhou, Shaanxi and Beijing.
Meanwhile, upon examination, some issues were found in the data reported by 10 provinces and cities: Hebei, Henan, Hubei, Hunan, Guangxi, Sichuan, Yunnan, Inner Mongolia, Gansu and Tibet.These issues have been addressed through research and sufficient reciprocal communication with relevant personnel in the provinces, finally achieving a relatively good overall quality.
At the same time, analysis data of some elements were found missing from some sheets of Jiangxi, Shanxi, Liaoning, Qinghai and Heilongjiang.Some sheets were prepared in early stage and analysis results of some elements were missing in some sheets, with a poor quality of element data.
Furthermore, many issues were found in Project 305 of Ningxia and Xinjiang.In a unique case, some elements of Ningxia showed evident east-west horizontal stripes in all sheets of the region.The cause for such a situation is hard to be determined at present.Due to a number of exploration agencies participating in the RGE-NSP in Xinjiang, some data issues, especially in the sheets undertaken by Project 305, cannot be verified, checked and corrected by original exploration agencies.
4.2 Mapping Quality
In accordance with the technical application requirements of geochemical exploration materials, experts at the National Resource Potential Evaluation Geochemical Exploration Group developed the Work Program for Consolidation of National Geochemical Exploration Data after several rounds of modifications.National consolidated maps were executed in accordance with the mapping elements, technological process of mapping methodology and representations of maps required by the program.Geochemical mapping work was mainly carried out on MapGIS or GeoExpl software platforms.In addition, it was normalized in accordance with the data model to form maps that meet data requirements.Moreover, following the preparation of maps, through 100% self-inspection and 100% mutual inspection, some maps were printed out.Later on, the maps were modified and improved by experts after examination to meet the technical mapping requirements.Furthermore, it was ensured that the schematic expression and map legends meet geochemical exploration mapping data model requirements and other relevant specifications.
4.3 Quality of Achievement Database
Map database was constructed in the process of mapping.Attribute database was constructed for national achievement maps in accordance with geochemical exploration data model.It was realized by using GeoMagm, MapGIS and GeoExpl and other software.In order to ensure the quality of attribute contents, the said contents were collected by experienced professionals in accordance with relevant technical requirements for national mineral resource potential evaluation.In this way, it was ensured that integrated information is collected as far as possible.Moreover, after the consolidation of relevant national materials, comprehensive examinations were carried out to attribute achievement maps data by means of human-machine interaction.All in all, it has been ensured that the quality meets overall technical requirements.
5. Conclusions
(1) Over the course of 30 years of undertaking national regional geochemical exploration, the state has invested a great sum of funds and acquired colossal amounts of significant basic data.It has produced significant achievements in mineral survey, geochemical research and other aspects.However, some data are on the brink of being lost because the data are scattered among different geological survey agencies, which have being changing (being reformed) along the time.Through the establishment of this database, such valuable data resources have been saved.
(2) Testing data of 39 elements and oxides of 1:200, 000 and 1:500, 000 regional geochemical exploration of 28 provinces (autonomous regions and municipalities) across the nation have been consolidated for the first time, with 1.42 million data points in total and nearly 55.40 million data pieces, involving 1, 299 mapsheets at scale of 1:200, 000 and 18 mapsheets at scale of 1:500, 000.
(3) A large regional geochemical data management system based on GIS and network technologies has been developed and the China Regional Geochemical Exploration Database has been established.
(4) This geochemical mapping has integrated the testing data of 39 elements and oxides of 1:200, 000 and 1:500, 000 scales of regional geochemical exploration of 28 provinces, autonomous regions, and municipalities across the Nation.It has integrated, organized and saved massive data being accumulated for more than 30 years of regional geochemical exploration.This achievement will continue to play a significant role in mineral prospecting, regional planning of metallogenic prospects, predicting mineral resources potentials, geological mapping, carrying out basic geological studies, and evaluating environment and land quality, among other relevant ends.
(5) A spatial database has been prepared with various kinds of geochemical maps and achievement maps in accordance with Application Data Model of Geochemical Exploration Materials and item information requirements.
-
表 1 数据库(集)元数据简表
表 2 全国区域化探数据汇总资料统计
表 3 全国区域化探数据检查资料统计
表 4 区域地球化学元素主数据
Table 1. Metadata table of Database (Dataset)
Table 2. Summary of Statistics of China Nationwide Regional Geochemical Exploration Data
Table 3. Inspection Data for Nationwide Regional Geochemical Exploration Data
Table 4. Main Data Table of Regional Geochemical Elements
-
南君亚.1985.地球化学数据库在筹建中[J].矿物岩石地球化学通报, (1):48-48. http://www.wanfangdata.com.cn/details/detail.do?_type=perio&id=QK000002008111
向运川.2001.省级区域化探数据库信息系统(PGD2.0)[C].中国地质科学院"九五"科技成果汇编.
向运川.2002.区域地球化学数据管理信息系统的实现技术[J].物探与化探, 26(3):209-214. doi: 10.3969/j.issn.1000-8918.2002.03.010
谢学锦, 任天祥, 奚小环, 张立生.2009.中国区域化探全国扫面计划卅年[J].地球学报, 30(6):700-716. doi: 10.3321/j.issn:1006-3021.2009.06.003
谢学锦.1979.区域化探全国扫面工作方法的讨论[J].物探与化探, 3(1):18-26. http://www.wanfangdata.com.cn/details/detail.do?_type=perio&id=QK000003242262
谢学锦.1992.中国化探走向2000年[J].物探与化探, 16(2):81-86. http://www.wanfangdata.com.cn/details/detail.do?_type=perio&id=QK000003243304
Nan Junya.1985.Geochemistry database is under preparation[J].Bulletin of Mineralogy, Petrology and Geochemistry, (1):48-48 (in Chinese with English abstract).
Xiang Yunchuan.2001.Provincial geochemical exploration database information system (PGD2.0)[A].Chinese Academy of Geological Sciences "Ninth Five-Year Plan" Scientific and Technological Achievement[C] (in Chinese).
Xiang Yunchuan.2002.Implementation and techniques of regional geochemical data management and information system[J].Geophysical and Geochemical Exploration, 26(3):209-214 (in Chinese with English abstract). http://www.wanfangdata.com.cn/details/detail.do?_type=perio&id=wtyht200203010
Xie Xuejing, Ren Tianxiang, Xi Xiaohuan, Zhang Lishenghe.2009.Implementation of the regional geochemistry-national recon-naissance program (RGNR) in China in the past thirty years[J].Acta Geoscientica Sinica, 30(6):700-716 (in Chinese with English abstract).
Xie Xuejing.1979.Discussion on the working method of regional geochemical exploration[J].Geophysical and Geochemical Exploration, 3(1):18-26 (in Chinese). http://www.wanfangdata.com.cn/details/detail.do?_type=perio&id=wtyht200906015
Xie Xuejing.1992.Geochemical exploration in china toward the year 2000[J].Geophysical and Geochemical Exploration, 16(2):81-86 (in Chinese). http://cn.bing.com/academic/profile?id=6e329a08af594301d1bedd46b6686d6c&encoded=0&v=paper_preview&mkt=zh-cn
期刊类型引用(14)
1. 杨元良,王章翔,郭建强,宋祥峰,张人栖,王喻. 四川道孚容须卡稀有金属矿区土壤地球化学特征及找矿预测. 矿产与地质. 2024(01): 126-134 . 百度学术
2. 高学正,孔昭煜,商云涛,李晓蕾,齐钒宇,张波. 基于地质成果现状的基础地质调查发展策略研究. 地质通报. 2024(10): 1881-1891 . 百度学术
3. 李长江,徐亮,王佳彬,刘亿盈,杨深然. 辽宁省实物地质资料信息化管理服务的实践与思考. 中国矿业. 2023(07): 15-23 . 百度学术
4. 范堡程,张晶,孟广路,薛仲凯,吴欢欢,曹积飞,刘明义,洪俊,唐卫东,刘天航,MиpзoeB TaBφик,Xacaзoдa Caóзaли. 帕米尔构造结锂矿资源潜力评价——基于1: 100万地球化学调查. 西北地质. 2022(01): 156-166 . 百度学术
5. 庄天明,李小飞,王新彦. 红土型金矿地质特征、控矿因素及找矿标志. 西北地质. 2022(02): 176-184 . 百度学术
6. 陈昌昕,严加永,刘卫强,罗凡,张冲,徐峣,程志中,汪洋. 武陵—江南造山带中段地壳结构及其物质组成差异——基于地球化学和地球物理异常特征研究. 地球学报. 2022(06): 785-802 . 百度学术
7. 史长义,冯斌,彭敏,张富贵,张必敏,孔牧,白金峰,周国华,孙跃. 勘查地球化学现状与展望. 物探化探计算技术. 2022(06): 671-697 . 百度学术
8. 齐钒宇,李晓蕾,高学正,孔昭煜,张波,商云涛. 基于地质资料开发利用的地质数据库体系构建与应用研究. 自然资源信息化. 2022(06): 25-33 . 百度学术
9. 奚小环. 大数据科学从信息化、模式化到智能化:现代地球化学应用研究的新范式. 地学前缘. 2021(01): 308-317 . 百度学术
10. 左仁广,王健,熊义辉,王子烨. 2011~2020年勘查地球化学数据处理研究进展. 矿物岩石地球化学通报. 2021(01): 81-93+4 . 百度学术
11. 胡冰,聂阳,刘娜,王永魁,徐伟祥. 山东夏庄幅1: 50000水系沉积物测量数据集. 中国地质. 2021(S2): 100-111 . 本站查看
12. 汪子杰,张德明,郑文龙,胡冰,聂阳. 山东东里幅、韩旺幅1: 50000水系沉积物测量数据集. 中国地质. 2021(S2): 112-123 . 本站查看
13. 左玉山,龚庆杰,江彪,张通,吴轩,严桃桃. 内蒙古双尖子山银多金属矿床区域地球化学特征. 现代地质. 2021(05): 1411-1424 . 百度学术
14. 吴玉诗,王海建,车海龙,赵虹旭,马录录,李爱民,刘臣臣,孙冬雪,马铭,李东宇. 吉林省浑江市幅1∶50000水系沉积物测量原始数据集. 中国地质. 2020(S2): 31-63 . 本站查看
其他类型引用(3)
-