

The advantage of the nonlinear mixed model and its application in typical seismically active areas in China
-
摘要:
b值作为地震预报与危险性评价研究中的重要参数,受到广泛关注与讨论。通过非线性混合模型对中国地震目录数据库开展地震震级-频数分布拟合,并利用该方法计算得到的b值对地震活动进行分析评价。文章首先以中国26个地震带为研究区,收集1920—2019年的4.7级以上地震数据为完整地震目录,分别通过非线性混合模型与传统G-R模型进行拟合,并对比其效果;进一步以西藏地区为具体试验区,选择1920—2019年的地震目录数据,以10年为间隔,将非线性混合模型应用于西藏地区地震震级-频数模型的拟合。其次,利用矩震级与地震矩转换公式计算出非线性混合模型中的相关变量。最后,利用非线性混合模型对地震数据进行非线性回归分析。结果显示:当b值出现低值时,对应时间段前后有地震发生,b值较低时,发生的地震震级大、频次底;b值相对较高时,地震震级小、频次高。将非线性混合模型应用到中国及邻区完整地震数据中,能够对数据进行更加全面的分析,克服了传统模型方法对高震级和地震数据分析中的局限性,合理分析计算b值,进而增强对地震目录数据的分析和评价。
Abstract:As an essential parameter in earthquake prediction and risk assessment research, the b-value has received extensive attention and discussion. In this study, we chose a nonlinear mixed model to fit the earthquake magnitude-frequency distribution to the China Earthquake Catalog database. The b-values calculated by this method were used to analyze and evaluate the seismic activity. This paper takes 27 seismic belts in China as the research area, collects earthquake data of magnitude 4.7 and above from 1920 to 2019 as a complete earthquake catalog, performs mixed model fitting and G-R model fitting for these 27 seismic belts, and compares the fitting effects. Taking Xizang as the test area, the earthquake catalog data from 1920 to 2019 were selected, and the nonlinear mixed model was applied to fitting the earthquake magnitude-frequency model in Xizang at 10-year intervals. Firstly, the earthquake data screened in the study area was classified and counted by magnitude and time; Secondly, the relevant variables in the nonlinear mixed model were calculated using the moment magnitude and seismic moment conversion formula. Finally, a nonlinear hybrid model was used to perform nonlinear regression analysis on the seismic data. The results show that: When low values of b occur, earthquakes occur around the corresponding periods. When b-values are low, earthquakes of large magnitude and low frequency occur. When b-values are relatively high, earthquakes of small magnitude and high frequency occur. Applying the nonlinear mixed model to the complete seismic data in China and neighboring regions enables a more comprehensive analysis of the data and overcomes the limitations of the traditional modeling method in analyzing earthquakes of high magnitude. The b-value will be calculated by rational analysis, which enhances the analysis and evaluation of seismic catalog data.
-

-
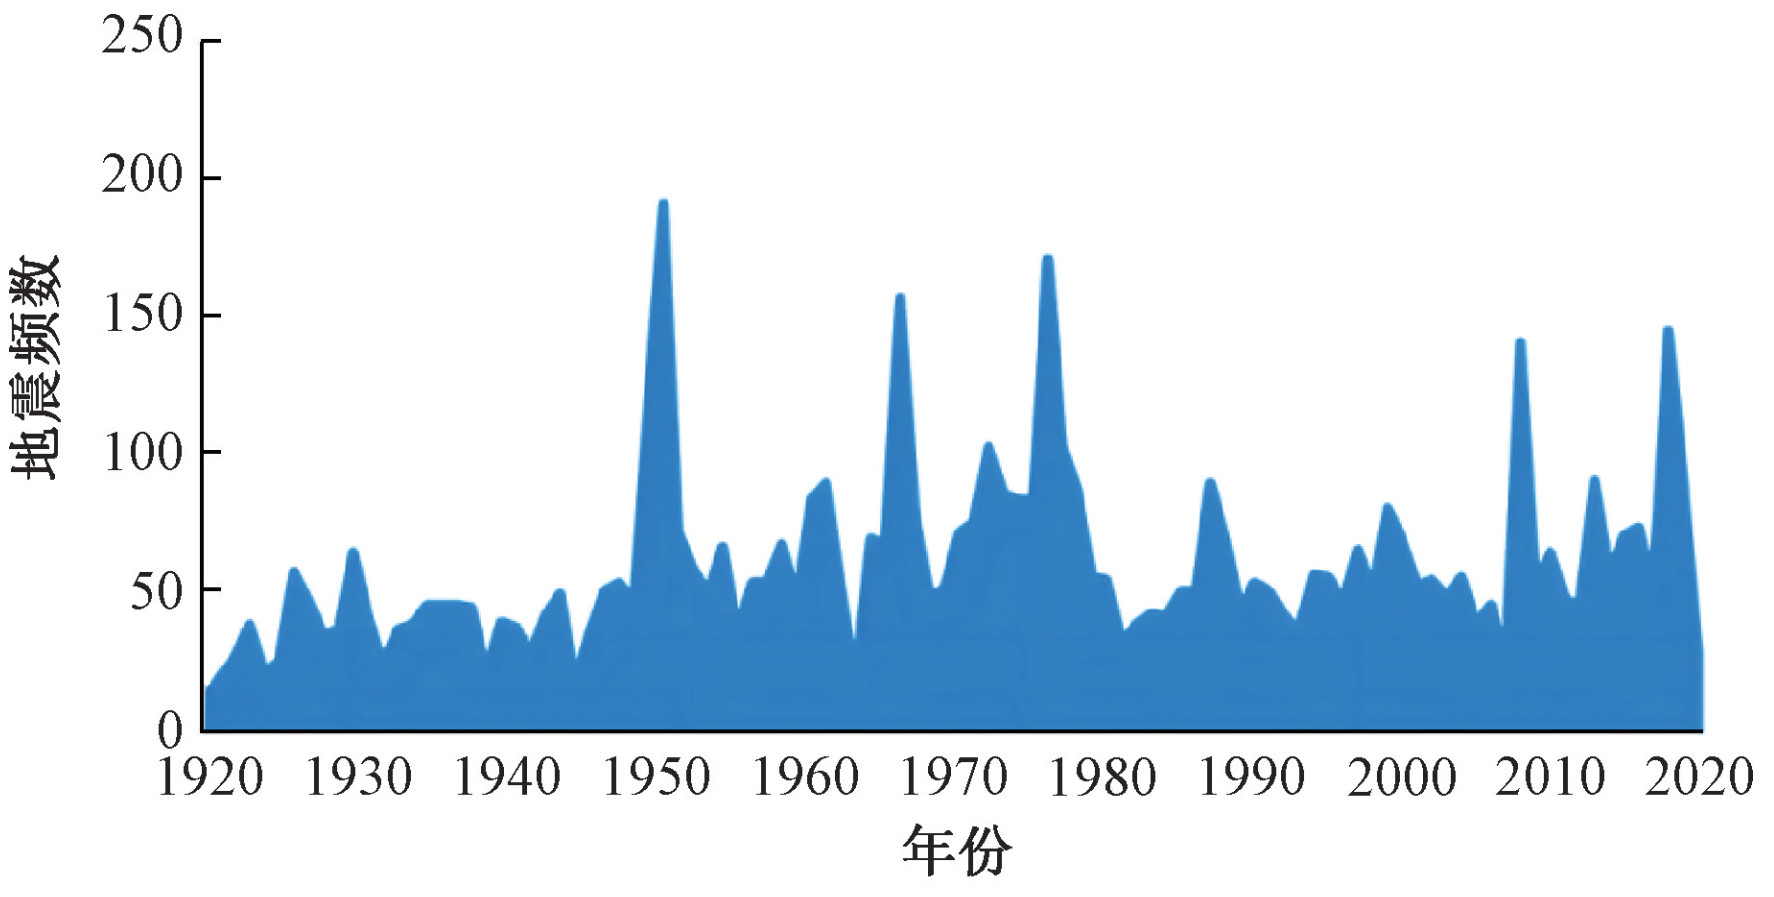
图 2 中国1920—2019年4.7级以上地震时间分布(地震数据源自于国家地震科学数据中心;
https://data.earthquake.cn/ )Figure 2.
表 1 相关参数MW、MO、MO-1、MO2对应表
Table 1. Correspondence table of MW, MO, MO-1 and MO2
MW MO MO-1 MO2 4.7 1.32396×e12 7.55308×e-13 1.75288×e24 4.9 1.58884×e12 6.29389×e-13 2.52442×e24 5.1 1.90050×e12 5.26178×e-13 3.61189×e24 5.3 2.26613×e12 4.41281×e-13 5.13534×e24 5.5 2.69389×e12 3.71210×e-13 7.25706×e24 5.7 3.19301×e12 3.13184×e-13 1.01953×e25 5.9 3.77386×e12 2.64981×e-13 1.42420×e25 6.1 4.44814×e12 2.24813×e-13 1.97859×e25 6.3 5.22897×e12 1.91242×e-13 2.73421×e25 6.5 6.13107×e12 1.63104×e-13 3.75900×e25 6.7 7.17089×e12 1.39453×e-13 5.14217×e25 6.9 8.36683×e12 1.19520×e-13 7.00038×e25 7.1 8.96245×e12 1.11577×e-13 8.03255×e25 7.3 9.79301×e12 1.02114×e-13 9.59030×e25  下载: 导出CSV
表 2 各区域参数值表
Table 2. Table of parameter value for each area
区域 a b a1 a2 a3 Ⅰ-1 10.446 1.561 -1.26×e12 1.98×e-26 -3.45×e-13 Ⅰ-2 10.484 1.349 -1.29×e12 1.98×e-27 -8.79×e-14 Ⅱ-1 5.319 0.569 — -4.13×e-26 4.95×e-13 Ⅱ-2 4.874 0.582 — 1.73×e-27 6.03×e-15 Ⅱ-3 10.776 2.002 — — -3.48×e-13 Ⅲ-1 5.473 0.967 5.45×e13 -6.84×e-27 1.82×e-13 Ⅲ-2 8.840 1.300 -1.07×e12 -2.58×e-27 -1.06×e-13 Ⅲ-3 6.856 0.988 -9.46×e10 9.96×e-27 -1.82×e-13 Ⅲ-4 5.423 0.797 3.13×e11 1.87×e-26 -2.77×e-13 Ⅲ-5 5.533 0.666 -8.22×e11 -5.84×e-27 1.22×e-13 Ⅲ-6 3.843 0.341 — — 1.96×e-13 Ⅲ-7 12.194 2.643 — — -1.12×e-12 Ⅳ 11.368 1.839 -1.72×e12 1.58×e-26 -4.18×e-13 Ⅴ-1 11.863 1.769 -1.35×e12 4.21×e-27 -2.07×e-13 Ⅴ2-1 9.317 1.401 -9.47×e11 1.20×e-26 -2.89×e-13 Ⅴ2-2 7.617 1.128 -6.00×e11 5.58×e-27 -1.98×e-13 Ⅴ2-3 12.348 2.125 -9.94×e11 2.67×e-26 -5.89×e-13 Ⅴ3-1 6.950 0.858 -9.84×e11 -1.83×e-26 1.92×e-13 Ⅴ3-2 10.604 1.532 -1.22×e12 9.47×e-27 -2.75×e-13 Ⅴ4-1 7.600 0.876 -5.68×e11 -6.57×e-27 4.51×e-14 Ⅴ4-2 2.570 0.103 7.60×e11 4.95×e-27 6.31×e-14 Ⅴ4-3 5.402 0.714 4.59×e11 2.21×e-26 -2.30×e-13 Ⅵ-1 4.853 0.616 5.98×e11 2.71×e-26 -2.21×e-13 Ⅵ-2 7.534 1.059 -9.93×e11 -1.38×e-27 -8.67×e-14 Ⅵ-3 6.141 0.858 -1.40×e11 -3.72×e-27 -1.60×e-14 Ⅵ-4 6.630 0.859 -6.29×e11 -4.38×e-27 -1.93×e-14 注:Ⅰ-1—台湾西部地震带;Ⅰ-2—台湾东部地震带;Ⅱ-1—长江中游地震带;Ⅱ-2—华南沿海地震带;Ⅱ-3—右江地震带;Ⅲ-1—长江下游-南黄海地震带;Ⅲ-2—郯庐地震带;Ⅲ-3—华北平原地震带;Ⅲ-4—汾渭地震带;Ⅲ-5—银川-河套地震带;Ⅲ-6—朝鲜地震带;Ⅲ-7—鄂尔多斯地震带;Ⅳ—东北地震带;Ⅴ-1—西昆仑-帕米尔地震带;Ⅴ2-1—龙门山地震带;Ⅴ2-2—六盘山-祁连山地震带;Ⅴ2-3—柴达木-阿尔金地震带;Ⅴ3-1—巴颜喀拉山地震带;Ⅴ3-2—鲜水河-滇东地震带;Ⅴ4-1—喜马拉雅地震带;Ⅴ4-2—滇西南地震带;Ⅴ4-3—藏中地震带;Ⅵ-1—南天山地震带;Ⅵ-2—中天山地震带;Ⅵ-3—北天山地震带;Ⅵ-4—阿尔泰山地震带;由于公元1920—2019年Ⅵ-5塔里木-阿拉善地震带仅有1条地震数据,故文中在27个地震带中共建立26个完整地震目录
下载: 导出CSV
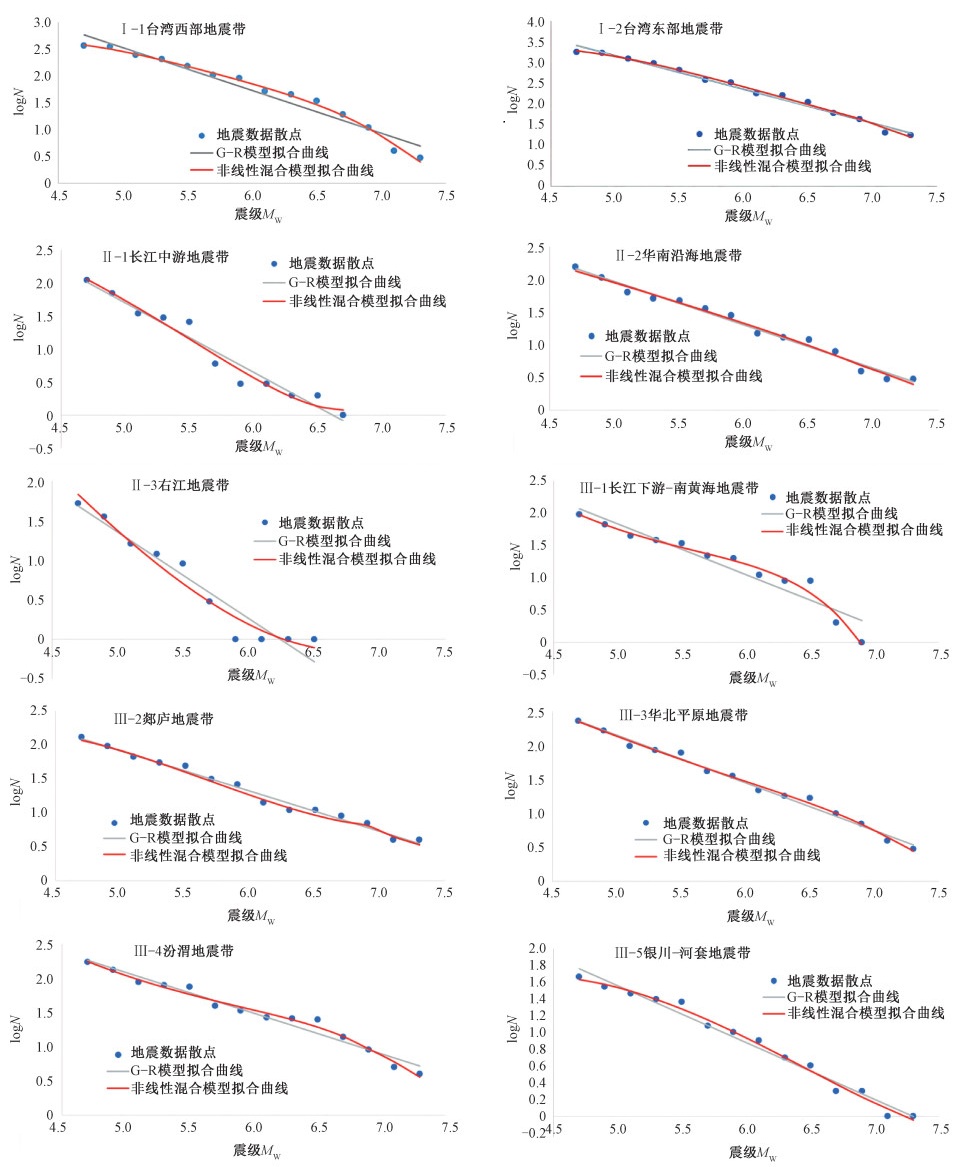
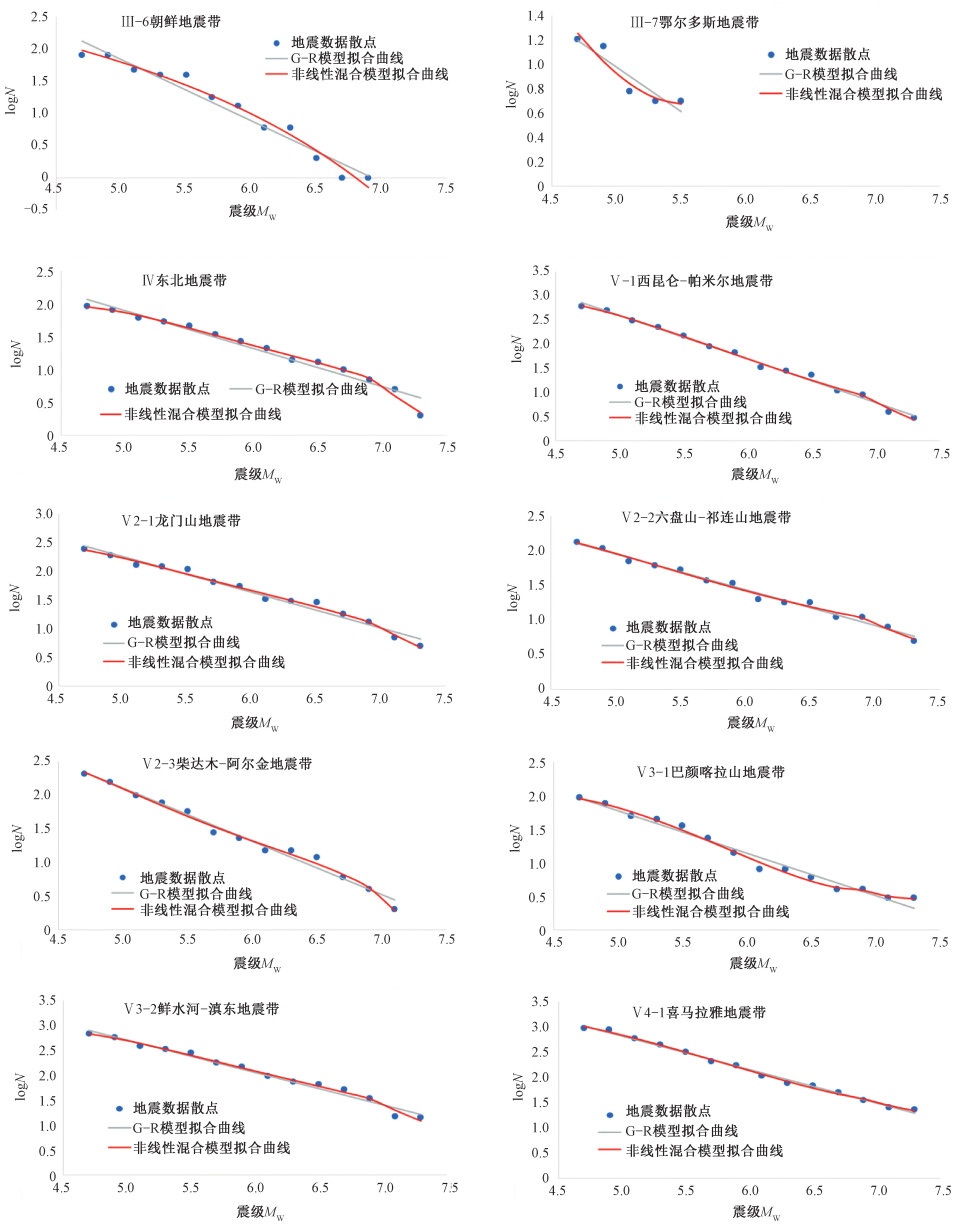
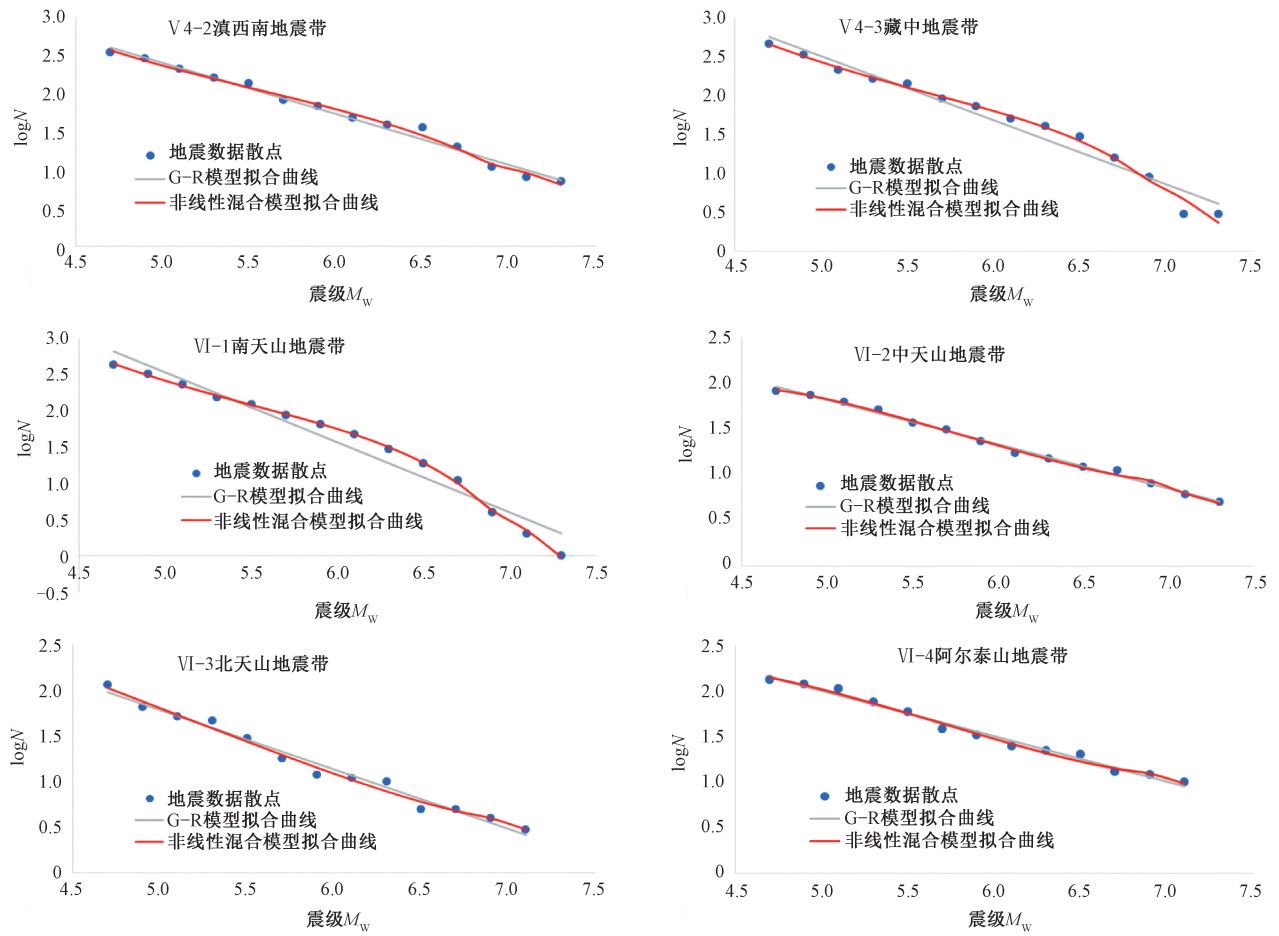
表 3 各研究区非线性混合模型拟合度与G-R模型拟合度对比表
Table 3. Comparison table of the fitting degree of the nonlinear mixed model and the G-R model in each study area
区域 非线性拟合度R2 G-R拟合度R2 区域 非线性拟合度R2 G-R拟合度R2 区域 非线性拟合度R2 G-R拟合度R2 Ⅰ-1 0.994 0.955 Ⅲ-5 0.990 0.980 Ⅴ3-2 0.992 0.983 Ⅰ-2 0.995 0.986 Ⅲ-6 0.977 0.957 Ⅴ4-1 0.997 0.995 Ⅱ-1 0.965 0.955 Ⅲ-7 0.965 0.943 Ⅴ4-2 0.993 0.986 Ⅱ-2 0.986 0.984 Ⅳ 0.994 0.963 Ⅴ4-3 0.990 0.963 Ⅱ-3 0.954 0.931 Ⅴ-1 0.996 0.993 Ⅵ-1 0.999 0.957 Ⅲ-1 0.980 0.912 Ⅴ2-1 0.991 0.979 Ⅵ-2 0.997 0.995 Ⅲ-2 0.989 0.986 Ⅴ2-2 0.989 0.987 Ⅵ-3 0.987 0.982 Ⅲ-3 0.993 0.989 Ⅴ2-3 0.992 0.984 Ⅵ-4 0.991 0.987 Ⅲ-4 0.986 0.967 Ⅴ3-1 0.993 0.976 注:Ⅰ-1—台湾西部地震带;Ⅰ-2—台湾东部地震带;Ⅱ-1—长江中游地震带;Ⅱ-2—华南沿海地震带;Ⅱ-3—右江地震带;Ⅲ-1—长江下游-南黄海地震带;Ⅲ-2—郯庐地震带;Ⅲ-3—华北平原地震带;Ⅲ-4—汾渭地震带;Ⅲ-5—银川-河套地震带;Ⅲ-6—朝鲜地震带;Ⅲ-7—鄂尔多斯地震带;Ⅳ—东北地震带;Ⅴ-1—西昆仑-帕米尔地震带;Ⅴ2-1—龙门山地震带;Ⅴ2-2—六盘山-祁连山地震带;Ⅴ2-3—柴达木-阿尔金地震带;Ⅴ3-1—巴颜喀拉山地震带;Ⅴ3-2—鲜水河-滇东地震带;Ⅴ4-1—喜马拉雅地震带;Ⅴ4-2—滇西南地震带;Ⅴ4-3—藏中地震带;Ⅵ-1—南天山地震带;Ⅵ-2—中天山地震带;Ⅵ-3—北天山地震带;Ⅵ-4—阿尔泰山地震带
下载: 导出CSV
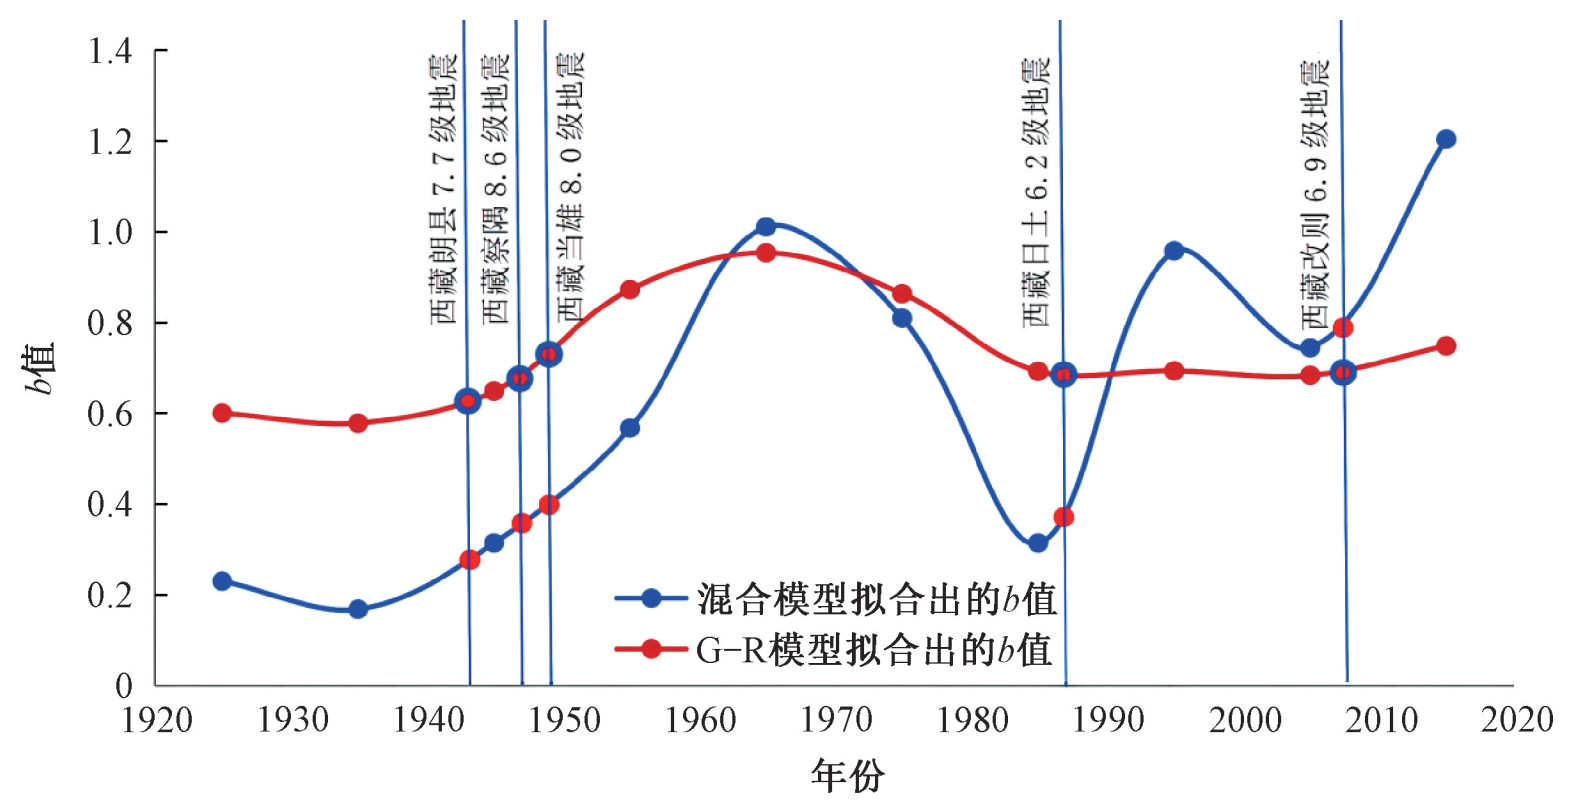
表 4 西藏地区1920—2019年10年间隔G-R模型和混合模型b值对比表
Table 4. Comparison table of the b-values of the G-R model and the nonlinear mixed model for 10-year intervals from 1920 to 2019 in Xizang
组别 时间/年 b值
(传统G-R模型)b值
(非线性混合模型)1 1920—1929 0.598 0.228 2 1930—1939 0.576 0.166 3 1940—1949 0.646 0.312 4 1950—1959 0.870 0.565 5 1960—1969 0.951 1.008 6 1970—1979 0.861 0.807 7 1980—1989 0.690 0.312 8 1990—1999 0.691 0.955 9 2000—2009 0.681 0.742 10 2010—2019 0.746 1.201
下载: 导出CSV
-
BERRILL J B, DAVIS R O, 1980. Maximum entropy and the magnitude distribution[J]. Bulletin of the Seismological Society of America, 70(5): 1823-1831.
CHEN S J, WANG Z C, TAO J Q, 1998. Nonlinear magnitude frequency relation and two types of seismicity systems[J]. Acta Seismologica Sinica, 11(2): 207-218. doi: 10.1007/s11589-998-0058-y
CHEN S J, 2004. Clustering characteristics of spatial-temporal distribution of earthquakes in different tectonic regions[D]. Beijing: Institute of Geology, China Earthquake Administration. (in Chinese with English abstract)
CHENG Q M, AGTERBERG F P, BALLANTYNE S B, 1994. The separation of geochemical anomalies from background by fractal methods[J]. Journal of Geochemical Exploration, 51(2): 109-130. doi: 10.1016/0375-6742(94)90013-2
CHENG Q M, 1999. Multifractality and spatial statistics[J]. Computers & Geosciences, 25(9): 949-961. doi: 10.3321/j.issn:0254-4164.1999.09.009
CHENG Q M, 2008. A combined power-law and exponential model for streamflow recessions[J]. Journal of Hydrology, 352(1-2): 157-167. doi: 10.1016/j.jhydrol.2008.01.017
CHENG Q M, 2012. Singularity theory and methods for mapping geochemical anomalies caused by buried sources and for predicting undiscovered mineral deposits in covered areas[J]. Journal of Geochemical Exploration, 122: 55-70. doi: 10.1016/j.gexplo.2012.07.007
CHENG Q M, 2014. Vertical distribution of elements in regolith over mineral deposits and implications for mapping geochemical weak anomalies in covered areas[J]. Geochemistry: Exploration, Environment, Analysis, 14(3): 277-289. doi: 10.1144/geochem2012-174
COSENTINO P, FICARRA V, LUZIO D, 1977. Truncated exponential frequency-magnitude relationship in earthquake statistics[J]. Bulletin of the Seismological Society of America, 67(6): 1615-1623. doi: 10.1785/BSSA0670061615
EVERNDEN J F, 1970. Study of regional seismicity and associated problems[J]. Bulletin of the Seismological Society of America, 60(2): 393-446. doi: 10.1785/BSSA0600020393
FLINN E A, ENGDAHL E R, 1965. A proposed basis for geographical and seismic regionalization[J]. Reviews of Geophysics, 3(1): 123-149. doi: 10.1029/RG003i001p00123
FLINN E A, ENGDAHL E R, HILL A R, 1974. Seismic and geographical regionalization[J]. Bulletin of the Seismological Society of America, 64(3-2): 771-992. doi: 10.1785/BSSA0643-20771
General Administration of Quality Supervision, Inspection and Quarantine of the People's Republic of China, China National Standardization Administration, 2016 Seismic Parameter Zoning Map of China: GB 18306-2015 [S] Beijing: China Standards Publishing House. (in Chinese)
GUTENBERG B, RICHTER C F, 1944. Frequency of earthquakes in California[J]. Bulletin of the Seismological Society of America, 34(4): 185-188. doi: 10.1785/BSSA0340040185
GUTENBERG B, RICHTER C F, 1954. Seismicity of the Earth and Related Phenomena[M]. 2nd ed. Princeton: Princeton University Press.
GUTENBERG B, RICHTER C F, 1956a. Earthquake magnitude, intensity, energy, and acceleration: (second paper)[J]. Bulletin of the Seismological Society of America, 46(2): 105-145. doi: 10.1785/BSSA0460020105
GUTENBERG B, RICHTER C F, 1956b. Magnitude and energy of earthquakes[J]. Annals of Geophysics, 9(1): 1-15.
JIANG F Y, JI L Y, ZHAO Q, 2021. Numerical simulation of the present seismic risk of the Haiyuan-Liupanshan fault zone[J]. Journal of Geomechanics, 2021, 27(2): 230-240. (in Chinese with English abstract)
KAGAN Y Y, 1997. Seismic moment-frequency relation for shallow earthquakes: regional comparison[J]. Journal of Geophysical Research: Solid Earth, 102(B2): 2835-2852. doi: 10.1029/96JB03386
LIU Z X, 2020. Study on the pre-earthquake anomaly characteristics of b-value in the north-south seismic belt[D]. Lanzhou: China Earthquake Administration Lanzhou Institute of Seismology. (in Chinese with English abstract)
LOMNITZ-ADLER J, LOMNITZ C, 1979. A modified form of the Gutenberg-Richter magnitude-frequency relation[J]. Bulletin of the Seismological Society of America, 69(4): 1209-1214.
MA J, 2015. Seismic catalogue of east China (2300 BC-2500 AD)[Z]. A Big Earth Data Platform for Three Poles. (in Chinese)
MAIN I G, BURTON P W, 1984. Information theory and the earthquake frequency-magnitude distribution[J]. Bulletin of the Seismological Society of America, 74(4): 1409-1426.
MAIN I G, BURTON P W, 1986. Long-term earthquake recurrence constrained by tectonic seismic moment release rates[J]. Bulletin of the Seismological Society of America, 76(1): 297-304. doi: 10.1785/BSSA0760010297
MEI S R, 1960. Seismicity in China[J]. Acta Geophysica Sinica, 9(1): 1-19. (in Chinese)
MENG Q, GAO K, CHEN Q Z, et al., 2021. Seismogenic, coseismic and postseismic deformation and stress evolution of the 2008 Wenchuan earthquake: numerical simulation analysis[J]. Journal of Geomechanics, 27(4): 614-627. (in Chinese with English abstract)
MENG Z T, LIU J W, XIE Z J, et al., 2021. Analysis of the correlation between the temporal-spatial distribution of b-value and seismic hazard: a review[J]. Progress in Geophysics, 36(1): 30-38. (in Chinese with English abstract)
QIN C Y, 2006. Nonlinear analysis of the frequency-magnitude relationship in the western Circum-Pacific region[J]. ZHANG R F, Li J S, trans. Translated World Seismology(4): 27-37. (in Chinese)
SUN H Y, 2016. A combined non-linear model for earthquake magnitude-frequency distribution characterization[D]. Beijing: China University of Geosciences (Beijing). (in Chinese with English abstract)
WANG W, DAI W L, HUANG B S, 1994. Statistical distribution of earthquake magnitude and the anomalous change of earthquake magnitude factor Mf value before mid-strong earthquakes occured in North China[J]. Earthquake Research in China, 10(S): 95-110. (in Chinese with English abstract)
ZHANG P Z, DENG Q D, ZHANG Z Q, et al., 2013. Active faults, earthquake hazards and associated geodynamic processes in continental China[J]. Science China Earth Sciences, 43(10): 1607-1620. (in Chinese)
ZHOU B G, CHEN G X, GAO Z W, et al., 2013. The technical highlights in identifying the potential seismic sources for the update of national seismic zoning map of China[J]. Technology for Earthquake Disaster Prevention, 8(2): 113-124. (in Chinese with English abstract)
陈时军, 2004. 不同构造环境的地震活动丛集特征研究[D]. 北京: 中国地震局地质研究所.
蒋锋云, 季灵运, 赵强, 2021. 海原-六盘山断裂带现今地震危险性的数值模拟分析[J]. 地质力学学报, 2021, 27(2): 230-240. https://www.cnki.com.cn/Article/CJFDTOTAL-DZLX202102008.htm
刘子璇, 2020. 南北地震带b值震前异常特征研究[D]. 兰州: 中国地震局兰州地震研究所.
马瑾, 2015. 中国地震目录(公元前2300年-2005年)[Z]. 时空三极环境大数据平台.
梅世蓉, 1960. 中国的地震活动性[J]. 地球物理学报, 9(1): 1-19. https://www.cnki.com.cn/Article/CJFDTOTAL-DQWX196001000.htm
孟秋, 高宽, 陈启志, 等, 2021. 2008年汶川大地震孕震、同震及震后变形和应力演化全过程的数值模拟[J]. 地质力学学报, 27(4): 614-627. https://journal.geomech.ac.cn/cn/article/doi/10.12090/j.issn.1006-6616.2021.27.04.051
孟昭彤, 刘静伟, 谢卓娟, 等, 2021. b值的时空分布特征与地震危险性的关联分析[J]. 地球物理学进展, 36(1): 30-38.
QIN C Y, 2006. 环西太平洋地区的频度—震级关系非线性分析[J]. 张瑞芳, 李俊拴, 译. 世界地震译丛(4): 27-37.
孙红云, 2016. 非线性混合模型在地震震级—频率分布研究中的应用[D]. 北京: 中国地质大学(北京).
王炜, 戴维乐, 黄冰树, 1994. 地震震级的统计分布及其地震强度因子Mf值在华北中强以上地震前的异常变化[J]. 中国地震, 10(S): 95-110.
张培震, 邓起东, 张竹琪, 等, 2013. 中国大陆的活动断裂、地震灾害及其动力过程[J]. 中国科学: 地球科学, 43(10): 1607-1620.
中华人民共和国国家质量监督检验检疫总局, 中国国家标准化管理委员会, 2016. 中国地震动参数区划图(GB 18306-2015)[S]. 北京: 中国标准出版社.
周本刚, 陈国星, 高战武, 等, 2013. 新地震区划图潜在震源区划分的主要技术特色[J]. 震灾防御技术, 8(2): 113-124. https://www.cnki.com.cn/Article/CJFDTOTAL-ZZFY201302002.htm
-

图(7)
表(4)
计量
- 文章访问数: 1432
- PDF下载数: 87
- 施引文献: 0