

Ecological hazard assessment of heavy metal pollution in sediments of Taiyu water system in Xiaoqinling
-
摘要:
以金矿开发影响的黄河二级支流太峪水系沉积物为研究对象,沿河采集16个表层沉积物样品,分层采集垂向剖面10件水库沉积物样品,测定了样品中重金属元素Hg、Pb、Cd、Cr、As、Cu和Zn的含量,采用Hakanson潜在生态指数法和Tomlinson污染负荷指数法评价重金属元素污染程度和潜在生态风险。结果表明,矿业活动是太峪水系沉积物重金属元素污染的主要因素;变异系数、富集系数和最高污染系数均反映Hg、Pb、Cd是太峪水系沉积物的特征污染重金属元素,Cr和As的质量分数接近地区背景值;太峪水系表层沉积物受到重金属元素的极强污染,山区段污染较山外更严重;整个流域的Hg、Pb、Cd具有很强的潜在生态危害,Cr、As、Zn的潜在生态危害轻微;太峪水系沉积物垂向各层沉积物都受到重金属元素的极强污染,生态问题以Hg、Pb、Cd的潜在生态危害为主,其污染和生态危害程度都高于流向上的沉积物。潜在生态危害指数评价突出了不同元素的毒性和危害程度,而污染负荷指数法侧重于样本空间上的污染程度,二者互补使用有利于实际问题的全面评价。
Abstract:On the basis of the sediments of Taiyu River, a secondary tributary of the Yellow River affected by the gold mine development, 16 surface sediment samples were collected along the river and 10 reservoir sediment samples in vertical section were collected in layers. The values of heavy metals Hg, Pb, Cd Cr, As, Cu and Zn in the Taiyu River sediments were determined. The Hakanson potential ecological index method and the Tomlinson pollution load index method were used to evaluate the degree of heavy metal pollution and potential ecological risk. The results show that the mining activities are the main factors of heavy metal pollution in the sediments of Taiyu River system The coefficient of variation, enrichment coefficient and maximum pollution coefficient all show that heavy metals are the characteristic elements of Hg, Pb and Cd in the sediments of Taiyu water system, and the mass fraction of Cr and As is close to the background value of the region. The surface sediments of Taiyu water system are affected by extremely heavy pollution of heavy metals, and are more seriously polluted in the mountain section than in other areas. Hg, Pb and Cd in the whole basin have strong potential ecological risk, and the potential ecological risk of Cr, As and Zn is slight. Sediments are extremely polluted by heavy metals. The ecological problems are mainly the potential ecological hazards of Hg, Pb and Cd, and their pollution and ecological damage are all higher than deposits along the flow. The evaluation of potential ecological risk index highlights the toxic and harmful levels of different elements, the Pollution Load Index focuses on the degree of contamination of the sample space, and the complementary use of both is conducive to a comprehensive evaluation of practical problems.
-

-
表 1 重金属背景参考值和毒性系数
Table 1. The background reference and toxicity coefficients of heavy metals
元素 Hg Pb Cd Cr As Cu Zn Cn/(mg·kg-1) 0.25 25 0.50 60 15 30 80 毒性响应系数 40 5 30 2 10 5 1  下载: 导出CSV
表 2 潜在生态风险指数(Ri)分级标准
Table 2. Graduation standard of Ri
生态危害系数( $\mathit{E}_{\rm{r}}^{\rm{i}}$ )或指数(Ri)生态危害程度 $\mathit{E}_{\rm{r}}^{\rm{i}}$ <40或Ri<150轻微 40 ≤ $\mathit{E}_{\rm{r}}^{\rm{i}}$ <80或150 ≤Ri<300中等 80 ≤ $\mathit{E}_{\rm{r}}^{\rm{i}}$ <160或300≤Ri<600强 160 ≤ $\mathit{E}_{\rm{r}}^{\rm{i}}$ <320或Ri>600很强
下载: 导出CSV
表 3 污染负荷指数等级划分
Table 3. The rank partition of pollution load index
PLI值 <1 1~2 2~3 ≥3 污染等级 0 I Ⅱ Ⅲ 污染程度 无污染 中等污染 强污染 极强污染
下载: 导出CSV
表 4 重金属元素对照值
Table 4. The contrast values of heavy metal elements
元素 Hg Pb Cd Cr As Cu Zn 对照值 0.27 47.58 0.28 79.25 15.6 28.45 91.2
下载: 导出CSV
表 5 太峪水系沉积物重金属元素含量
Table 5. The content of heavy metals in the sediments of Taiyu River
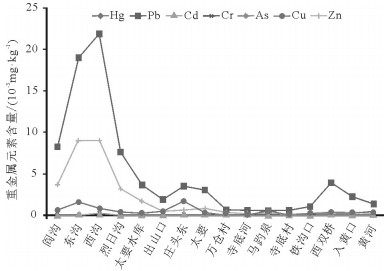
mg/kg 元素 Hg Pb Cd Cr As Cu Zn 范围 0.68~245 588~21825 0.71~89.6 17.8~96.4 0.88~10.1 53.3~1675 85~9000 平均值 42.21 5008.44 17.66 47.44 3.94 492.82 1888.63 标准差 66.8 6458.81 28.45 23.76 3.29 485.47 2981.77 变异系数 1.58 1.29 1.61 0.50 0.83 0.99 1.58
下载: 导出CSV
表 6 太要水库沉积物剖面重金属元素含量
Table 6. The content of heavy metals in the sediments of Taiyao reservoir
mg/kg 元素 Hg Pb Cd Cr As Cu Zn 范围 3.85~278 1130~25100 4.2~101.8 15.1~50.6 0.78~4.16 83~1530 1550~10625 平均值 90.995 10160 46.62 28.81 2.262 789.3 4995 标准差 80.42 7323.85 30.64 11.90 0.93 445.10 3092.84 变异系数 0.88 0.72 0.66 0.41 0.41 0.56 0.62 垂向/横向 2.16 2.03 2.64 0.61 0.57 1.60 2.64
下载: 导出CSV
表 7 太峪水系沉积物重金属元素富集系数
Table 7. The concentration factor of heavy metals in the sediments of Taiyu River
位置 Hg Pb Cd Cr As Cu Zn 阎沟 130.40 330.00 57.00 0.64 0.13 19.93 46.25 东沟 572.00 758.00 179.20 1.61 0.22 52.50 112.50 西沟 980.00 873.00 166.20 1.04 0.07 29.17 112.50 烈日沟 408.00 306.00 61.20 0.30 0.15 14.67 39.38 太要水库 163.20 150.00 33.20 1.05 0.31 9.83 21.88 出山口 130.40 77.20 10.44 0.92 0.09 11.00 6.88 庄头东 44.80 140.20 8.80 0.54 0.21 55.83 7.43 太要镇北 40.80 123.60 17.00 0.48 0.35 13.53 10.31 万仓村 2.72 28.76 10.88 0.57 0.06 2.69 4.61 寺底河 22.28 24.40 1.80 1.19 0.07 1.78 1.51 马趵泉 17.20 23.52 2.44 0.52 0.09 11.73 1.06 寺底村 18.20 24.76 1.42 0.49 0.08 3.20 2.06 铁沟口 36.56 42.20 2.44 0.95 0.58 7.00 1.86 西双桥 48.80 158.20 5.20 0.49 0.48 9.03 4.38 入黄口 45.20 92.00 5.80 0.41 0.67 10.67 3.44 黄河 40.80 53.56 2.00 1.48 0.65 10.27 1.69 平均值 168.84 200.34 35.31 0.79 0.26 16.43 23.61
下载: 导出CSV
表 8 太峪水系沉积物重金属元素潜在生态危害系数(
$\mathit{E}_{\rm{r}}^{\rm{i}}$ )和指数(Ri)Table 8. Potential ecological harm index and factor of heavy metals in the sediments of Taiyu River
位置 $\mathit{E}_{\rm{r}}^{\rm{i}}$ Ri 等级 Hg Pb Cd Cr As Cu Zn 阎沟 5216 1650 1710 1.28 1.3 99.65 46.25 8724.48 很强 东沟 22880 3790 5376 3.22 2.2 262.5 112.5 32426.42 很强 西沟 39200 4365 4986 2.08 0.7 145.85 112.5 48812.13 很强 烈日沟 16320 1530 1836 0.6 1.5 73.35 39.38 19800.83 很强 太要水库 6528 750 996 2.1 3.1 49.15 21.88 8350.23 很强 出山口 5216 386 313.2 1.84 0.9 55 6.88 5979.82 很强 庄头东 1792 701 264 1.08 2.1 279.15 7.43 3046.76 很强 太要镇北 1632 618 510 0.96 3.5 67.65 10.31 2842.42 很强 万仓村 108.8 143.8 326.4 1.14 0.6 13.45 4.61 598.80 强 寺底河 891.2 122 54 2.38 0.7 8.9 1.51 1080.69 很强 马趵泉 688 117.6 73.2 1.04 0.9 58.65 1.06 940.45 很强 寺底村 728 123.8 42.6 0.98 0.8 16 2.06 914.24 很强 铁沟口 1462.4 211 73.2 1.9 5.8 35 1.86 1791.16 很强 西双桥 1952 791 156 0.98 4.8 45.15 4.38 2954.31 很强 入黄口 1808 460 174 0.82 6.7 53.35 3.44 2506.31 很强 黄河 1632 267.8 60 2.96 6.5 51.35 1.69 2022.30 很强 平均值 6753.4 1001.69 1059.41 1.59 2.63 82.13 23.61 - - 等级 很强 很强 很强 轻微 轻微 强 轻微 - -
下载: 导出CSV
表 9 太要水库沉积物重金属元素富集系数
Table 9. The concentration factor of heavy metals in the sediments of Taiyao reservoir
深度/cm Hg Pb Cd Cr As Cu Zn 0~8 371.2 334 70.4 0.84 0.28 18.67 41.25 18~16 315.6 408 106.4 0.42 0.17 28.33 79.69 16~30 1112 1004 203.6 0.37 0.21 51.00 132.81 30~35 282 388.4 65.4 0.25 0.16 31.67 36.56 35~46 624 738 185 0.45 0.16 40.67 118.75 46~77 90.8 113.2 43.8 0.35 0.14 11.67 28.75 77~84 282 355.6 106.4 0.41 0.10 31.33 67.19 84~122 78.8 149.6 49.4 0.31 0.10 12.00 32.81 122~150 468 528 93.6 0.74 0.14 35.00 67.19 150~165 15.4 45.2 8.4 0.66 0.05 2.77 19.38 均值 363.98 406.4 93.24 0.48 0.15 26.31 62.44
下载: 导出CSV
表 10 太要水库沉积物重金属元素潜在生态危害系数和指数
Table 10. Potential ecological harm index and factor of heavy metals in the sediments of Taiyao reservoir
深度/cm $\mathit{E}_{\rm{r}}^{\rm{i}}$ Rr 等级 Hg Pb Cd Cr As Cu Zn 0~8 14848 1670 2112 1.69 2.77 93.33 41.25 18769.04 很强 18~16 12624 2040 3192 0.84 1.73 141.67 79.69 18079.93 很强 16~30 44480 5020 6108 0.73 2.08 255.00 132.81 55998.62 很强 30~35 11280 1942 1962 0.50 1.56 158.33 36.56 15380.96 很强 35~46 24960 3690 5550 0.89 1.56 203.33 118.75 34524.53 很强 46~77 3632 566 1314 0.71 1.39 58.33 28.75 5601.18 很强 77~84 11280 1778 3192 0.82 1.04 156.67 67.19 16475.71 很强 84~122 3152 748 1482 0.62 1.04 60.00 32.81 5476.47 很强 122~150 18720 2640 2808 1.48 1.39 175.00 67.19 24413.06 很强 150~165 616 226 252 1.32 0.52 13.83 19.38 1129.05 很强 平均值 14559.2 2032 2797.2 0.96 1.51 131.55 62.44 - - 等级 很强 很强 很强 轻微 轻微 强 中等 - -
下载: 导出CSV
表 11 太峪水系沉积物重金属元素最高污染系数和污染负荷指数
Table 11. The highest pollution factor and pollution load index of heavy metals in the sediments of Taiyu River
位置 CFi PLI(点) 污染程度 PLI(面) PLI(区域) Hg Pb Cd Cr As Cu Zn 阎沟 120.74 173.39 101.79 0.48 0.12 21.02 40.57 14.02 极强 15.9 6.49 东沟 529.63 398.28 320.00 1.22 0.21 55.36 98.68 36.93 极强 西沟 907.41 458.70 296.79 0.78 0.07 30.76 98.68 29.58 极强 烈日沟 377.78 160.78 109.29 0.22 0.14 15.47 34.54 14.13 极强 太要水库 151.11 78.81 59.29 0.79 0.30 10.37 19.19 11.90 极强 出山口 120.74 40.56 18.64 0.70 0.09 11.60 6.03 6.28 极强 庄头东 41.48 73.67 15.71 0.41 0.20 58.88 6.51 7.63 极强 3.79 太要镇北 37.78 64.94 30.36 0.36 0.34 14.27 9.05 7.36 极强 万仓村 2.52 15.11 19.43 0.43 0.06 2.84 4.05 2.14 强 寺底河 20.63 12.82 3.21 0.90 0.07 1.87 1.33 2.00 强 马趵泉 15.93 12.36 4.36 0.39 0.09 12.37 0.93 2.31 强 寺底村 16.85 13.01 2.54 0.37 0.07 3.37 1.81 1.91 中等 铁沟口 33.85 22.17 4.36 0.72 0.56 7.38 1.63 3.98 极强 西双桥 45.19 83.12 9.29 0.37 0.46 9.53 3.84 5.78 极强 41.85 41.85 48.34 10.36 0.31 0.65 11.25 3.02 5.44 极强 黄河 37.78 28.14 3.57 1.12 0.63 10.83 1.48 4.59 极强 平均值 156.33 105.26 63.06 0.60 0.25 17.32 20.71
下载: 导出CSV
表 12 太要水库沉积物重金属元素最高污染系数和污染负荷指数
Table 12. The highest pollution factor and pollution load index of heavy metals in the sediments of Taiyao reservoir
深度/cm CFi PLI(点) 污染程度 PLI(面) Hg Pb Cd Cr As Cu Zn 0~8 343.70 175.49 125.71 0.64 0.27 19.68 36.18 19.08 极强 15.21 18~16 292.22 214.38 190.00 0.32 0.17 29.88 69.90 20.09 极强 16~30 1029.63 527.53 363.57 0.28 0.20 53.78 116.50 35.31 极强 30~35 261.11 204.08 116.79 0.19 0.15 33.39 32.07 15.23 极强 35~46 577.78 387.77 330.36 0.34 0.15 42.88 104.17 28.87 极强 46~77 84.07 59.48 78.21 0.27 0.13 12.30 25.22 8.87 极强 77~84 261.11 186.84 190.00 0.31 0.10 33.04 58.94 17.77 极强 84~122 72.96 78.60 88.21 0.23 0.10 12.65 28.78 8.86 极强 122~150 433.33 277.43 167.14 0.56 0.13 36.91 58.94 22.87 极强 150~165 14.26 23.75 15.00 0.50 0.05 2.92 17.00 3.49 极强 平均值 337.02 213.54 166.50 0.36 0.15 27.74 54.77
下载: 导出CSV
表 13 河流底泥及尾矿渣中重金属元素平均含量及其比值
Table 13. The average content of heavy metals in river sediments and tailings slag and its ratio
Hg Pb Cd Cr As Cu 底泥中平均含量A/(mg.kg-1) 42.21 5008.44 17.66 47.44 3.94 492.82 尾矿渣中平均含量B/(mg.kg-1) 55.49 2034.15 2.26 30.55 2.68 393.4 A/B 0.76 2.46 7.81 1.55 1.47 1.25
下载: 导出CSV
-
[1] Suresh G, Ramasamy V, Sundarrajan M, et al. Spatial and vertical distributions of heavy metals and their potential toxicity levels in various beach sediments from high-background-radiation area, Kerala, India[J]. Marine Pollution Bulletin, 2015, 91(1):389-400. doi: 10.1016/j.marpolbul.2014.11.007
[2] Shah B A, Shah A V, Mistry C B, et al. Assessment of heavy metals in sediments near Hazira industrial zone at Tapti River Estuary, Surat, India[J].Enviromental Earth Sciences, 2013, 69(7):2365-2376. doi: 10.1007/s12665-012-2066-4
[3] 张洪, 林超, 雷沛, 等.海河流域河流富营养化程度总体评估[J].环境科学学报, 2015, 35(8):2336-2344. http://d.old.wanfangdata.com.cn/Periodical/hjkxxb201508005
[4] Kim B S M, Salaroli A B, Ferreina P A L, et al. Spatial distribution and enrichment assessment of heavy metals in surface sediments from Baixada Santista, Southeastern Brazil[J].Marine Pollution Bulletin, 2016, 103(1/2):333-338. http://www.wanfangdata.com.cn/details/detail.do?_type=perio&id=e03c1c0e7af7dd7005254791de58d64c
[5] Ma X L, Zuo H, Tian M J, et al. Assessment of heavy metals contamination in sediments from three adjacent regions of the Yellow River using metal chemical fractions and multivariate analysis techniques[J]. Chemosphere, 2016, 144:264-272. doi: 10.1016/j.chemosphere.2015.08.026
[6] Cho J, Hyun S, Han J H, et al. Historical trend in heavy metal pollution in core sediments from the Masan Bay, Korea[J]. Marine Pollution Bulletin, 2015, 95(1):427-432. doi: 10.1016/j.marpolbul.2015.03.034
[7] Salem Z B, Capelli N, Laffray X, et al. Seasonal variation of heavy metals in water, sediment and roach tissues in a landfill draining system pond(Etueffont, France)[J]. Ecological Engineering, 2014, 69:25-37. doi: 10.1016/j.ecoleng.2014.03.072
[8] 张菊, 陈明文, 鲁长娟, 等.东平湖表层沉积物重金属形态分布特征及环境风险评价[J].生态环境学报, 2017, 26(5):850-856. http://d.old.wanfangdata.com.cn/Periodical/tryhj201705017
[9] 白晓龙, 顾卫兵, 杨春和, 等.通启运河通州段表层底泥重金属污染评价[J].工业安全与环保, 2017, 43(3):103-106. doi: 10.3969/j.issn.1001-425X.2017.03.027
[10] 李璇琼, 李永树, 卢正.矿产资源开发的重金属分布特征研究——以雅砻江流域某铜矿区为例[J].矿产保护与利用, 2016, 3:56-63. http://www.wanfangdata.com.cn/details/detail.do?_type=perio&id=kcbhyly201601010
[11] 王洪涛, 张俊华, 张天宁, 等.开封惠济河水系底泥重金属污染与潜在生态风险评价[J].环境化学, 2016, 35(8):1567-1576. http://d.old.wanfangdata.com.cn/Periodical/hjhx201608003
[12] 张江华, 王葵颖, 赵阿宁, 等.小秦岭金矿区水系沉积物重金属特征研究[J].中国地质, 2013, 40(2):636-642. doi: 10.3969/j.issn.1000-3657.2013.02.027
[13] Hakanson L. An ecological risk index for aquatic pollution control:A sediment logical approach[J]. Water Research, 1980, 14:975-1001. doi: 10.1016/0043-1354(80)90143-8
[14] 徐争启, 倪师军, 庹先国, 等.潜在生态危害指数法评级中重金属毒性系数计算[J].环境科学与技术, 2008, 31(2):112-115. doi: 10.3969/j.issn.1003-6504.2008.02.030
[15] 王婧, 刘桂建, 方婷, 等.基于污染负荷指数法评价淮河(安徽段)底泥中重金属污染研究[J].中国科学技术大学学报, 2013, 43(2):97-103. doi: 10.3969/j.issn.0253-2778.2013.02.002
[16] 高健磊, 王静.两种河道底泥重金属污染生态危害评价方法比较研究[J].环境工程, 2013, 31(2):119-121. doi: 10.3969/j.issn.1674-991X.2013.02.020
[17] 范晓婷, 蒋艳雪, 崔斌, 等.富集因子法中参比元素的选取方法——以元江底泥中重金属污染评价为例[J].环境科学学报, 2016, 36(10):3795-3803. http://www.wanfangdata.com.cn/details/detail.do?_type=perio&id=hjkxxb201610036
[18] 张江华, 杨梅忠, 徐友宁, 等.金矿区水系沉积物重金属含量影响分析[J].黄金, 2008, 29(1):49-51. doi: 10.3969/j.issn.1001-1277.2008.01.013
[19] 徐友宁, 张江华.陕西潼关金矿区太峪河底泥重金属元素的含量及污染评价[J].中国地质, 2008, 27(8):1261-1271. http://d.old.wanfangdata.com.cn/Periodical/zgqydz200808024
-
图(2)
表(13)
计量
- 文章访问数: 504
- PDF下载数: 6
- 施引文献: 0