

Risk assessment and inundation analysis of flood in Langfang region based on ArcGIS
-
摘要:
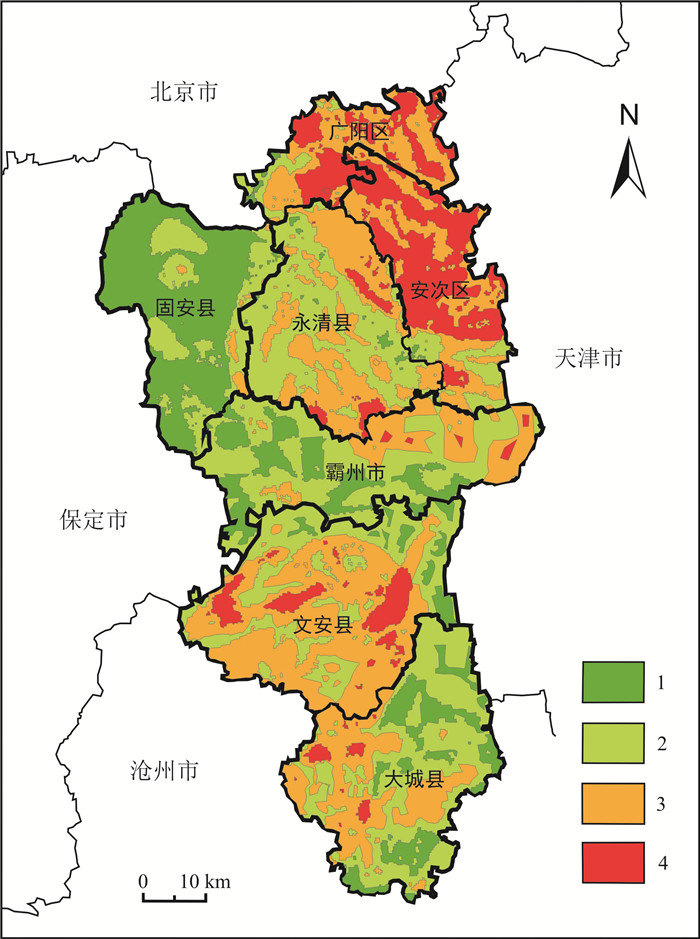
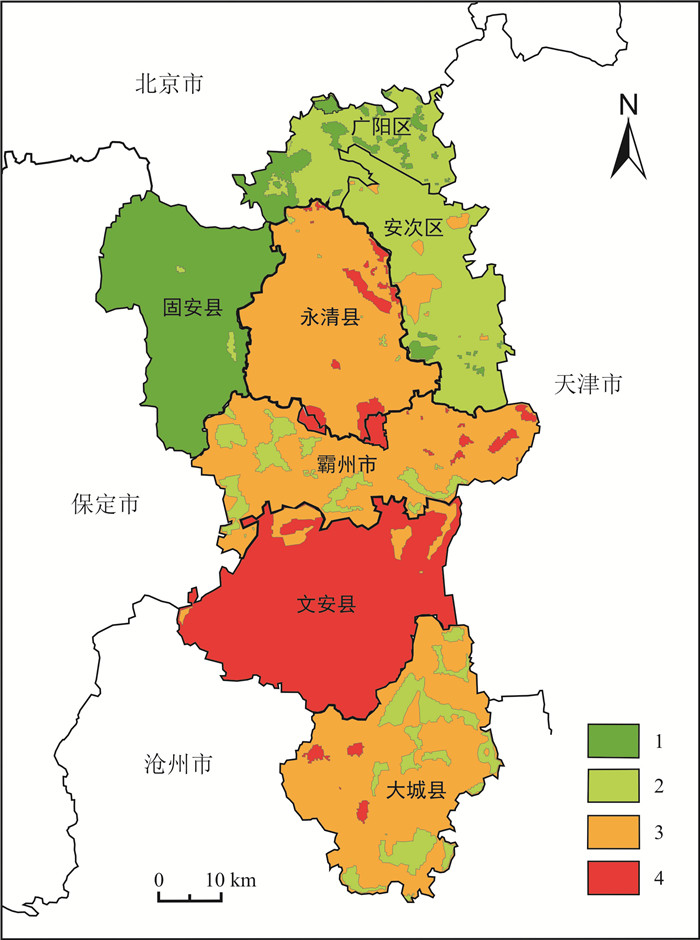
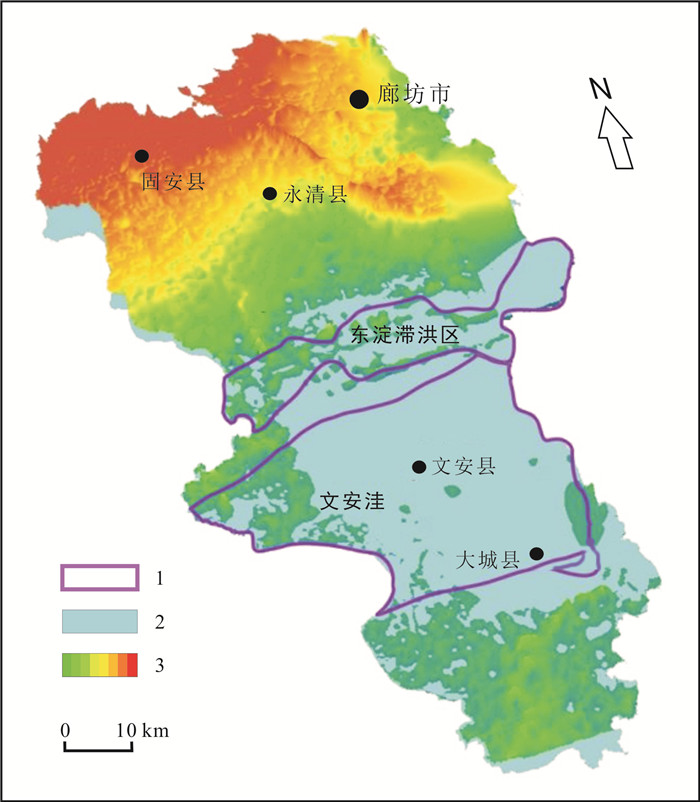
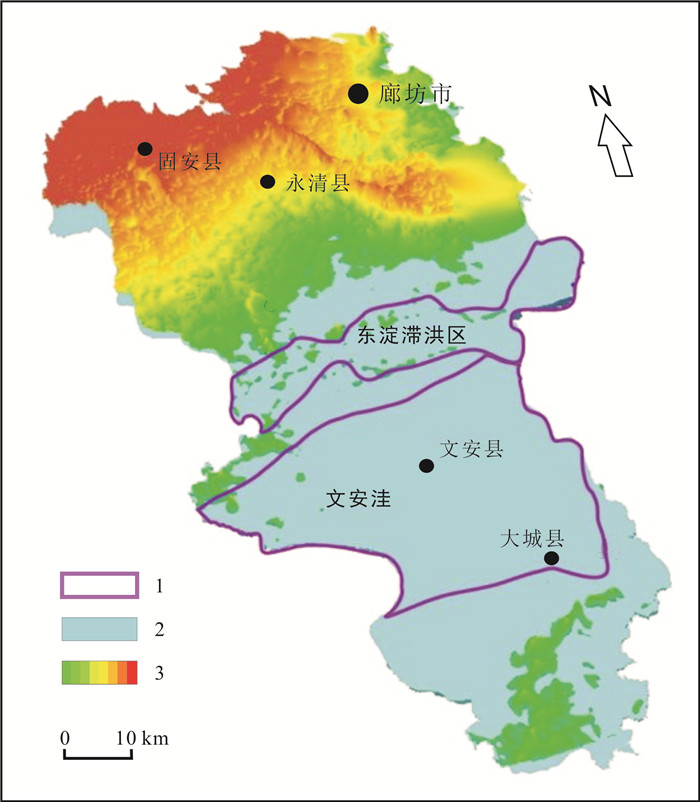
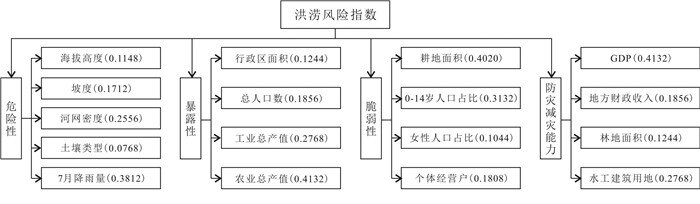
基于ArcGIS平台, 提取高精度DEM数据, 选取洪涝灾害风险评估指标体系因子, 运用洪涝灾害风险评估原理方法、AHP层次分析法、加权综合评价法和ArcGIS空间分析模块重点分析了危险性、暴露性、脆弱性、防灾减灾能力4个复合因子.在自然灾害与社会经济因素的基础上, 对廊坊市广阳、永清、文安、大城等区县洪涝灾害进行风险评估与区划.结果认为, 廊坊地区洪涝灾害综合风险区划呈现出南部洪涝风险大于北部洪涝风险.而快速提取洪水淹没区域范围、水量信息, 取得研究区天然状态下的洪水淹没分析成果, 对洪水灾情评估、救援以及资源分配有着重要意义, 同时可为洪涝灾害预警和防灾减灾提供科学依据.
Abstract:Based on ArcGIS platform, this study extracts the high-precision DEM data, selects the factors of flood disaster risk assessment index system, and uses the methods of flood disaster risk assessment, analytic hierarchy process (AHP), weighted comprehensive evaluation as well as ArcGIS spatial analysis module to analyze four composite factors of risk, exposure, vulnerability and disaster prevention and mitigation capacity. Besides, the risk assessment and zoning of flood disasters in the counties and districts of Langfang City are conducted in terms of natural disasters and socioeconomic factors. The results show that the flood disaster comprehensive risk in the southern area is greater than that in the northern area of the city. The rapid extraction of flood inundation area and water volume information, and analysis results of flood inundation under natural state in the study area is of great significance for flood disaster assessment, rescue and material allocation, which can also provide scientific basis for flood disaster early warning and prevention.
-
Key words:
- flood disaster /
- flood inundation /
- ArcGIS /
- risk assessment /
- Langfang City
-

-
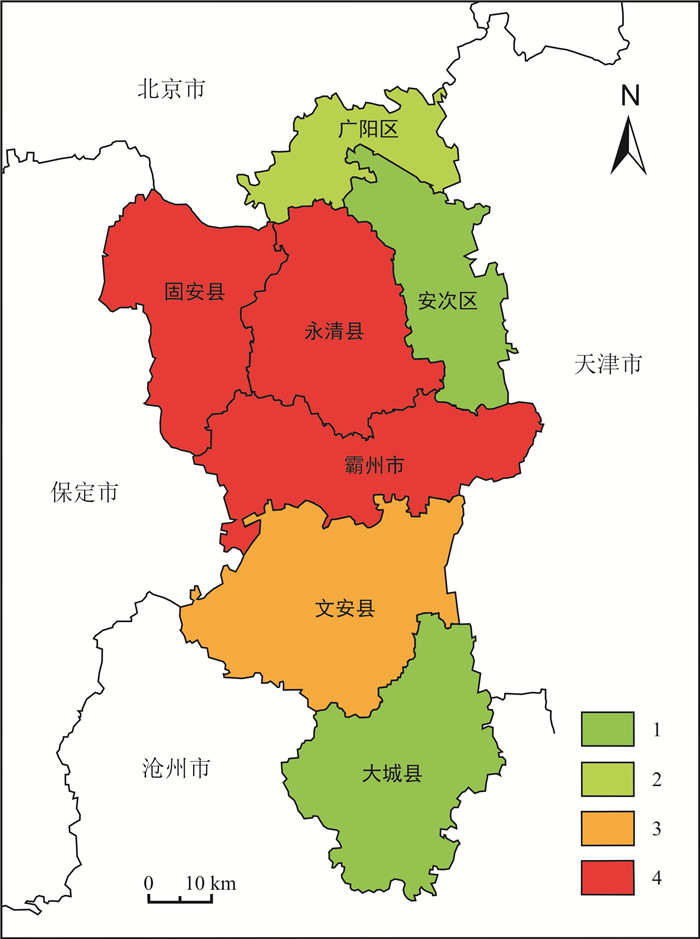
表 1 廊坊市南七区县洪涝灾害危险性等级划分标准
Table 1. Risk levels of flood disaster in Langfang City
危险性指数 0.4937~0.6214 0.6214~0.6845 0.6845~0.7418 0.7418~0.8681 等级 轻危险性 低危险性 中危险性 高危险性  下载: 导出CSV
表 2 廊坊市南七区县洪涝灾害暴露性等级划分标准
Table 2. Exposure levels of flood disaster in Langfang City
暴露性指数 0.3620~0.4026 0.4026~0.4660 0.4660~0.5502 0.5502~0.6272 等级 轻暴露性 低暴露性 中暴露性 高暴露性
下载: 导出CSV
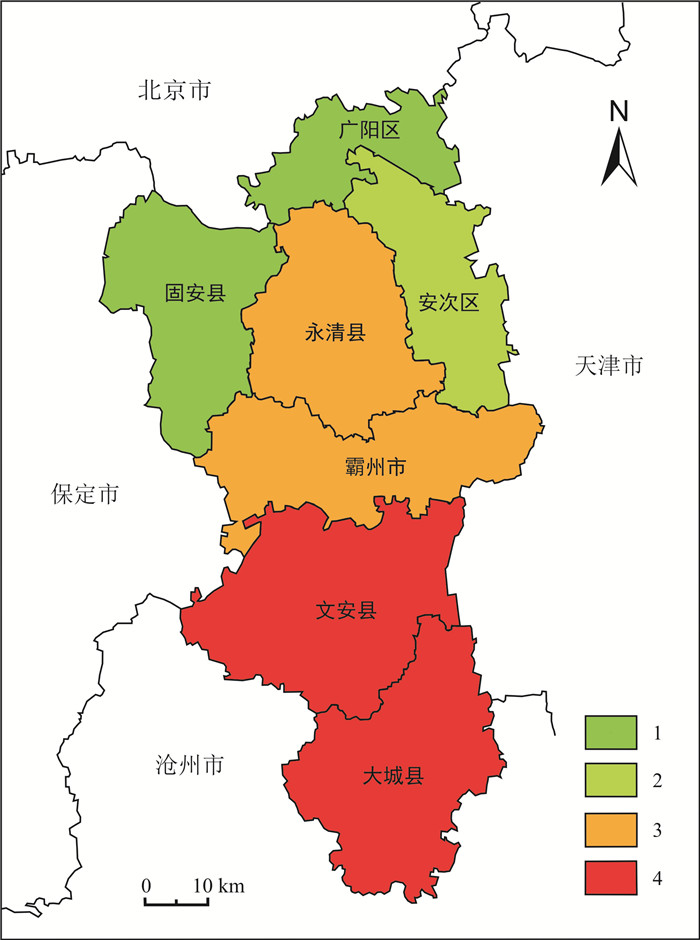
表 3 廊坊市南七区县洪涝灾害脆弱性等级划分标准
Table 3. Vulnerability levels of flood disaster in Langfang City
脆弱性指数 0.4351~0.4869 0.4869~0.5685 0.5685~0.6812 0.6812~0.7654 等级 轻脆弱性 低脆弱性 中脆弱性 高脆弱性
下载: 导出CSV
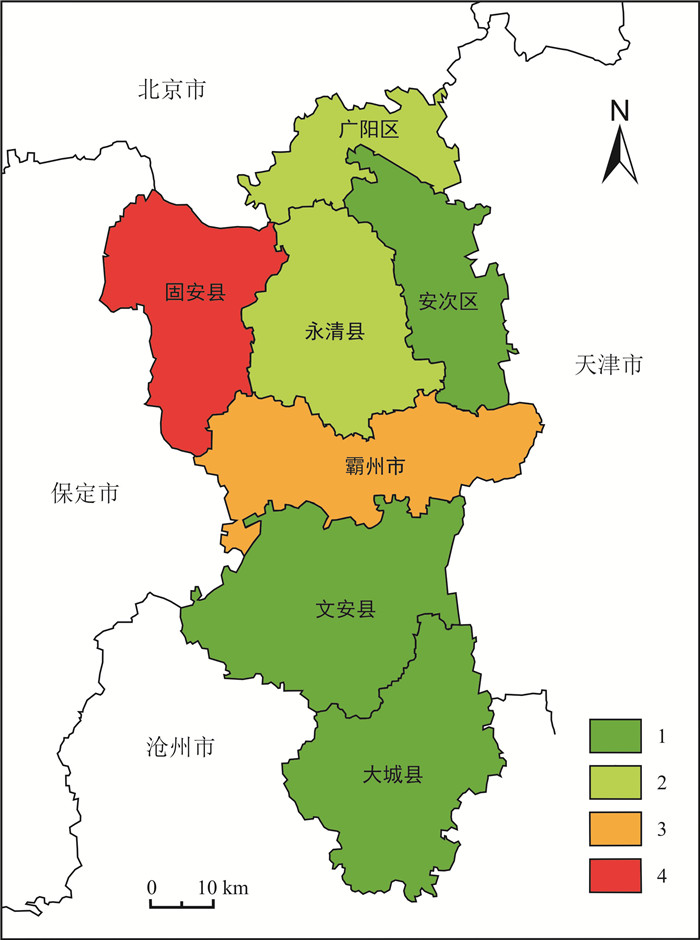
表 4 廊坊市南七区县洪涝灾害防灾减灾能力等级划分标准
Table 4. Flood disaster prevention and mitigation capacity levels of Langfang City
防灾减灾能力指数 0.3000~0.4217 0.4217~0.5658 0.5658~0.7119 0.7119~0.8174 等级 轻防灾减灾能力 低防灾减灾能力 中防灾减灾能力 高防灾减灾能力
下载: 导出CSV
表 5 廊坊市南七区县洪涝灾害综合风险等级划分标准
Table 5. Comprehensive risk levels of flood disaster in Langfang City
综合风险指数 0.4515~0.5483 0.5483~0.6238 0.6238~0.6867 0.6867~0.7722 等级 轻度风险 低度风险 中度风险 高度风险
下载: 导出CSV
表 6 允许最大降水量计算表
Table 6. Calculation results of maximum allowable precipitation
计算面积/km2 渗透系数/(cm/s) 入渗量/108m3 洪水量/108m3 最大淹没深度/m 淹没面积/km2 降雨量/mm 3612 0.00005 2.1 47.5 6.1 2347 1375
下载: 导出CSV
-
[1] 方佳毅, 史培军. 全球气候变化背景下海岸洪水灾害风险评估研究进展与展望[J]. 地理科学进展, 2019, 38(5): 625-636.
Fang J Y, Shi P J. A review of coastal flood risk research under global climate change[J]. Progress in Geography, 2019, 38(5): 625-636.
[2] 冯凌彤. 基于GIS技术的河南省洪灾风险评估与分析[J]. 人民黄河, 2022, 44(5): 67-70, 74.
Feng L T. Flood risk assessment and analysis of Henan Province based on GIS technology[J]. Yellow River, 2022, 44(5): 67-70, 74.
[3] 王清川, 寿绍文, 许敏, 等. 廊坊市暴雨洪涝灾害风险评估与区划[J]. 干旱气象, 2010, 28(4): 475-482.
Wang Q C, Shou S W, Xu M, et al. Evaluation and division for risks of rainstorm and flood disasters in Langfang of Hebei Province[J]. Journal of Arid Meteorology, 2010, 28(4): 475-482.
[4] 齐兵. 对廊坊市2012年"7·12"暴雨的反思[J]. 中国水利, 2013(S2): 89-90, 118.
Qi B. Lessons on "7·21" rainstorm in 2012 of Langfang City[J]. China Water Resources, 2013(S2): 89-90, 118.
[5] 齐兵. 廊坊市"16·7"暴雨洪水初探[J]. 地下水, 2017, 39(4): 163-164.
Qi B. Preliminary study on "16·7" rainstorm flood in Langfang City [J]. Ground Water, 2017, 39(4): 163-164. (in Chinese)
[6] 张静, 倪金, 马诗敏, 等. 基于GIS的大连市金普新区洪水淹没分析[J]. 地质与资源, 2021, 30(5): 590-594. doi: 10.13686/j.cnki.dzyzy.2021.05.010
Zhang J, Ni J, Ma S M, et al. GIS-based analysis of flood submergence in Jinpu New District, Dalian City[J]. Geology and Resources, 2021, 30(5): 590-594. doi: 10.13686/j.cnki.dzyzy.2021.05.010
[7] 姜蓝齐, 马艳敏, 张丽娟, 等. 基于GIS的黑龙江省洪涝灾害风险评估与区划[J]. 自然灾害学报, 2013, 22(5): 238-246.
Jiang L Q, Ma Y M, Zhang L J, et al. Assessment and zoning of flood disaster risk in Heilongjiang Province based on GIS[J]. Journal of Natural Disasters, 2013, 22(5): 238-246.
[8] 王国卫, 李明波, 蒋明光, 等. 基于加权信息量模型的湖南省麻阳县地质灾害危险性评价与区划[J]. 地质与资源, 2020, 29(3): 266-272. doi: 10.3969/j.issn.1671-1947.2020.03.009
Wang G W, Li M B, Jiang M G, et al. Risk assessment and zoning of the geological hazards in Mayang County of Hunan Province based on weighted information model[J]. Geology and Resources, 2020, 29(3): 266-272. doi: 10.3969/j.issn.1671-1947.2020.03.009
[9] 赵雪莲, 陈华丽. 基于GIS的洪灾遥感监测与损失风险评价系统[J]. 地质与资源, 2003, 12(1): 54-60. doi: 10.3969/j.issn.1671-1947.2003.01.009
Zhao X L, Chen H L. The GIS-based RS monitoring and risk evaluating system for flood hazard[J]. Geology and Resources, 2003, 12(1): 54-60. doi: 10.3969/j.issn.1671-1947.2003.01.009
[10] 郭利华, 龙毅. 基于DEM的洪水淹没分析[J]. 测绘通报, 2002(11): 25-27, 30.
Guo L H, Long Y. Analysis of flood submerging based on DEM[J]. Bulletin of Surveying and Mapping, 2002(11): 25-27, 30.
[11] 金哲, 肖旎旎. 基于GIS的洪水淹没区分析[J]. 吉林水利, 2014(6): 30-32, 37.
Jin Z, Xiao N N. Analysis of the area of flood based on GIS[J]. Jilin Water Resources, 2014(6): 30-32, 37.
[12] 李谢辉, 王磊, 李景宜. 基于GIS的渭河下游河流沿线区域生态风险评价[J]. 生态学报, 2009, 29(10): 5523-5534.
Li X H, Wang L, Li J Y. Regional ecological risk assessment in catchment area along the Weihe River based on GIS[J]. Acta Ecologica Sinica, 2009, 29(10): 5523-5534.
[13] 李军. 石家庄市某片区暴雨强度及雨型分析[J]. 地下水, 2023, 45(1): 211-213, 265.
Li J. Analysis of rainstorm intensity and rain pattern in a district of Shijiazhuang City[J]. Ground Water, 2023, 45(1): 211-213, 265. (in Chinese)
[14] 张行南, 罗健, 陈雷, 等. 中国洪水灾害危险程度区划[J]. 水利学报, 2000(3): 1-7.
Zhang X N, Luo J, Chen L, et al. Zoning of Chinese flood hazard risk[J]. Journal of Hydraulic Engineering, 2000(3): 1-7.
[15] 刘建芬, 张行南, 唐增文, 等. 中国洪水灾害危险程度空间分布研究[J]. 河海大学学报(自然科学版), 2004, 32(6): 614-617.
Liu J F, Zhang X N, Tang Z W, et al. Spatial distribution of flood hazards in China[J]. Journal of Hohai University (Natural Sciences), 2004, 32(6): 614-617.
[16] 吴红, 邵亮, 陆登荣. 兰州市区地质灾害与暴雨强度[J]. 干旱气象, 2005, 23(1): 63-67.
Wu H, Shao L, Lu D R. The geological calamity and the rainstorm intensity in Lanzhou City[J]. Journal of Arid Meteorology, 2005, 23(1): 63-67.
[17] 宋怡轩, 何永青, 陈晋. 基于GIS的四川省暴雨洪涝灾害风险评估[J]. 绿色科技, 2022, 24(18): 33-37.
Song Y X, He Y Q, Chen J. Risk assessment of refined rainstorm and flood disaster in Sichuan Province based on GIS[J]. Journal of Green Science and Technology, 2022, 24(18): 33-37.
[18] 车璐阳, 史维良. 陕西省暴雨洪涝灾害防灾减灾能力的评估[J]. 农业灾害研究, 2022, 12(12): 144-147.
Che L Y, Shi W L. Evaluation on disaster prevention and mitigation ability of rainstorm and flood disaster in Shaanxi Province[J]. Journal of Agricultural Catastrophology, 2022, 12(12): 144-147.
[19] 麻荣永, 易云梅, 李茳. 基于GIS的广西桂林市城区洪水灾害风险评价[J]. 红水河, 2016, 35(5): 1-5.
Ma R Y, Yi Y M, Li J. GIS-based flood disaster risk assessment for Guilin City in Guangxi[J]. Hongshui River, 2016, 35(5): 1-5.
[20] 姜月华, 陈立德, 向芳, 等. 长江演化及其对洪涝灾害防治的启示[J]. 中国地质, 2023, 50(4): 975-1003.
Jiang Y H, Chen L D, Xiang F, et al. Evolution of the Yangtze River and its implications for prevention and control to flood disaster[J]. Geology in China, 2023, 50(4): 975-1003.
[21] 黄国如, 李碧琦. 基于模糊综合评价的深圳市暴雨洪涝风险评估[J]. 水资源与水工程学报, 2021, 32(1): 1-6.
Huang G R, Li B Q. Risk assessment of storm water fooding in Shenzhen City based on fuzzy comprehensive evaluation method[J]. Journal of Water Resources and Water Engineering, 2021, 32(1): 1-6.
-
图(8)
表(6)
计量
- 文章访问数: 49
- PDF下载数: 29
- 施引文献: 0