

Portable EDXRF Analysis of Eight Heavy Metals in Environmental Water Using Pre-concentration with Purolite S930 and Thin-layer Sample Technique
-
摘要:
使用便携式X射线荧光光谱法结合富集技术已能分析液体样品中近20种金属元素, 但检出限相对较高(0.1~100 μg/L)、富集操作繁多、一种富集法可测元素种类较少等因素制约了该技术的发展.本文研究了一种适应于现场测试环境水样的XRF分析方法.使用20 mg S-930螯合树脂对100 mL水体中8种重金属(V、Mn、Fe、Co、Ni、Cu、Zn和Pb)进行预富集, 控制溶液pH=4, 搅拌30 min, 经真空抽滤系统过滤制得均匀薄样, 再使用自制的双层膜包夹样品盒并利用小型台式波长色散XRF测定.结果表明, 8种元素标准曲线的相关性R2>0.997, 检测范围为10~1000 μg/L, 检出限为1.0~6.2 μg/L, 方法精密度(RSD, n=12) 小于5%, 加标回收率为80%~120%;标准水样和模拟水样的测定结果分别与标准值和理论值基本一致.本方法巧妙地使用双层聚丙烯膜包夹薄试样的制样方法, 较好解决了薄膜样品的污染等问题, 简化了水样的预富集操作, 制备的树脂薄样可直接供XRF测量.方法检出限较低, 稳定性较好, 适用于检测Ⅰ~Ⅴ类水体中Fe、Co、Ni和Cu, Ⅱ~Ⅴ类水体中V和Zn, Ⅲ~Ⅴ类水体中Mn和Pb, 基本具备对8种重金属污染水体进行环境监测、水质调查等现场分析的能力.
Abstract:Analysis of environmental water samples is primarily conducted in the laboratory, which costs considerable time and money. Pre-concentration methods coupled with portable X-ray Fluorescence (XRF) have been developed for the determination of almost twenty kinds of heavy metals, but with a relatively high detection limit, complex operation, and less element types can be measured using one pre-concentration strategy. All of these problems restrict the development of the technique. To solve these issues an on-site-oriented rapid and convenient analysis method of heavy metal ions in aqueous solutions has been developed utilizing a bench-top type portable Energy-Dispersive X-ray Fluorescence (EDXRF). Based on pre-concentration with purolite S930 chelating resin and thin-layer sample preparation technique, the method could determine trace V5+, Mn2+, Fe3+, Co2+, Ni2+, Cu2+, Zn2+ and Pb2+ in environmental water samples. After the heavy metal ions have been absorbed by 20 mg of S-930 resin powder for about 30 min in the pH=4 solution, the resin powders are filtrated onto a 0.45 m filter to form a thin-layer sample which can be directly measured by EDXRF using a homemade double polypropylene film sample cup. With an amount of 100 mL of solution, the linear ranges were 10-1000 g/L and the correlation coefficients of the calibration curves were good (R2>0.997) for all the eight elements. The lower limit of detection was between 1.0 and 6.2 g/L. Precision tests carried out on multi-element mixed solutions showed that the relative standard deviations (RSD, n=12) were better than 5% except for those of Zn and Pb at the concentration level of 20 g/L. Most of the recoveries were 80%-120% with spikes of 20 g/L for each element. The analysis results of DW standard substances and simulation samples were consistent with reference values and the theoretical value respectively. This method skillfully uses a double polypropylene membrane preparation method to make a thin-layer film sample which solves the pollution problem and simplifies the pre-concentration steps. The resin film samples can be directly measured by XRF. A lower detection limit and better stability make the method suitable for a spot investigation, water quality monitoring, and assessment of Fe, Co, Ni, Cu, V, Zn, Mn and Pb in heavy metal polluted environmental water.
-

-
表 1 多元素混合标准储备液浓度
Table 1. Concentration of the multielement calibration standard solutions
元素 浓度(μg/L) Std-1 Std-2 Std-3 Std-4 Std-5 Std-6 Std-7 Std-8 Std-9 Std-10 Std-11 Std-12 V 25 10 5 1000 750 500* 250 100 75 50 50* 500 Mn 500 250 100 75 50* 25 1500 1250 1000 750 50 500* Fe 1000 750 500 250 100 75 50 25 2000 1500 50* 1200 Co 600 400 200 100 50 25 5 1250 1000 800 50* 500* Ni 5 1000 750 500 250 100 75 50 25 10 50* 500* Cu 1500 1250 1000 750 500 250 100 50 25 5 50* 1100 Zn 50* 25 5000 2500 1500 1000 750 500 250 100 50 2000 Pb 20 10 5 2 600 150 100 50 200 400 300 500 ∑i 4525 4245 7835 5287 3880 3175 3605 3785 4830 4715 650 6800 注:“*”为标准曲线中未使用的浓度值。  下载: 导出CSV
表 2 EDXRF仪器分析条件
Table 2. Working conditions of the EDXRF instrument
元素 分析线 能量范围
(keV)电压
(kV)电流
(μA)测量时间
(s)X射
线管过滤片 V Kα 4.854~5.054 30 260 400 Rh靶 Al Mn Kα 5.796~6.008 30 260 400 Rh靶 Al Fe Kα 6.302~6.526 30 260 400 Rh靶 Al Co Kα 6.832~7.044 30 260 400 Rh靶 Al Ni Kα 7.374~7.609 30 260 400 Rh靶 Al Cu Kα 7.939~8.163 30 260 400 Rh靶 Al Zn Kα 8.539~8.751 30 260 400 Rh靶 Al Pb Lβ 12.529~12.719 30 260 400 Rh靶 Al
下载: 导出CSV
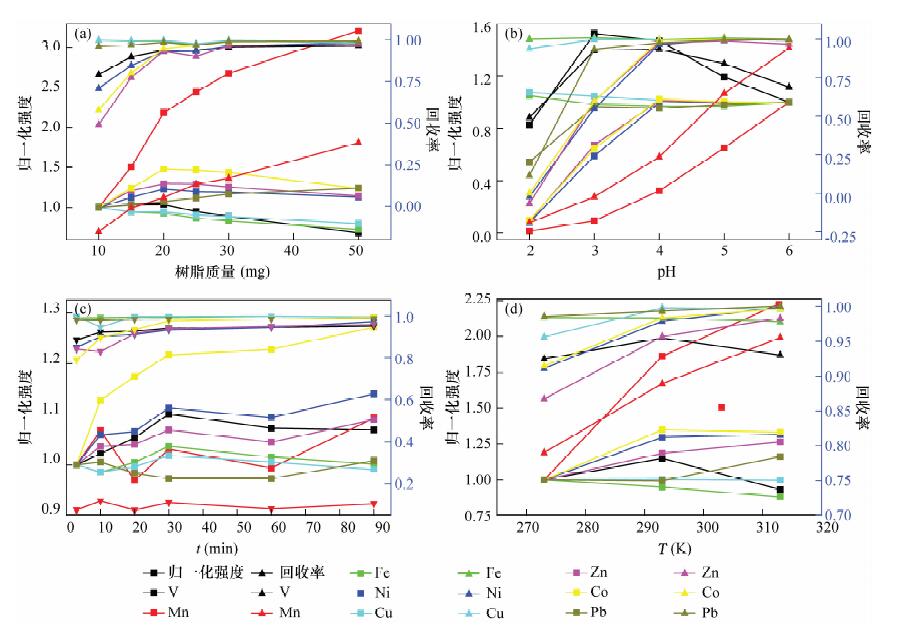
表 3 富集条件的选择
Table 3. Optimized properties of pre-concentration condition
组号 树脂用量
(mg)pH 时间
(min)温度
(K)1 10 4 30 293 15 4 30 293 20 4 30 293 25 4 30 293 30 4 30 293 50 4 30 293 2 20 2 30 293 20 3 30 293 20 4 30 293 20 5 30 293 20 6 30 293 3 20 4 3 293 20 4 10 293 20 4 20 293 20 4 30 293 20 4 60 293 20 4 90 293 4 20 4 30 273 20 4 30 293 20 4 30 313
下载: 导出CSV
表 4 方法精密度
Table 4. Precision tests of the method
元素 样品一 样品二 样品三 样品四 样品五 平均值
(μg/L)理论值
(μg/L)RSD(%)
n=10平均值
(μg/L)理论值
(μg/L)RSD(%)
n=12平均值
(μg/L)理论值
(μg/L)RSD(%)
n=10平均值
(μg/L)理论值
(μg/L)RSD(%)
n=12平均值
(μg/L)理论值
(μg/L)RSD(%)
n=10V 17.3 20 13.9 51 50 3.5 210 200 5.6 473 500 1.6 729 800 1.4 Mn 17.4 20 10.2 49.5 50 6.6 187 200 4.5 491 500 6.3 968 1100 3.4 Fe 29.6 20 17.5 52 50 14.6 213 200 5.8 504 500 2.0 1214 1200 1.4 Co 18.6 20 3.8 53.5 50 3.0 200 200 2.9 508 500 1.3 843 900 1.7 Ni 18.4 20 5.8 55.8 50 2.8 209 200 3.0 513 500 1.8 770 800 0.8 Cu 20.3 20 16.1 50.7 50 8.9 202 200 3.3 499 500 1.5 1068 1100 1.1 Zn 26.1 20 50.0 68.8 50 21.9 194 200 4.4 554 500 4.0 2019 2000 1.0 Pb 8.9 20* 61.6 57.9 50 7.8 200 200 3.4 512 500 1.5 300 300 1.1 注:标注“*”的数据由国家地质实验测试中心采用ICP-MS测定获得。
下载: 导出CSV
表 5 标准物质DW-1~DW-4分析
Table 5. Analytical results of reference standard materials DW-1-DW-4
元素 DW-1 DW-2 DW-3 DW-4 测量值
(μg/L)标准值
(μg/L)测量值
(μg/L)标准值
(μg/L)测量值
(μg/L)标准值
(μg/L)测量值
(μg/L)标准值
(μg/L)V 1.2±2.9 3.3 * 0.8±1.1 3.5 * 0.8±0.6 3.6 * 7.4±1.3 13.0 Mn 9.1±4.6 6.9 33.6±15.6 33.3 118.7±73.4 160.0 69.3±60.0 135.0 Fe 89.3±24.4 100.0 218.3±30.8 220.0 350.3±33.2 340.0 542.0±50.6 540.0 Co 0.9±2.8 0.98 * 0.7±0.8 0.63 * 0.9±0.8 0.85 * 3.3±3.1 3.8 * Ni 15.8±3.0 15.5 34.4±3.4 29.5 41.4±7.3 41.6 69.2±6.5 75.8 Cu 13.6±4.2 14.8 53.1±3.6 53.2 61.1±10.4 61.0 90.3±10.0 91.5 Zn 26.0±9.5 20.2 37.2±23.4 31.2 54±22.8 50.7 165.4±21.0 167.0 Pb 3.5±9.2 3.3 3.9±6.8 7.0 21.0±1.1 21.7 34.0±10.0 30.2 注:因DW系列标准物质中未定值,标注“*”的数据由国家地质实验测试中心采用ICP-MS测定获得。表中的测量值=平均值±2倍标准偏差。
下载: 导出CSV
表 6 模拟水样的分析结果
Table 6. Analytical results of simulated water samples
元素 模拟Ⅰ类水体 模拟Ⅲ类水体 测量值1
(μg/L)测量值2
(μg/L)平均值
(μg/L)理论值
(μg/L)相对误差
(%)测量值1
(μg/L)测量值2
(μg/L)平均值
(μg/L)理论值
(μg/L)相对误差
(%)V 10.0 8.0 9.0 8 13.5 77.0 73.0 75.0 90 -16.7 Mn 74.0 77.0 75.5 45(54.2) 67.8 77.0 73.0 75.0 90 -16.7 Fe 91.0 89.0 90.0 90 0.0 259.0 245.0 252.0 250 0.8 Co 8.7 5.7 7.2 5(8.5) 44.0 47.7 45.7 46.7 45 3.8 Ni 6.0 5.0 5.5 5 10.0 45.0 44.0 44.5 45 -1.1 Cu 9.5 8.5 9.0 8 13.5 529.5 514.5 522.0 500 4.4 Zn 123.0 92.0 107.5 60 79.2 1545 1485 1515 1200 26.3 Pb 11.0 10.0 10.5 8(18) 31.3 66.0 67.0 66.5 50 33.0 元素 模拟Ⅴ类水体 稀释一倍后的模拟Ⅴ类水体 测量值1
(μg/L)测量值2
(μg/L)平均值
(μg/L)理论值
(μg/L)相对误差
(%)测量值1
(μg/L)测量值2
(μg/L)平均值
(μg/L)理论值
(μg/L)相对误差
(%)V 786.0 769.0 777.5 900 -13.6 418.0 414.0 416.0 450 -7.6 Mn 384.0 473.0 428.5 1200 -64.3 436.0 508.0 472.0 600 -21.3 Fe 1839 1842 1841 1800 3.3 935.0 935.0 935.0 900 3.9 Co 936.7 980.7 958.7 1100 -12.8 590.7 610.7 600.7 600 0.1 Ni 266.0 270.0 268.0 300 -10.7 145.0 149.0 147.0 150 -2.0 Cu 1214 1226 1220 1200 1.7 619.5 623.5 621.0 600 3.5 Zn 3766 4025 3896 3700 5.3 2256 2324 2290 1850 23.8 Pb 126.0 127.0 126.5 100 26.5 71.0 67.0 69.0 50 38.0 注:括号内的数据由国家地质实验测试中心ICP-MS测定获得。
下载: 导出CSV
-
[1] [2] [3] [4] doi: 10.1039/C4JA90038C
[5] doi: 10.1039/c3ja90046k
[6] [7] [8] [9] [10] [11] [12] doi: 10.1039/c2ja30179b
[13] [14] [15] [16] [17] [18] doi: 10.1039/c3an36477a
[19] [20] [21] doi: 10.1039/c2ja10313c
[22] [23] [24] [25] [26] [27] [28] doi: 10.1002/xrs.v39:3
[29] [30] [31] [32] [33] [34] [35] [36] -
图(3)
表(7)
计量
- 文章访问数: 1126
- PDF下载数: 70
- 施引文献: 0