Origin of Heavy Metals in Total Suspended Particle and Their Influence on Soil Environmental Quality in an Industrial Area of South China
-
摘要:
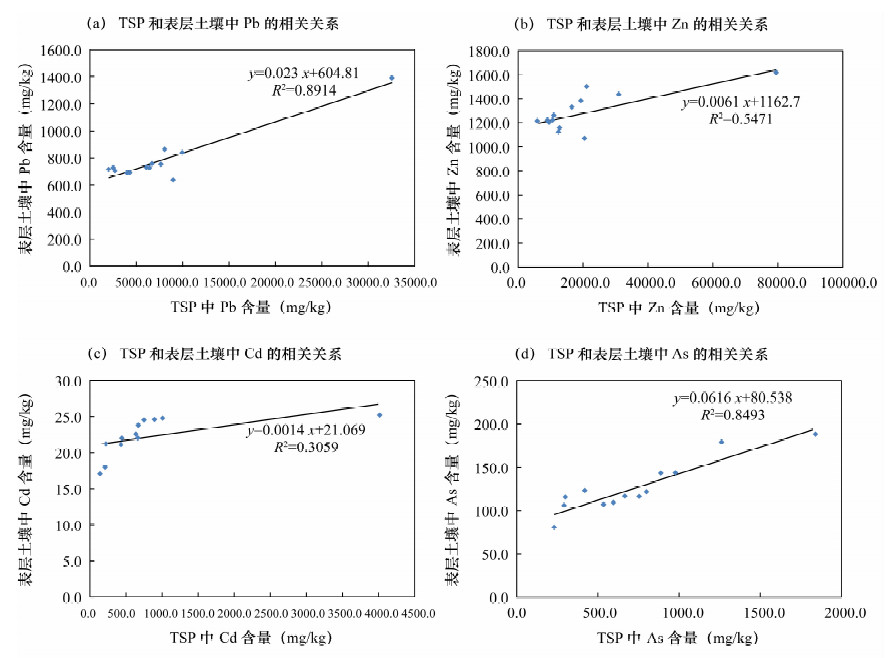
解析大气总悬浮颗粒物(TSP)的重金属来源可为重金属生态风险评价和环境修复提供理论依据。本文研究了中国南方某工业城市冶炼厂周边冬季TSP和表层土壤(0~20 cm)中的重金属环境效应。采用大气主动采样技术收集TSP样品, 原子荧光光谱法和电感耦合等离子体质谱法测定其中重金属的含量, 结合富集因子法和Pearson系数法分析重金属含量特征及其来源。结果表明, 研究区TSP中Zn、Pb、Cd含量最高达到30809.06×10-6、9902.91×10-6、1011.21×10-6, 分别是中国土壤背景值的201.43、222.53、5616.20倍, 属于污染严重级别; Ni、Cr含量分别是中国土壤背景值的1.83倍和2.96倍。冶炼厂、火力发电厂和化工厂等人为源是Zn、Pb、Cd、Hg、As等重金属富集的主导因素; 土壤重金属含量与TSP重金属含量呈显著正相关, 可判定研究区土壤的重金属来源主要为大气沉降。
Abstract:Determination of heavy metals in atmospheric total suspended particulate matter(TSP) can provide the theoretical basis for the ecological risk assessment of heavy metals and environmental remediation work.The environmental effects of heavy metals in atmospheric TSP and surface soil(0-20 cm) were studied in an industrial city of southern China.TSP samples were collected by atmospheric active sampling technique.The content of heavy metals in TSP was determined by Atomic Fluorescence Spectrometry and Inductively Coupled Plasma-Mass Spectrometry.The characteristics and sources of heavy metals were analyzed by enrichment factor and Pearson coefficient method.The results show that the highest content of Zn, Pb and Cd in the study area is 30809.06×10-6, 9902.91×10-6, and 1011.21×10-6, respectively, which are 201.43, 222.53, 5616.20 times higher than the soil background values in China, and thus the pollution is serious.Cr and Ni contents were 1.83 and 2.96 times higher than the soil background values in China.Zn, Pb, Cd, Hg, As are enriched mainly from smelting, thermal power, and chemical plants as well as other artificial sources.The content of heavy metals in the soil of the study area shows a significantly positive correlation with the content of heavy metals in TSP, and thus the main source of heavy metals in the soil originates from atmospheric deposition.
-
Key words:
- industrial area /
- total suspend particle /
- heavy metals /
- enrichment factor /
- soil quality
-

-
表 1 大气TSP中重金属含量统计
Table 1. Heavy metal concentrations in atmosphere TSP sample
元素 含量(mg/kg) 方差 偏度 极小值 极大值 平均值 中值 标准差 As 234.04 1266.82 645.54 631.17 311.57 97077.87 0.47 Hg 3.16 15.70 9.84 8.84 3.67 13.49 (0.05) Cr 131.66 249.19 180.43 168.60 41.23 1699.80 0.66 Ni 28.19 62.13 49.15 50.88 11.83 139.85 (0.71) Cu 207.09 4025.70 955.48 304.35 1204.47 1450745.25 1.90 Zn 6099.29 30809.06 14945.79 12473.48 6914.79 47814292.50 1.08 Mo 92.08 221.28 160.71 164.45 45.37 2058.67 (0.06) Pb 1971.63 9902.91 5785.88 6268.81 2641.97 6979993.51 (0.04) Cd 146.45 1011.21 561.62 644.46 273.37 74729.36 (0.10) 注:方差(σ)的计算公式为:  。偏度(Skewness)的计算公式为:
表 2 研究区TSP的重金属含量与土壤背景值的比较
Table 2. Comparison between concentration of heavy metals in TSP with background values
元素 含量(mg/kg) 研究区与中国土壤背景值的倍数 研究区与本省土壤背景值的倍数 平均值 中国土壤背景值 省土壤背景值 As 645.54 11.20 13.60 57.64 47.47 Hg 9.84 0.06 0.096 164.00 102.50 Cr 180.43 61.00 64.90 2.96 2.78 Ni 49.15 26.90 29.40 1.83 1.67 Cu 955.48 22.60 25.40 42.28 37.62 Zn 14945.79 74.20 88.60 201.43 168.69 Pb 5785.88 26.00 27.30 222.53 211.94 Cd 561.62 0.10 0.08 5616.20 7109.11 表 3 重金属元素的Pearson相关系数
Table 3. Correlation matrix for the concentration of heavy metals
元素 As Se Hg Cr Ni Cu Zn Mo Pb Cd As 1.000 Se 0.742** 1.000 Hg 0.886** 0.942** 1.000 Cr 0.745** 0.981** 0.953** 1.000 Ni 0.628* 0.970** 0.899** 0.980** 1.000 Cu 0.617* 0.791** 0.750** 0.823** 0.785** 1.000 Zn 0.846** 0.939** 0.968** 0.954** 0.903** 0.822** 1.000 Mo 0.623* 0.973** 0.895** 0.977** 0.987** 0.771** 0.888** 1.000 Pb 0.848** 0.949** 0.977** 0.962** 0.919** 0.820** 0.986** 0.912** 1.000 Cd 0.843** 0.947** 0.976** 0.970** 0.926** 0.835** 0.975** 0.920** 0.995** 1.000 注:表格中的“**”表示显著性水平0.01。 -
[1] [2] [3] [4] [5] [6] [7] [8] [9] [10] [11] [12] [13] [14] [15] [16] [17] [18] doi: 10.11821/xb200801001
[19] [20] [21] [22] [23] [24] [25] [26] [27] [28] [29] [30] doi: 10.1289/ehp.11641
[31] doi: 10.1289/ehp.11608
-


 下载:
下载:

