

COASTLINE CRITERIA FOR LAND AREA OF THE HUANGHE RIVER DELTA AND THEIR SIGNIFICANCE
-
摘要:
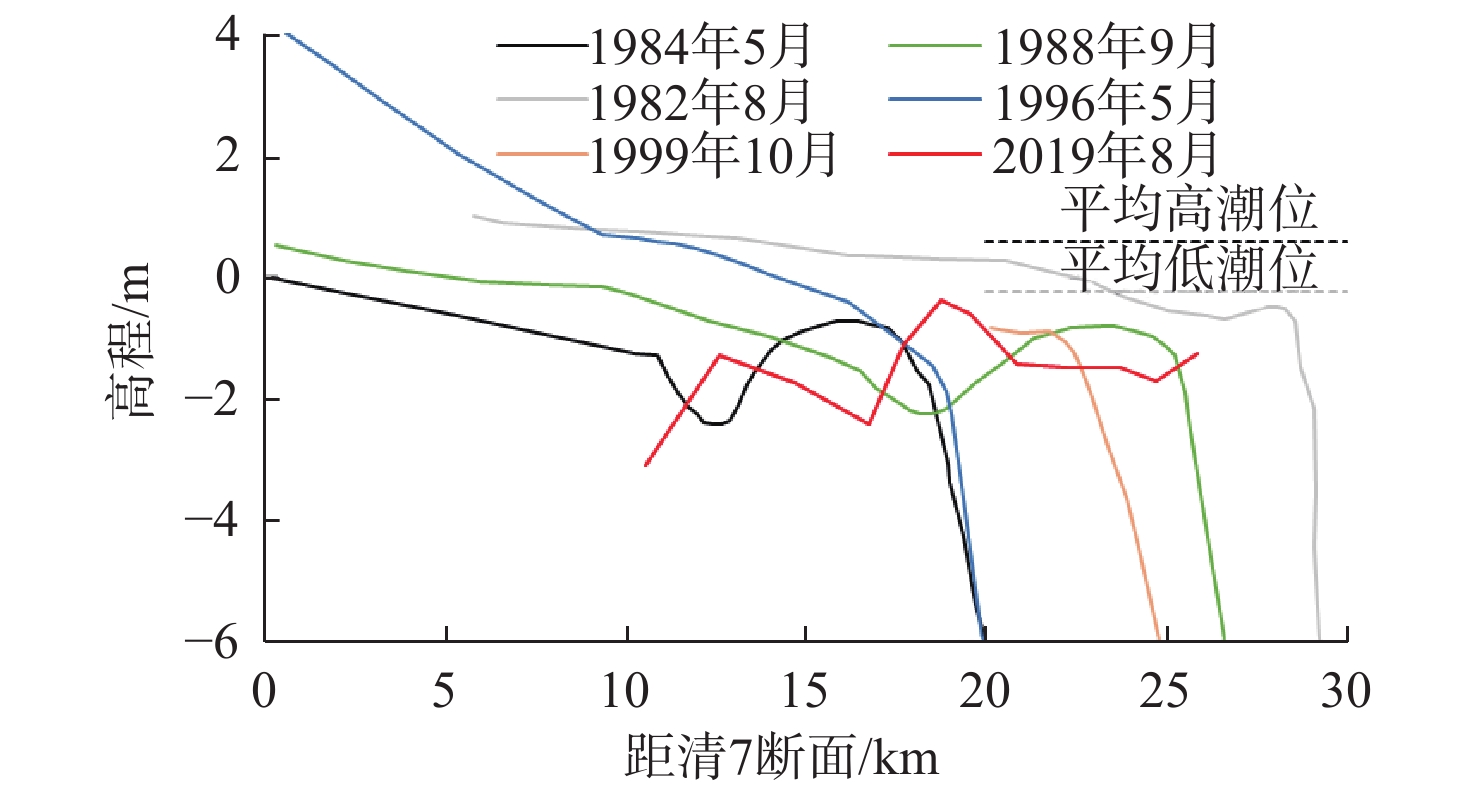
黄河三角洲陆地面积变化关系到河口综合治理、国土规划、自然保护区发展以及油气资源的勘探开发等战略布局。已有研究采用的海岸线标准主要有:根据实测资料确定的高潮线、低潮线、黄海0 m线和黄海−2 m线以及从卫星遥感影像提取的高潮线、低潮线和瞬时水边线。近代黄河三角洲、现代黄河三角洲、清水沟流路范围、清8汊河范围内采用不同的海岸线标准得到的亿吨来沙造陆面积(造陆效率)成果存在较大差别。采用影像特征海岸线得到的部分时段造陆效率偏差较大,其原因主要与黄河三角洲沿岸发育的坡度平缓的广阔潮滩有关。从黄河三角洲海岸演变特征出发,采用黄海−2 m线作为海岸线基本上包含了径流与海洋动力作用最强烈区域,适宜于研究海岸淤进和蚀退,以及由此产生的对流路出汊、摆动和黄河下游的反馈影响。已有动态平衡沙量研究因采用海岸线标准不一致存在较大差别,而且三角洲长时期以淤进为主,蚀退时段的样本较少。在目前行河流路处于长期相对稳定的局面下,研究清水沟流路范围内海岸动态稳定的沙量更有实践意义。
Abstract:The land area of the Huanghe River Delta is significant to the integrated estuary administration and management, national land planning, conservation and development of natural reserves and oil-gas exploitation and development. The adopted criteria for the time being include high tide line, low tide line, 0 m line upon the Huanghai datum and −2 m line upon the Huanghai datum from measured data, and high tide line, low tide line, water body line from Remote sensing satellite images. There are large differences in the figures of land increment per 1×10⁸ t sediment or so-called “land increment efficiency” among the data from the Lijin Station, the modern delta, the Qingshuigou course, and the Qing 8 course. The coastline from satellite images have big differences in some periods, due to the broad tidal flat with gentle slope. It is suggested that the −2 m line on the Huanghai datum is proper for studies of coastal progradation and retrogradation, water course avulsion and migration, and influences on lower reaches of the River. The main problem of the existing studies on the sediment for coastline dynamic balance is that data are not sufficient from recession periods. In order to maintain long term stabilization of current course, more work is required to study the sediment budget and coastal dynamic balance along the Qingshuigou course.
-
Key words:
- Huanghe River Delta /
- land area /
- coastline /
- land increment efficiency /
- sediment budget
-

-
表 1 近代黄河三角洲陆地面积变化
Table 1. Land area change of the modern Yellow River Delta
序号 统计阶段 海岸线标准 面积变化/km2 研究时段 造陆效率/(km2·亿t−1) 资料来源 1 1855—1954 高潮线(地貌) 1 400 1855—1954 / 文献[4] 2 1855—1954 高潮线(地貌) 1 510 1855—1954 / 文献[5] 3 1855—1954 高潮线(史料) 2 045 1855—1954 / 文献[6] 4 1954—1976 高潮线(实测) 578 1954—1976 2.28 文献[4] 5 1954—1976 高潮线(实测) 548.3 1954—1976 2.16 文献[5] 6 1954—1976 高潮线(实测和影像) 795 1955—1975 3.66 文献[6] 7 1954—1976 高潮线(实测) 588.0 1953/07—1976/05 2.33 文献[7] 8 1976—1996 高潮线(实测) 364.4 1976—1992 3.54 文献[5] 9 1976—1996 高潮线(实测) 557.0 1976/06—1996/06 4.22 文献[7] 10 1976—1996 高潮线(实测) 293 1976/05—1992/10 2.64 文献[9] 11 1976—1996 瞬时水边线(影像) 192.5 1987/09—1996/09 4.11 文献[27] 12 1976—1996 瞬时水边线(影像) 272.6 1983/07—1996/07 3.77 文献[29] 13 1976—1996 平均低潮线(影像) −133.8 1976/12—1996/09 −1.09 文献[22] 14 1976—1996 黄海−2 m线 234.5 1976—1992 2.28 文献[5] 15 1996—2002 高潮线(实测) 22.4 1996/06—1998/10 2.72 文献[7] 16 1996—2002 瞬时水边线(影像) 77.9 1996/09—2000/05 11.21 文献[27] 17 1996—2002 瞬时水边线(影像) −114.3 1996/07—2003/08 −10.27 文献[29] 18 1996—2002 平均低潮线(影像) −9.8 1996/09—2002/09 −1.25 文献[22] 19 2002—2018 瞬时水边线(影像) 84.2 2002/09—2011/06 5.92 文献[29] 20 2002—2018 平均低潮线(影像) 14.1 2002/09—2008/10 1.18 文献[22]  下载: 导出CSV
表 2 现代黄河三角洲陆地面积变化
Table 2. Land area change of the modern Yellow River Delta
序号 统计阶段 海岸线标准 面积变化/km2 研究时段 造陆效率/(km2·亿t−1) 资料来源 1 1976—1996 高潮线(影像) 23.79 1989/02—1992/08 1.81 文献[13] 2 1976—1996 高潮线(影像) 231.5 1976/12—1984/10 3.56 文献[14] 3 1976—1996 瞬时水边线(影像) 174.5 1976/06—1981/09 4.02 文献[26] 4 1976—1996 瞬时水边线(影像) 122.4 1987/05—1996/05 2.78 文献[26] 5 1996—2002 瞬时水边线(影像) 27.2 1996/05—1998/05 5.96 文献[26] 6 2002—2018 高潮线(影像) 1.4 2004/09—2009/06 0.23 文献[13]
下载: 导出CSV
表 3 清水沟流路范围内陆地面积变化
Table 3. Land area change along Qingshuigou channel
序号 统计阶段 海岸线标准 面积变化/km2 研究时段 造陆效率/(km2·亿t−1) 资料来源 1 1976—1985 高潮线(实测) 436.1 1976/06—1986/06 5.28 文献[7] 2 1976—1985 高潮线(实测) 179 1976/05—1980/08 4.87 文献[9] 3 1976—1985 高潮线(影像) 213 1977/05—1985/03 3.20 文献[15] 4 1976—1985 高潮线(影像) 187.0 1976/06—1985/03 2.49 文献[16] 5 1976—1985 高潮线(影像) 214.4 1976/12—1983/10 4.07 文献[17] 6 1976—1985 高潮线—影像 309.3 1976/12—1984/10 4.75 文献[14] 7 1976—1985 瞬时水边线(影像) 15 1981—1984 0.60 文献[25] 8 1976—1985 瞬时水边线(影像) 353.0 1976—1985 4.77 文献[30] 9 1976—1985 平均潮位线(影像) 204.8 1977/05—1987/05 2.70 文献[31] 10 1976—1985 平均低潮线(影像) 142.3 1976/12—1987/09 1.87 文献[22] 11 1976—1985 黄海0 m 452 1976/06—1985/11 5.48 文献[35] 12 1976—1985 黄海−2 m 411.8 1976/06—1985/09 5.16 文献[36] 13 1976—1985 黄海−2 m 363.6 1976/10—1985/06 4.99 文献[37] 14 1985—1996 高潮线(实测) 180.5 1986/06—1996/06 3.96 文献[7] 15 1985—1996 高潮线(影像) 92 1985/03—1996/05 1.73 文献[15] 16 1985—1996 高潮线(影像) 105.6 1985/03—1996/05 1.98 文献[16] 17 1985—1996 高潮线(影像) 90.9 1983/10—1996/05 1.35 文献[17] 18 1985—1996 高潮线(影像) 17.7 1989/02—1992/08 1.35 文献[13] 19 1985—1996 瞬时水边线(影像) 260.3 1987/05—1996/05 5.92 文献[25] 20 1985—1996 瞬时水边线(影像) 121 1985—1995 2.63 文献[25] 21 1985—1996 瞬时水边线(影像) 68.7 1986/05—1996/10 1.38 文献[24] 22 1985—1996 瞬时水边线(影像) 135.9 1985—1996 2.70 文献[30] 23 1985—1996 平均潮位线(影像) 79.6 1987/05—1996/05 1.81 文献[31] 24 1985—1996 平均低潮线(影像) 108.5 1987/09—1996/09 2.32 文献[22] 25 1985—1996 黄海0 m 1 1985/11—1989/11 0.06 文献[35] 26 1985—1996 黄海−2 m 125.8 1985/06—1995/10 2.60 文献[37-38] 27 1996—2002 高潮线(实测) 38.21 1996/06—1998/10 4.64 文献[7] 28 1996—2002 瞬时水边线(影像) −32 1997—2002 −4.86 文献[30] 29 1996—2002 高潮线(影像) 19.2 1996/05—2000/05 1.88 文献[15] 30 1996—2002 高潮线(影像) −62.6 1996/05—2002/08 −5.63 文献[16] 31 1996—2002 高潮线(影像) 23.6 1996/05—2000/05 2.31 文献[17] 32 1996—2002 平均潮位线(影像) 6.8 1996/05—2002/04 0.64 文献[31] 33 2002—2018 高潮线(影像) 18.2 2002/08—2005/05 2.85 文献[16] 34 2002—2018 高潮线(影像) 10.3 2004/09—2009/06 1.69 文献[13] 35 2002—2018 瞬时水边线(影像) 76 2003—2013 4.84 文献[30] 36 2002—2018 平均潮位线(影像) 11.1 2002/04—2015/06 0.57 文献[31] 37 2002—2018 平均低潮线(影像) 31.5 2002/09—2008/10 2.63 文献[22]
下载: 导出CSV
表 4 清8汊河范围内陆地面积变化
Table 4. Land area change along Qing 8 channel
序号 统计阶段 海岸线标准 面积变化/km2 研究时段 造陆效率/(km2·亿t−1) 资料来源 1 1996—2002 高潮线(影像) 5.5 1996/05—2002/08 0.50 文献[16] 2 1996—2002 高潮线(影像) 11.9 1996/09—2000/05 1.71 文献[14] 3 1996—2002 低潮线(实测) 22.8 1996/06—2001/06 2.17 文献[21] 4 1996—2002 黄海−2 m 15.9 1996/05—2002/08 1.43 文献[39] 5 1996—2002 瞬时水边线(影像) 0.06 1996/09—2002/09 0.01 文献[28] 6 2002—2018 高潮线(影像) 3.0 2002/08—2005/05 0.47 文献[16] 7 2002—2018 高潮线(影像) 21.7 2002/05—2004/12 3.43 文献[19] 8 2002—2018 低潮线(实测) 36.2 2001/06—2007/07 3.39 文献[21] 9 2002—2018 瞬时水边线(影像) 31.8 2003/08—2011/09 2.17 文献[28]
下载: 导出CSV
-
[1] 庞家珍,司书亨. 黄河河口演变Ⅱ. 河口水文特征及泥沙淤积分布[J]. 海洋与湖沼,1980,11(4):296-305.
[2] 夏东兴,段焱,吴桑云. 现代海岸线划定方法研究[J]. 海洋学研究,2009,27(S):28-33.
[3] 于彩霞,许军,黄文骞,等. 海岸线及其测绘技术探讨[J]. 测绘工程,2015,24(7):1-5. doi: 10.3969/j.issn.1006-7949.2015.07.001
[4] 洪尚池,吴致尧. 黄河河口地区海岸线变迁情况分析[J]. 海洋工程,1984(2):68-74.
[5] 庞家珍,姜明星,李福林. 黄河口径流、泥沙、海岸线变化及其发展趋势[J]. 海洋湖沼通报,2000(4):1-6. doi: 10.3969/j.issn.1003-6482.2000.04.001
[6] 郭永盛. 近代黄河三角洲海岸的变迁[J]. 海洋科学,1980(1):30-34.
[7] 李希宁,刘曙光,李从先. 黄河三角洲冲淤平衡的来沙量临界值分析[J]. 人民黄河,2001,23(3):20-21. doi: 10.3969/j.issn.1000-1379.2001.03.011
[8] 彭俊,陈沈良,李谷祺,等. 黄河三角洲岸线及现行河口区水下地形演变[J]. 地理学报,2012,67(3):368-373. doi: 10.11821/xb201203008
[9] 姜明星,杨风栋,霍瑞敬,等. 黄河三角洲海岸及滨海区演变与河口流路、入海水沙的关系[J]. 海洋湖沼通报,2004(3):6-15. doi: 10.3969/j.issn.1003-6482.2004.03.002
[10] 濮静娟,王长耀. 利用卫星遥感资料研究河口三角洲、湖泊的动态[J]. 地理学报,1979,34(1):43-54. doi: 10.3321/j.issn:0375-5444.1979.01.005
[11] 席家治, 陆俭益, 丁六逸, 等. 黄河入海流路规划报告[R]. 郑州: 黄河水利委员会勘测规划设计院, 1989: 14.
[12] 吉祖稳,胡春宏,曾庆华,等. 运用遥感卫星照片分析黄河口近期演变[J]. 泥沙研究,1994(3):12-22.
[13] 栗云召,于君宝,韩广轩,等. 基于遥感的黄河三角洲海岸线变化研究[J]. 海洋科学,2012,36(4):99-106.
[14] CHU Z X,SUN X G,ZHAI S K,et al. Changing pattern of accretion/erosion of the modern Yellow River (Huanghe) subaerial delta,China:based on remote sensing images[J]. Marine Geology,2006,227:13-30.
[15] 常军,刘高焕,刘庆生. 黄河口海岸线演变时空特征及其与黄河来水来沙关系[J]. 地理研究,2004,23(5):339-346.
[16] CUI B L,LI X Y. Coastline change of the Yellow River Estuary and its response to the sediment and runoff (1976—2005)[J]. Geomorphology,2011,127:32-40.
[17] 薛允传,马圣媛,周成虎. 基于遥感和GIS 的现代黄河三角洲岸线变迁及发育演变研究[J]. 海洋科学,2009,33(5):36-40.
[18] WANG K F. Evolution of Yellow River Delta coastline based on remote sensing from 1976 to 2014,China[J]. Chinese Geographical Science,2019,29(2):181-191.
[19] 李云驹,刘学工,马浩录,等. 黄河口尾闾变化的遥感分析[J]. 人民黄河,2006,28(7):1-2. doi: 10.3969/j.issn.1000-1379.2006.07.001
[20] JIANG C,PAN S Q,CHEN S L. Recent morphological changes of the Yellow River (Huanghe) submerged delta:causes and environmental implications[J]. Geomorphology,2017,293:93-107.
[21] 陈俊卿,李小娟,杨金荣,等. 1996—2007年黄河新口门造陆分析[J]. 人民黄河,2009,31(3):38,102.
[22] 杨伟. 现代黄河三角洲海岸线变迁及滩涂演化[J]. 海洋地质前沿,2012,28(7):17-23.
[23] 黄海军,李成治,郭建军. 卫星影像在黄河三角洲岸线变化研究中的应用[J]. 海洋地质与第四纪地质,1994,14(2):29-37.
[24] 赵庚星,张万清,李玉环,等. GIS 支持下的黄河口近期淤、蚀动态研究[J]. 地理科学,1999,19(5):442-445. doi: 10.3969/j.issn.1000-0690.1999.05.011
[25] 何庆成,张波,李采. 基于RS、GIS 集成技术的黄河三角洲海岸线变迁研究[J]. 中国地质,2006,33(5):1118-1123. doi: 10.3969/j.issn.1000-3657.2006.05.022
[26] 董芳,赵庚星,田文新,等. 基于遥感和GIS的黄河三角洲淤蚀动态研究[J]. 西北农林科技大学学报(自然科学版),2003,31(1):53-56.
[27] 程义吉,张建怀,杨晓阳. 黄河三角洲海岸线的演变特征分析[J]. 人民黄河,2011,33(10):118-120. doi: 10.3969/j.issn.1000-1379.2011.10.044
[28] BI N S,WANG H J,YANG Z S. Recent changes in the erosion–accretion patterns of the active Huanghe (Yellow River) delta lobe caused by human activities[J]. Continental Shelf Research,2014,90:70-78.
[29] KONG D X,MIAO C Y,BORTHWICK A G L,et al. Evolution of the Yellow River Delta and its relationship with runoff and sediment load from 1983 to 2011[J]. Journal of Hydrology,2015,520:157-167.
[30] WU X,BI N S,XU J P,et al. Stepwise morphological evolution of the active Yellow River (Huanghe) Delta lobe (1976–2013):dominant roles of riverine discharge and sediment grain size[J]. Geomorphology,2017,292:115-127.
[31] 郭文. 基于遥感的黄河三角洲海岸带淤蚀变化及其水沙阈值研究[D]. 郑州: 华北水利水电大学, 2018: 40.
[32] 胡春宏,吉祖稳,王涛. 黄河口海洋动力特性与泥沙的输移扩散[J]. 泥沙研究,1996(4):1-10.
[33] 王恺忱. 黄河河口发展影响预估计算方法[J]. 泥沙研究,1988(3):40-50.
[34] 许炯心. 黄河三角洲造陆过程中的陆域水沙临界条件研究[J]. 地理研究,2002,21(2):163-170. doi: 10.3321/j.issn:1000-0585.2002.02.004
[35] 郭永盛,许学工,范兆木,等. 黄河口区域演变的预测研究[J]. 海洋学报,1992,14(3):95-104.
[36] 王恺忱. 黄河河口的演变与治理[J]. 郑州:黄河水利出版社,2010:156-158.
[37] 李福林,姜明星. 黄河清水沟流路河口三角洲增长面积预测[J]. 海洋湖沼通报,1999(3):16-22.
[38] 李福林,庞家珍,姜明星. 黄河三角洲海岸线变化及其环境地质效应[J]. 海洋地质与第四纪地质,2000,20(4):17-21.
[39] 程义吉,杨晓阳,孙效功. 黄河口清8 汊河海域冲淤变化分析[J]. 人民黄河,2004,26(11):17-18. doi: 10.3969/j.issn.1000-1379.2004.11.008
[40] 徐丛亮,陈沈良,陈俊卿. 新情势下黄河口出汊流路三角洲体系的演化模式[J]. 海岸工程,2018,37(4):35-43. doi: 10.3969/j.issn.1002-3682.2018.04.005
[41] 褚忠信,马向辉,张建启,等. 一般高潮线与2 m等深线反映黄河三角洲冲淤变化的对比[J]. 海洋地质与第四纪地质,2005,25(4):23-27.
[42] 李泽刚. 黄河口拦门沙的形成和演变[J]. 地理学报,1997,52(1):55-62.
[43] 陈沈良,张国安,陈小英,等. 黄河三角洲飞雁滩海岸的侵蚀及机理[J]. 海洋地质与第四纪地质,2005,25(3):9-14.
[44] WANG S J,HASSAN M A,XIE X P. Relationship between suspended sediment load,channel geometry and land area increment in the Yellow River Delta[J]. Catena,2006,65:302-314.
[45] 李福林,庞家珍,姜明星,等. 黄河清水沟流路水沙组合和河口三角洲发育的宏观特性[J]. 海洋学报,2001,23(1):52-59.
[46] 王开荣,茹玉英,陈孝田,等. 黄河河口三角洲岸线动态平衡问题的探讨[J]. 泥沙研究,2007(6):66-70. doi: 10.3321/j.issn:0468-155x.2007.06.011
[47] 张治昊,胡春宏. 黄河口水沙过程变异及其对河口海岸造陆的影响[J]. 水科学进展,2007,18(3):337-341.
[48] FAN Y S,CHEN S L,ZHAO B,et al. Shoreline dynamics of the active Yellow River delta since the implementation of Water-Sediment Regulation Scheme:a remotesensing and statistics-based approach[J]. Estuarine,Coastal and Shelf Science,2018,200:406-419.
-


图(4)
表(4)
计量
- 文章访问数: 1022
- PDF下载数: 126
- 施引文献: 0