Distribution, sources and environmental risk assessment on potential toxic elements in soils along coast of Sanmen Bay
-
摘要:
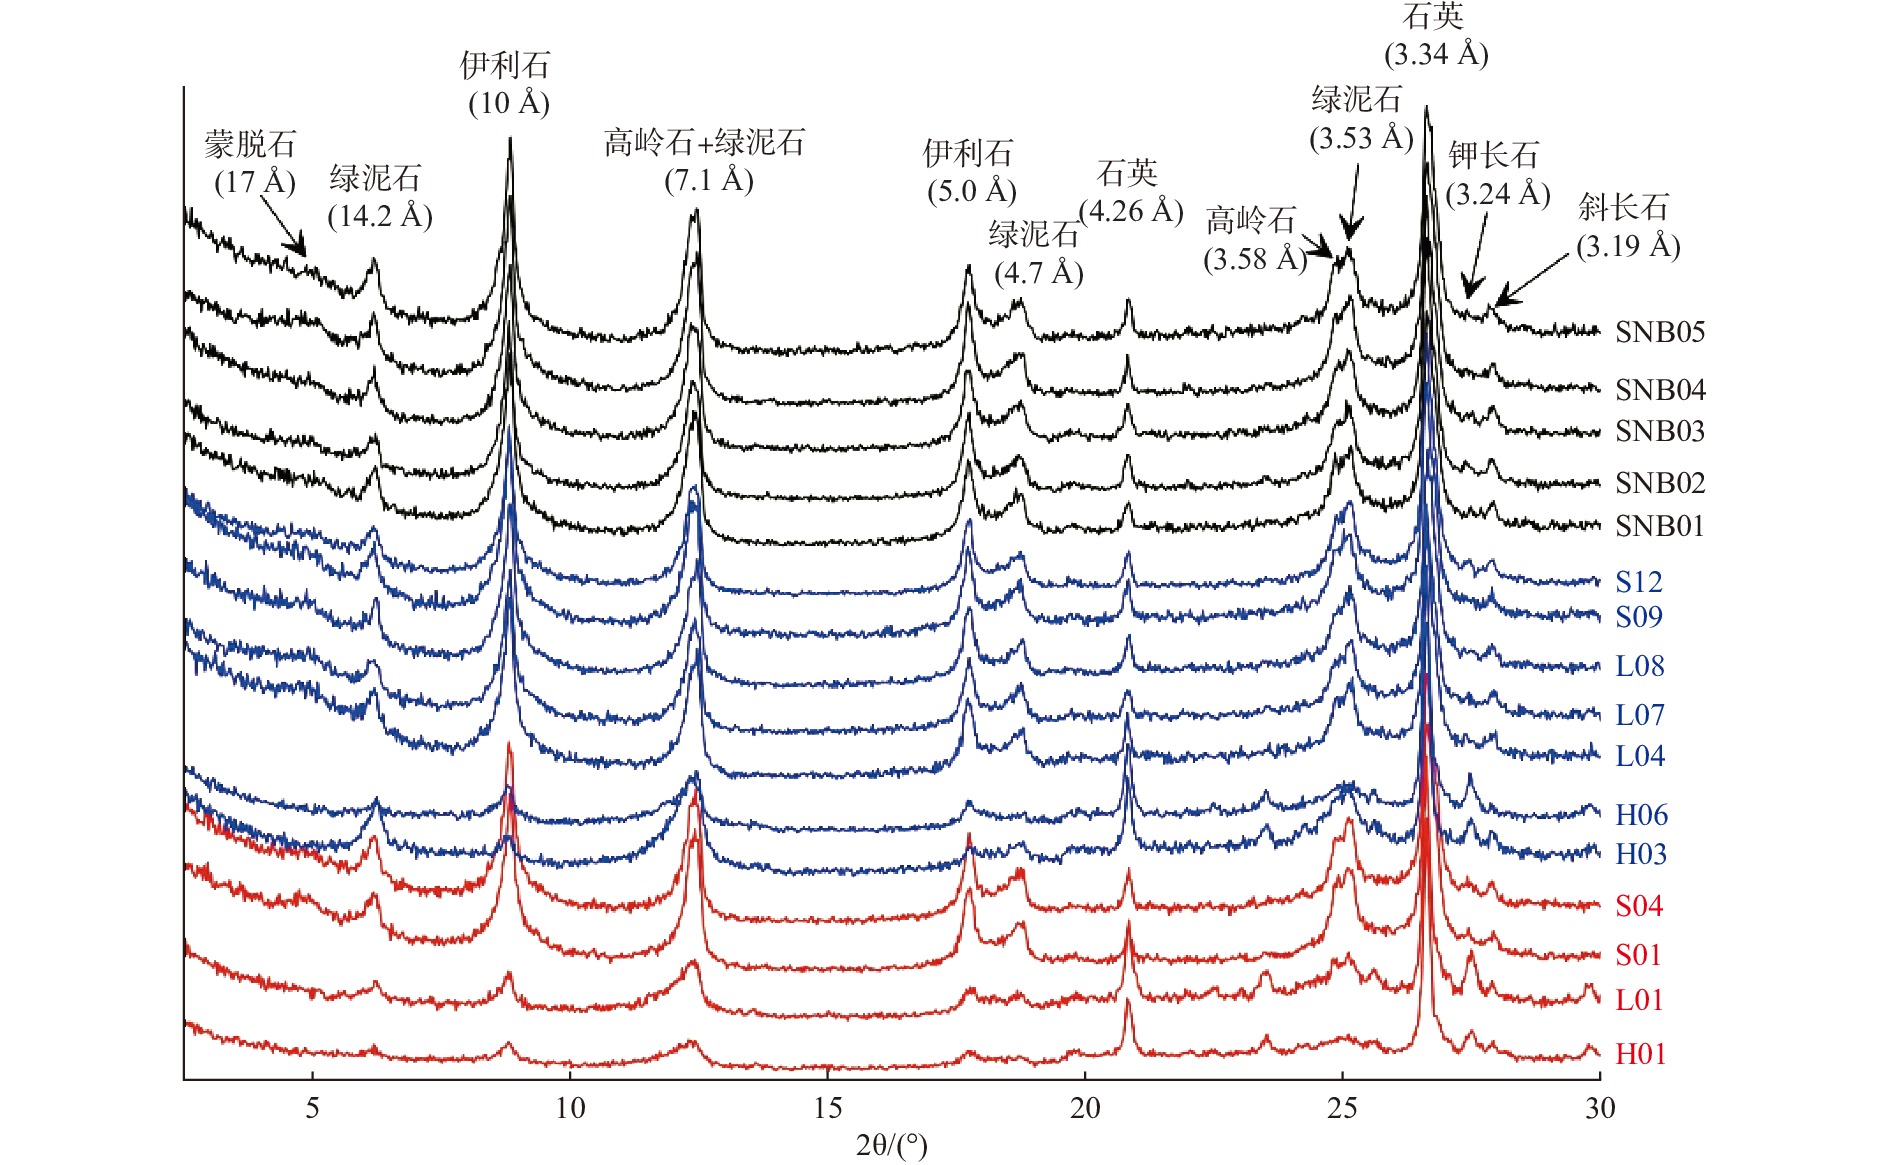
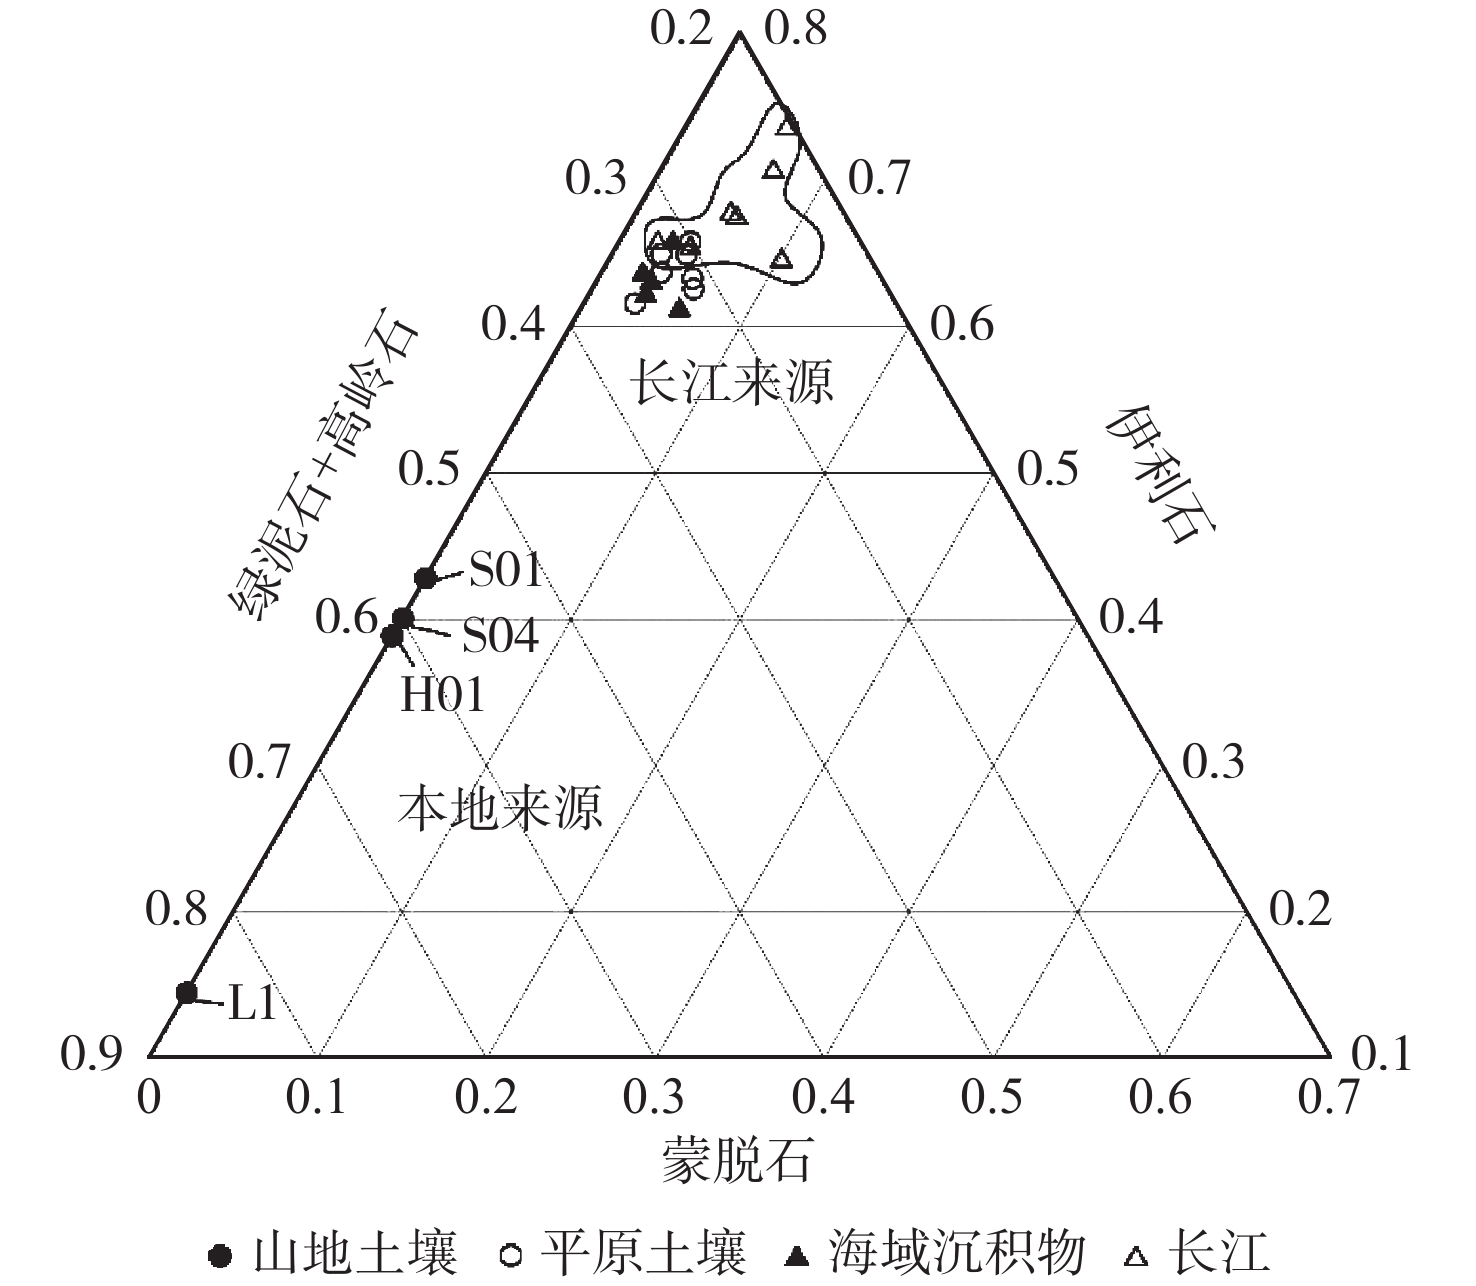
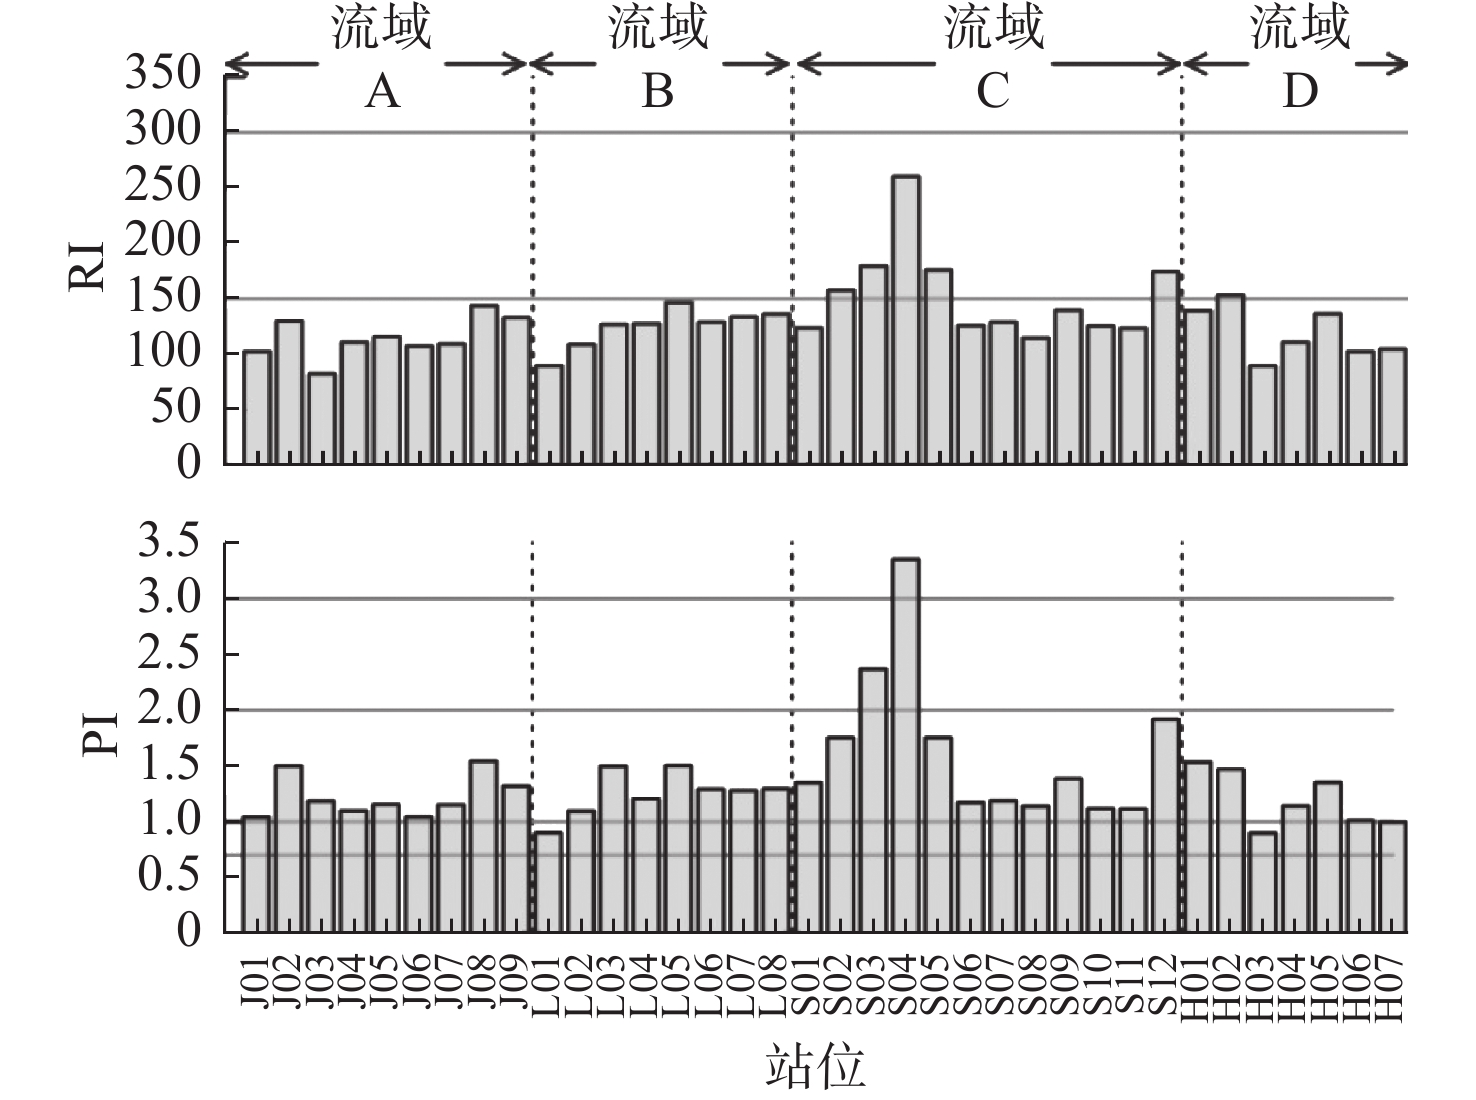
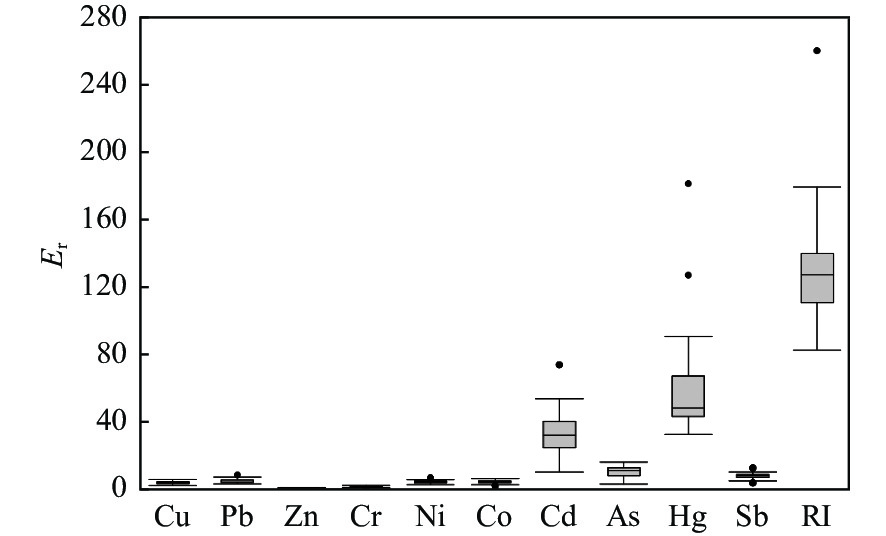
土壤中潜在有毒元素(PTEs)易通过食物链的累积对人体健康构成严重威胁,探究其浓度对于生态环境安全具有重要意义。为查明浙江三门湾沿岸土壤中PTEs含量、分布特征及主要来源,在三门湾沿岸4个小流域采集了36个站位土壤样品,进行了土壤黏土矿物、土壤酸碱度、10种PTEs及Si、Al、Fe和TOC含量分析。利用相关性和主成分分析进行了来源分析,并采用《土壤环境质量》(GB 15618—2018)、富集因子(EF)、内梅罗污染指数(PI)及潜在生态风险污染指数(RI)评价模型进行了环境风险评价。结果表明,不同地貌单元土壤黏土矿物组成差异明显,山间平原土壤高岭石和绿泥石占比相对高(平均值>30%),海积平原伊利石占比相对高(>60%)。山间平原土壤主要为原地母岩风化成壤,而海积平原区土壤主要为历史时期长江来源沉积物改造而成。土壤PTEs整体上呈现流域上游向下游增加的分布趋势。平均富集程度依次为Hg>Cd>Sb>As>Pb>Ni>Cr>Co>Zn> Cu。Hg元素轻微富集、中等富集和中等严重富集站位占比分别为27.8%、2.8%和2.8%。Cd、Sb、As和Pb分别有13.9%、8.3%、8.3%和16.7%的站位为轻微富集。PI值显示,5.6%的站位为严重和重度污染。RI值显示,16.7%的站位处于中生态风险水平,其中Hg和Cd分别贡献了44.8%和25.9%。相关性及主成分分析表明,Cu、Zn、Cr、Ni、Co、As、Sb主要是自然来源,受到成土母质、土壤机械组成、土壤pH等因素的影响。Pb、Cd、Hg主要为工业、农业及交通等人类活动来源。
Abstract:The accumulation of potential toxic elements (PTEs) in soil through the food chain poses a serious threat to human health. Therefore, it is important to investigate the concentration of PTEs in soil for ecological and environmental safety. To identify the content, distribution, and main sources of PTEs in soils along coast of Sanmen Bay, Zhejiang, soil samples were collected in 36 sites in four sub-basins along Sanmen Bay. The analyses of clay minerals, pH, 10 PTEs, Si, Al, Fe, and TOC in the soils were performed. Source analysis of PTEs was performed using correlation and principal component analysis. Assessment on environmental risk of PTEs based on the Soil Environmental Quality (China National Standard GB 15618—2018), Enrichment Factor (EF), Nemerow Pollution Index (PI), and Potential Ecological Risk Pollution Index (RI) was conducted. Results show that the clay mineral composition of soils in different geomorphic units varied significantly. In comparison, the proportions of kaolinite and chlorite in the intermontane plain soils were relatively high (>30% on average), and that of illite in the marine plain was relatively high (>60%). The intermontane plain soils are mainly from local weathered parent rocks, while the marine accumulation plain soils are mainly modified by sediment from the Changjiang (Yangtze) River during the historical period. The concentration of soil PTEs shows an increasing trend from upstream to downstream in all sub-basins. The order in average enrichment of PTEs from high to low was Hg, Cd, Sb, As, Pb, Ni, Cr, Co, Zn, and Cu. In addition, 27.8%, 2.8%, and 2.8% of the sites were in minor enrichment, moderate enrichment, and moderately-severe enrichment in Hg, respectively; 13.9%, 8.3%, 8.3%, and 16.7% of the sites were in minor enrichment in Cd, Sb, As, and Pb, respectively. PI values showed that 86.1%, 2.8%, and 2.8% of the sites were moderately polluted, heavily polluted, and severely polluted, respectively. RI values showed that 16.7% of the sites ranked in ecological grade of moderate risk, whose Hg and Cd were amounted to 44.8% and 25.9%, respectively. The correlation and principal component analysis suggested that Cu, Zn, Cr, Ni, Co, As, and Sb were mainly in natural origination from soil-forming parent rocks, soil mechanical composition, soil pH, etc. On the other hand, Pb, Cd, and Hg were mainly anthropogenic from activities of industry, agriculture, and transportation.
-
Key words:
- Sanmen Bay /
- soil /
- clay minerals /
- potential toxic elements /
- pollution assessment
-

-
表 1 农用地土壤污染风险管控标准
Table 1. Standard of risk control on soil contamination in agricultural land
污染元素 风险筛选值/(μg/g) 风险管控值/(μg/g) pH≤5.5 5.5<pH≤6.5 6.5<pH≤7.5 pH>7.5 pH≤5.5 5.5<pH≤6.5 6.5<pH≤7.5 pH>7.5 Cd 0.3 0.3 0.3 0.6 1.5 2 3 4 Hg 1.3 1.8 2.4 3.4 2 2.5 4 6 As 40 40 30 25 200 150 120 100 Pb 70 90 120 170 400 500 700 1000 Cr 150 150 200 250 800 850 1000 1300 Cu 50 50 100 100 - - - - Ni 60 70 100 190 - - - - Zn 200 200 250 300 - - - - 表 2 三门湾沿岸土壤潜在有毒元素含量
Table 2. Concentration of potential toxic elements in soils along coast of Sanmen Bay
μg/g 范围 Cu Pb Zn Cr Ni Co Cd As Hg Sb 最小值 全部 5.2 21.7 45.8 11.9 6.3 3.5 0.046 2.0 0.036 0.26 最大值 全部 38.4 50.8 111.0 108.0 53.4 23.3 0.220 15.7 0.200 1.07 平均值 全部 23.6 31.6 84.7 71.9 32.3 14.0 0.111 9.5 0.069 0.63 流域A 24.3 32.2 84.8 74.8 33.6 14.9 0.089 10.1 0.057 0.65 流域B 22.4 31.7 87.0 65.9 30.3 13.7 0.120 8.3 0.064 0.55 流域C 24.3 34.4 84.9 68.8 30.4 12.7 0.129 9.2 0.088 0.67 流域D 23.2 27.6 83.3 79.0 35.3 15.0 0.103 10.5 0.060 0.67 表 3 三门湾沿岸土壤黏土矿物含量
Table 3. Content of clay minerals in the soils along coast of Sanmen Bay
蒙脱石/% 伊利石/% 高岭石/% 绿泥石/% 数据来源 上游山间平原土壤 范围 - 14.5~42.8 26.6~39.7 30.2~45.8 本研究 平均值 - 34.1 31.4 34.5 下游海积平原土壤 范围 2.8~5.9 61.6~65.8 12.3~16.5 16.8~19.2 本研究 平均值 4.2 63.8 13.7 18.3 三门湾海域表层沉积物 范围 2.4~5.8 61.3~65.9 14.3~15.5 16.2~18.9 本研究 平均值 63.3 15.0 18.1 象山外海表层沉积物 4.0 61.5 15.6 18.8 周晓静 [44] 椒江口外表层沉积物 2.3 62.6 16.5 18.6 周晓静 [44] 椒江河流沉积物 3.7 52.7 27.3 16.3 薛成凤等[45] 长江河流沉积物 10 65 14 11 杨作升 [46] 长江河流沉积物 5 67 9 19 XU等 [47] 表 4 潜在有毒元素毒性系数及背景值
Table 4. Toxicity coefficients and background concentration of potential toxic elements
元素 Cu Pb Zn Cr Ni Co Cd As Sb Hg 文献来源 毒性系数 5a 4a 1a 2a 5b 5b 30a 10a 7c 40a aHAKANSON [40]
b徐争启等 [42]
cWANG [43]Hakanson背景值/(μg/g) 50 70 175 90 1 15 0.25 HAKANSON [40] 浙江近岸表层沉积物/(μg/g) 20 27 75 75 0.102 9.1 0.034 张志忠等 [53] 浙东近海沉积物背景值/(μg/g) 36.1 35.3 116.7 96.8 45.9 18.3 0.089 9.8 0.59 0.050 未发表数据 浙江中酸性火山岩/(μg/g) 12.1 30.1 72.2 34.9 11.3 9.2 0.133 6.6 0.52 0.044 汪庆华等 [50] 表 5 土壤环境质量指数(基于风险筛选值)
Table 5. Indices of soil environmental quality (based on risk filter value)
元素 Cu Pb Zn Cr Ni Cd As Hg 最小值 0.10 0.13 0.23 0.08 0.10 0.22 0.05 0.01 最大值 0.71 0.73 0.56 0.67 0.76 0.90 0.63 0.15 平均值 0.29 0.29 0.33 0.32 0.23 0.44 0.35 0.03 表 6 土壤潜在有害元素富集因子
Table 6. Enrichment factors of potential toxic elements in the soil samples
Cu Pb Zn Cr Ni Co Cd As Hg Sb EF 最小值 0.56 0.71 0.72 0.38 0.61 0.48 0.29 0.34 0.70 0.55 最大值 1.38 2.02 1.21 1.13 1.19 1.43 2.80 1.87 5.24 1.72 平均值 0.86 1.04 0.88 0.92 0.94 0.89 1.20 1.09 1.61 1.19 EF区间比例/% <1.5 100 83.3 100 100 100 100 86.1 91.7 66.6 91.7 1.5~3 0 16.7 0 0 0 0 13.9 8.3 27.8 8.3 3~5 0 0 0 0 0 0 0 0 2.8 0 5~10 0 0 0 0 0 0 0 0 2.8 0 表 7 三门湾沿岸土壤潜在有毒元素Pearson相关性矩阵
Table 7. The Pearson correlation matrix of potential toxic elements in soils along coast of Sanmen Bay
Cu Pb Zn Cr Ni Co Cd As Hg Sb Si Al Fe TOC pH Cu 1 Pb −0.47** 1 Zn 0.91** −0.30 1 Cr 0.93** −0.59** 0.85** 1 Ni 0.94** −0.57** 0.87** 0.99** 1 Co 0.92** −0.58** 0.87** 0.98** 0.99** 1 Cd 0.17 0.31 0.19 −0.02 −0.02 −0.04 1 As 0.89** −0.54** 0.77** 0.91** 0.91** 0.91** −0.02 1 Hg −0.33* 0.66** −0.32 −0.43** −0.45** −0.49** 0.47** −0.43** 1 Sb 0.71** −0.19 0.55** 0.66** 0.64** 0.62** 0.24 0.79** 0.01 1 Si −0.92** 0.59** −0.90** −0.95** −0.96** −0.95** 0.02 −0.89** 0.46** −0.63** 1 Al 0.82** −0.41** 0.91** 0.83** 0.86** 0.87** −0.05 0.75** −0.42* 0.50** −0.92** 1 Fe 0.92** −0.59** 0.89** 0.97** 0.98** 0.99** −0.03 0.93** −0.50** 0.63** −0.97** 0.89** 1 TOC −0.51** 0.46** −0.49** −0.55** −0.57** −0.61** 0.50** −0.66** 0.62** −0.36* 0.56** −0.49** −0.62** 1 pH 0.79** −0.71** 0.65** 0.87** 0.85** 0.82** −0.16 0.85** −0.49** 0.57** −0.84** 0.63** 0.83** −0.64** 1 注:**在p<0.01水平显著(双尾);*在 p<0.05水平显著(双尾)。 表 8 三门湾沿岸土壤潜在有毒元素旋转成分矩阵
Table 8. Rotation component matrix of potential toxic elements in the soils along coast of Sanmen Bay
变量 因子载荷(旋转) PC1 PC2 Cu 0.966 −0.103 Pb −0.403 0.687 Zn 0.919 −0.055 Cr 0.937 −0.279 Ni 0.942 −0.282 Co 0.926 −0.319 Cd 0.249 0.826 As 0.904 −0.276 Hg −0.239 0.835 Sb 0.775 0.162 Si −0.934 0.288 Al 0.848 −0.234 Fe 0.933 −0.324 TOC −0.450 0.686 pH 0.769 −0.453 特征值 9.356 3.146 方差贡献率/% 62.375 20.973 累积方差贡献率/% 62.375 83.349 注:旋转方法为凯撒正态化最大方差法;旋转在3次迭代后已收敛。 -
[1] HU B Q,LI J,ZHAO J T,et al. Heavy metal in surface sediments of the Liaodong Bay,Bohai Sea:distribution,contamination,and sources[J]. Environ Monit Assess,2013,185(6):5071-5083. doi: 10.1007/s10661-012-2926-0
[2] CHEN T,LIU X M,ZHU M Z,et al. Identification of trace element sources and associated risk assessment in vegetable soils of the urban-rural transitional area of Hangzhou,China[J]. Environ Pollut,2008,151(1):67-78. doi: 10.1016/j.envpol.2007.03.004
[3] FAN Y,CHEN X,CHEN Z,et al. Pollution characteristics and source analysis of heavy metals in surface sediments of Luoyuan Bay,Fujian[J]. Environmental Research,2021,203:111911.
[4] 戴彬,吕建树,战金成,等. 山东省典型工业城市土壤重金属来源、空间分布及潜在生态风险评价[J]. 环境科学,2015,36(2):507-515. doi: 10.13227/j.hjkx.2015.02.018
[5] ZHANG M,SUN X,XU J. Heavy metal pollution in the East China Sea:a review[J]. Marine Pollution Bulletin,2020,159:111473. doi: 10.1016/j.marpolbul.2020.111473
[6] 汪庆华,董岩翔,周国华,等. 浙江省土壤地球化学基准值与环境背景值[J]. 生态与农村环境学报,2007,23(2):81-88. doi: 10.3969/j.issn.1673-4831.2007.02.017
[7] ZHANG S,YANG D,LI F L,et al. Determination of regional soil geochemical baselines for trace metals with principal component regression:a case study in the Jianghan Plain,China[J]. Applied geochemistry,2014,48:193-206. doi: 10.1016/j.apgeochem.2014.07.019
[8] BOETTINGER J L. Alluvium and alluvial soils[J]. Encyclopedia of Soils in the Environment,2005,1:45-49.
[9] 毛盼,王明娅,孙昂,等. 某典型废弃硫酸场地土壤重金属污染特征与评价[J]. 环境化学,2021,41(2):1-15.
[10] 生态环境部. 2020年中国生态环境状况公报(摘录)[J]. 环境保护,2021,49(11):47-68. doi: 10.14026/j.cnki.0253-9705.2021.11.010
[11] 宋伟,陈百明,刘琳. 中国耕地土壤重金属污染概况[J]. 水土保持研究,2013,20(2):293-198.
[12] 关天霞,何红波,张旭东,等. 土壤中重金属元素形态分析方法及形态分布的影响因素[J]. 土壤通报,2011,42(2):503-512. doi: 10.19336/j.cnki.trtb.2011.02.049
[13] 朱荣,杨承虎,严峻,等. 浙江三门湾海域沉积物中重金属调查与评价[J]. 山东化工,2020,49(19):246-248. doi: 10.3969/j.issn.1008-021X.2020.19.110
[14] 曹柳燕,张捷,胡颢琰,等. 浙江南部近岸海域表层沉积物中重金属污染评价[J]. 环境污染与防治,2016,38(7):61-65. doi: 10.15985/j.cnki.1001-3865.2016.07.011
[15] 浙江省生态环境厅. 2020年浙江省生态环境状况公报[EB/OL]. (2021-06-03) [2021-10-18]. http://sthjt.zj.gov.cn/art/2021/6/3/art_1201912_58928030.html.
[16] 赵晨辉,胡佶,刘小涯,等. 浙江三门湾表层沉积物重金属含量分布、赋存形态及生态风险评价[J]. 海洋学研究,2018,36(2):64-73. doi: 10.3969/j.issn.1001-909X.2018.02.009
[17] 付雅晴,印萍,高飞,等. 浙江省三门湾北部潮滩互花米草遥感研究[J]. 中国海洋大学学报(自然科学版),2022,52(1):134-144.
[18] 刘晓凤,段晓勇,田元,等. 三门湾水体营养盐变化及其对人类活动的响应[J]. 海洋地质前沿,2021,37(5):46-56. doi: 10.16028/j.1009-2722.2020.052
[19] 李铁军,郭远明,贾怡然,等. 三门湾海域环境质量现状评价与分析[J]. 海洋湖沼通报,2011,130(3):123-128. doi: 10.3969/j.issn.1003-6482.2011.03.019
[20] 施晓来. 近15 a来三门湾海域氮,磷营养盐分布与富营养化状况的变化分析[J]. 海洋学研究,2013,31(4):63-67. doi: 10.3969/j.issn.1001-909X.2013.04.010
[21] 章明奎,王浩,张慧敏. 浙东海积平原农田土壤重金属来源辨识[J]. 环境科学学报,2008,28(10):1946-1954. doi: 10.3321/j.issn:0253-2468.2008.10.002
[22] 陶安安. 象山县土壤微量元素有效态含量与空间分布特征[J]. 浙江农业科学,2012,322(7):1036-1039. doi: 10.3969/j.issn.0528-9017.2012.07.041
[23] 章增强,杨杰,陈月丹. 象山县耕地土壤养分变迁与提升对策[J]. 浙江农业科学,2012,323(8):1182-1184. doi: 10.3969/j.issn.0528-9017.2012.08.039
[24] 岑汤校,安玲玲,麻万诸,等. 宁海县30年来耕地土壤养分的变化[J]. 浙江农业科学,2013,337(10):1346-1350. doi: 10.3969/j.issn.0528-9017.2013.10.041
[25] 宋文杰,禹丝思,陈梅花,等. 近30年三门湾海岸线时空变化及人为干扰度分析[J]. 浙江师范大学学报(自然科学版),2017,40(3):343-349.
[26] 象山县统计局. 2020年象山县国民经济和社会发展统计公报[EB/OL]. (2021-03-09) [2021-10-18]. http://www.xiangshan.gov.cn/art/2021/3/5/art_1229057754_3709589.html.
[27] 三门县统计局. 2020年三门县国民经济和社会发展统计公报[EB/OL]. [2021-10-18]. http://www.sanmen.gov.cn/art/2021/6/3/art_1229320973_3713549.html.
[28] 宁海县统计局. 2020年宁海县国民经济和社会发展统计公报[EB/OL]. (2021-04-25) [2021-10-18]. http://www.ninghai.gov.cn/art/2021/4/25/art_1229092456_59026529.html.
[29] 中国海湾志编纂委员会. 中国海湾志-第五分册(上海市和浙江省北部海湾) [M]. 北京: 海洋出版社, 1992.
[30] 水旭琼,申子彬,郁懋楠. 宁海县1957—2014年降水量时空变化特征[J]. 浙江农业科学,2018,59(7):1283-1285+1288. doi: 10.16178/j.issn.0528-9017.20180763
[31] 郑红波,吴健平,张珊. 浙江宁海农用地土壤有机质和土壤养分空间变异分析[J]. 浙江林学院学报,2010,27(3):379-384.
[32] XU G,LIU J,PEI S F,et al. Geochemical background and ecological risk of heavy metals in surface sediments from the west Zhoushan Fishing Ground of East China Sea[J]. Environmental Science and Pollution Research International,2015,22(24):20283-20294. doi: 10.1007/s11356-015-5662-5
[33] BISCAYE P E. Mineralogy and sedimentation of recent deep-sea clay in the Atlantic Ocean and adjacent seas and oceans[J]. Geological Society of America Bulletin,1965,76(7):803-832. doi: 10.1130/0016-7606(1965)76[803:MASORD]2.0.CO;2
[34] SUCHAROVà J,SUCHARA I,HOLA M,et al. Top-/bottom-soil ratios and enrichment factors:what do they really show?[J]. Applied Geochemistry,2012,27(1):138-145. doi: 10.1016/j.apgeochem.2011.09.025
[35] BRADY J P,AYOKO G A,MARTENS W N,et al. Development of a hybrid pollution index for heavy metals in marine and estuarine sediments[J]. Environmental Monitoring and Assessment,2015,187(306):1-14.
[36] DUODU G O,GOONETILLEKE A,AYOKO G A. Comparison of pollution indices for the assessment of heavy metal in Brisbane River sediment[J]. Environment Pollution,2016,219:1077-1091. doi: 10.1016/j.envpol.2016.09.008
[37] CHEN C W,KAO C M,CHEN C F,et al. Distribution and accumulation of heavy metals in the sediments of Kaohsiung Harbor,Taiwan[J]. Chemosphere,2007,66(8):1431-1440. doi: 10.1016/j.chemosphere.2006.09.030
[38] LIU J,YIN P,CHEN X Y,et al. Distribution,enrichment and transport of trace metals in sediments from the Dagu River Estuary in the Jiaozhou Bay,Qingdao,China[J]. Minerals,2019,9(9):1-18.
[39] NEMEROW N L. Stream, lake, estuary, and ocean pollution [M]. United States: Web, 1991.
[40] HAKANSON L. An ecological risk index for aquatic pollution control. a sedimentological approach[J]. Water Research,1980,14(8):975-1001. doi: 10.1016/0043-1354(80)90143-8
[41] MANOJ K,PADHY P K. Distribution,enrichment and ecological risk assessment of six elements in bed sediments of a tropical river,Chottanagpur Plateau:a spatial and temporal appraisal[J]. Journal of Environmental Protection,2014,5(14):1419-1434. doi: 10.4236/jep.2014.514136
[42] 徐争启,倪师军,庹先国,等. 潜在生态危害指数法评价中重金属毒性系数计算[J]. 环境科学与技术,2008,148(2):112-115. doi: 10.3969/j.issn.1003-6504.2008.02.030
[43] WANG N,WANG A,KONG L,et al. Calculation and application of Sb toxicity coefficient for potential ecological risk assessment[J]. Science of Total Environment,2018,610/611:167-174. doi: 10.1016/j.scitotenv.2017.07.268
[44] 周晓静. 浙江沿岸黏土矿物与长江物质示踪标记的初步研究[D]. 青岛: 中国科学院研究生院(海洋研究所), 2003.
[45] 薛成凤,贾建军,高抒,等. 中小河流对长江水下三角洲远端泥沉积的贡献:以椒江和瓯江为例[J]. 海洋学报,2018,40(5):75-89.
[46] 杨作升. 黄河、长江、珠江沉积物中黏土的矿物组合、化学特征及其与物源区气候环境的关系[J]. 海洋与湖沼,1988,19(4):336-346.
[47] XU K,MILLIMAN J D,LI A C,et al. Yangtze- and Taiwan-derived sediments on the inner shelf of East China Sea[J]. Continental Shelf Research,2009,29(18):2240-2256. doi: 10.1016/j.csr.2009.08.017
[48] YANG S Y,JUNG H S,LIM D I,et al. A review on the provenance discrimination of sediments in the Yellow Sea[J]. Earth-Science Reviews,2003,63(1/2):93-120.
[49] 范德江,杨作升,毛登,等. 长江与黄河沉积物中黏土矿物及地化成分的组成[J]. 海洋地质与第四纪地质,2001,21(4):7-12.
[50] 汪庆华,董岩翔,郑文,等. 浙江土壤地球化学基准值与环境背景值[J]. 地质通报,2007,26(5):590-597. doi: 10.3969/j.issn.1671-2552.2007.05.012
[51] LI Q,LI S,XIAO Y,et al. Soil acidification and its influencing factors in the purple hilly area of southwest China from 1981 to 2012[J]. Catena,2019,175:278-285. doi: 10.1016/j.catena.2018.12.025
[52] 周建军,周桔,冯仁国. 我国土壤重金属污染现状及治理战略[J]. 中国科学院院刊,2014,29(3):315-320,350,272.
[53] 张志忠,李双林,董岩翔,等. 浙江近岸海域沉积物沉积速率及地球化学特征[J]. 海洋地质,2005,25(3):15-24.
[54] LV J,LIU Y,ZHANG Z,et al. Multivariate geostatistical analyses of heavy metals in soils:spatial multi-scale variations in Wulian,Eastern China[J]. Ecotoxicology and environmental safety,2014,107:140-147. doi: 10.1016/j.ecoenv.2014.05.019
[55] LV J,LIU Y,ZHANG Z,et al. Identifying the origins and spatial distributions of heavy metals in soils of Ju country (Eastern China) using multivariate and geostatistical approach[J]. Journal of Soils and Sediments,2014,15:163-178.
[56] 邹勇军,胡小娟,汪成钵,等. 江西省赣县沙地土壤重金属的来源及环境等级评价[J]. 中国煤炭地质,2018,30(11):66-73. doi: 10.3969/j.issn.1674-1803.2018.11.14
[57] 陈清霞,陆晓辉,涂成龙. 安顺市土壤pH空间变异及影响因素分析[J]. 环境科学,2021,43(4):2124-2132. doi: 10.13227/j.hjkx.202108126
[58] 史坚,廖欣峰,祝小祥,等. 节能灯企业集聚区周边农田土壤重金属污染评价[J]. 上海农业学报,2014,30(2):90-94. doi: 10.3969/j.issn.1000-3924.2014.02.021
[59] WALKER S,GRIFFIN S. Site-specific data confirm arsenic exposure predicted by the US Environmental Protection Agency[J]. Environmental Health Perspectives,1998,106(3):133-139. doi: 10.1289/ehp.98106133
-


 下载:
下载:


