Grid calculation of geological carbon sink capacity in coastal bays: a case study of Sanmen Bay
-
摘要:
河口海湾地区因沉积物富含有机质和高沉积速率成为地球上重要的碳汇区,在专题性碳汇调查不足情况下,如何更好地发掘前人地质调查数据资源,科学计算河口海湾地质碳埋藏能力,是科学评价海洋碳汇能力支撑双碳目标的重要挑战。以浙江省三门湾海域表层沉积物和沉积柱状样品为研究对象,综合运用粒度分析、有机地球化学分析、210Pb和137Cs测年等测试手段,充分考虑海湾地区海底地形复杂、海陆交互强烈、人类活动活跃等典型特征,探索海湾碳汇网格化计算方法,建立了海湾地质碳汇评估模型。计算表明:三门湾有机碳年埋藏速率为64.04 gC·m−2·a−1,有机碳年埋藏量达89.71 GgC,河口和潮滩区有机碳埋藏速率高,为74.02 gC·m−2·a−1,海湾中部和深水区为52.93 gC·m−2·a−1。
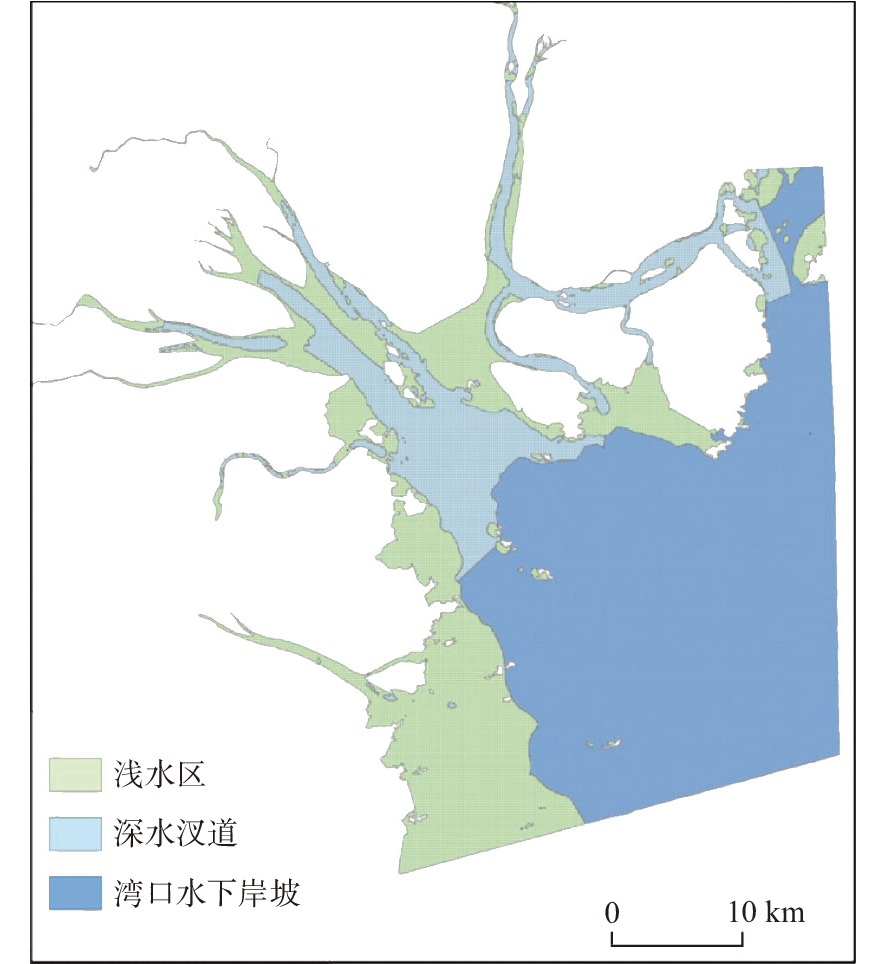
Abstract:The burial rate of organic carbon in a bay is closely related to its geological carbon sink capacity. It is an important challenge to evaluate the ocean carbon sink capacity to support the “dual carbon” goal (carbon peaking and carbon neutrality). Taking the surface sediments and sediment core samples collected in 2019 in the Sanmen Bay, Zhejiang Province as the research object, the typical characteristics of the complex seabed topography, strong sea-land interaction, and active human activities in the bay area were studied comprehensively using particle size analysis, organic geochemical analysis, and 210Pb and 137Cs dating methods. A carbon sink grid calculation method based on the division of bathymetric topographic in the study area was explored, and the bay was divided into shallow tidal flat, deep-water channels, and underwater plain. In addition, the burial rates of organic carbon in different sedimentary environments were obtained. Therefore, a geological carbon sink evaluation model of the Sanmen Bay was established by using inverse distance weighted spatial interpolation. The calculation results show that the burial rate of organic carbon in the study area was 64.04 gC/m2·a. The annual buried amount of organic carbon was 89.71 GgC. Among them, the burial rate of organic carbon in the shallow tidal flat and deep-water channel areas was relatively high at 74.02 and 80.48 gC/m2·a, respectively, and that in the underwater plain area was 52.93 gC/m2·a.
-
Key words:
- Sanmen Bay /
- geological carbon sink /
- gridding /
- burial rate of organic carbon
-

-
表 1 三门湾表层沉积物中值粒径和各组分含量
Table 1. Median grain size and component content of surface sediments in the Sanmen Bay
中值粒径/Φ 砂/% 粉砂/% 黏土/% 最大值 7.57 16.57 77.71 37.72 最小值 5.65 1.34 56.36 11.55 平均值 6.87 6.00 66.30 27.70 表 2 三门湾表层沉积物粒度和TOC值Pearson相关性分析
Table 2. The Pearson correlation between grain size and TOC content of surface sediments in the Sanmen Bay
中值粒径 TOC 砂 粉砂 黏土 中值粒径 1 TOC 0.389** 1 砂 -0.545** 0.065 1 粉砂 -0.758** -0.520** -0.118 1 黏土 0.991** 0.403** -0.530** -0.780** 1 注:**代表p<0.01; *代表p<0.05。 表 3 三门湾表层沉积物TOC含量正态分布检验结果
Table 3. Test of normal distribution of TOC content in surface sediments of the Sanmen Bay
区域 平均值 标准差 显著性 决策 全海湾 0.50 0.119 35 0.018a 非正态分布 浅水区 0.50 0.091 72 0.200a,b 正态分布 深水汊道 0.55 0.096 52 0.137a 正态分布 湾口水下岸坡 0.42 0.106 01 0.200a,b 正态分布 注: a为里氏修正后;b为真显著性的下限。 表 4 基于海湾分区的有机碳埋藏速率
Table 4. Organic carbon deposition flux in each bay division in the Sanmen Bay
区域 面积/km2 单位面积有机碳沉积通量/(gC·m−2·a−1) 区域有机碳沉积通量/(GgC/a) 浅水区 413.89 74.02 30.79 深水汊道 230.93 80.48 18.72 湾口水下岸坡 762.51 52.93 40.21 三门湾全区 1 407.33 64.04 89.71 -
[1] SABINE C L,FEELY R A,GRUBER N J. The oceanic sink for anthropogenic CO2[J]. Science,2004,305(5682):367-371. doi: 10.1126/science.1097403
[2] BOYD P W,CLAUSTRE H,LEVY M,et al. Multi-faceted particle pumps drive carbon sequestration in the ocean[J]. Nature,2019,568(7752):327-335. doi: 10.1038/s41586-019-1098-2
[3] CAI W J. Estuarine and coastal ocean carbon paradox:CO2 sinks or sites of terrestrial carbon incineration?[J]. Annual Review of Marine Science,2011,3(1):123. doi: 10.1146/annurev-marine-120709-142723
[4] CHEN T A C,HUANG T H,CHEN Y T,et al. Air-sea exchanges of coin the world's coastal seas[J]. Biogeosciences,2013,10:6509-6544. doi: 10.5194/bg-10-6509-2013
[5] JIAO N Z,TANG K,CAI H Y,et al. Increasing the microbial carbon sink in the sea by reducing chemical fertilization on the land.[J]. Nature Reviews Microbiology,2010,9(1):75.
[6] HEDGES J I, KEIL R G. Sedimentary organic matter preservation:an assessment and speculative synthesis[J]. Marine Chemistry,1995,49(2/3):123-126.
[7] 戴民汉,翟惟东,鲁中明,等. 中国区域碳循环研究进展与展望[J]. 地球科学进展,2004,19(1):120-130. doi: 10.3321/j.issn:1001-8166.2004.01.017
[8] 赵美训,丁杨,于蒙. 中国边缘海沉积有机质来源及其碳汇意义[J]. 中国海洋大学学报(自然科学版),2017,47(9):70-76.
[9] 白亚之,乔淑卿,吴斌,等. 泰国湾百年来有机碳埋藏记录及环境响应[J]. 沉积学报,2022,40(2):484-493.
[10] 邢庆会,于彩芬,廖国祥,等. 浅析我国海岸带蓝碳应对气候变化的发展研究[J]. 海洋环境科学,2022,41(1):1-7. doi: 10.12111/j.mes.20200251
[11] 焦念志,梁彦韬,张永雨,等. 中国海及邻近区域碳库与通量综合分析[J]. 中国科学:地球科学,2018,48(11):1393-1421.
[12] 侯雪景,印萍,丁旋,等. 青岛胶州湾大沽河口滨海湿地的碳埋藏能力[J]. 海洋地质前沿,2012,28(11):17-26.
[13] 胡利民. 大河控制性影响下的陆架海沉积有机质的"源—汇"作用[D]. 青岛: 中国海洋大学, 2010.
[14] 张明宇,常鑫,胡利民,等. 东海内陆架有机碳的源—汇过程及其沉积记录[J]. 沉积学报,2021,39(3):593-609.
[15] HU L M,SHI X F,BAI Y Z,et al. Recent organic carbon sequestration in the shelf sediments of the Bohai Sea and Yellow Sea,China[J]. Journal of Marine Systems,2016,155:50-58. doi: 10.1016/j.jmarsys.2015.10.018
[16] DENG B,ZHANG J,WU Y. Recent sediment accumulation and carbon burial in the East China Sea[J]. Global Biogeochemical Cycles,2006,20(3):1-12.
[17] 石学法,胡利民,乔淑卿,等. 中国东部陆架海沉积有机碳研究进展:来源、输运与埋藏[J]. 海洋科学进展,2016,34(3):313-327.
[18] 许建平,杨士英. 三门湾海洋生态环境概述[J]. 能源工程,1992(2):28-30. doi: 10.16189/j.cnki.nygc.1992.02.011
[19] 刘晓凤,段晓勇,田元,等. 三门湾水体营养盐变化及其对人类活动的响应[J]. 海洋地质前沿,2021,37(5):46-56. doi: 10.16028/j.1009-2722.2020.052
[20] 夏小明. 三门湾潮汐汊道系统的稳定性[D]. 杭州: 浙江大学, 2011.
[21] 胡方西,曹沛奎. 三门湾潮波运动特征及其与地貌发育的关系[J]. 海洋与湖沼,1981(3):225-234.
[22] 杨士瑛. 三门湾自然环境特征与资源可持续利用[M]. 青岛: 中国海洋大学出版社, 2018.
[23] 穆锦斌. 三门核电3、4号机组海域使用论证岸滩稳定性分析和数值计算专题之一: 岸滩稳定性分析报告[R]. 杭州: 浙江省水利河口研究院, 2014.
[24] 谢钦春,马黎明,李伯根,等. 浙江三门湾猫头深潭风暴快速沉积研究[J]. 海洋学报,2001,23(5):78-86.
[25] 杨辉,谢钦春,李伯根,等. 三门湾猫头深潭及附近海域底床冲淤演变及其动力机制[J]. 东海海洋,2003,21(2):13-22.
[26] 应超,王乐乐,黄世昌. 三门湾猫头深潭对“烟花”台风的冲淤响应[J]. 水利水运工程学报,2021(6):43-50. doi: 10.12170/20210929003
[27] 姚炎明. 三门湾海洋环境容量及污染物总量控制研究[M]. 北京: 海洋出版社, 2015.
[28] 鲁青原. 辽河滨海芦苇湿地有机碳的埋藏过程及控制因素[D]. 杭州: 浙江大学, 2020.
[29] 薛成凤,盛辉,魏东运,等. 沉积物干容重分析及其沉积学意义:以东海内陆架海区为例[J]. 海洋与湖沼,2020,51(5):1093-1107. doi: 10.11693/hyhz20191000200
[30] 章伟艳,金海燕,张富元,等. 长江口—杭州湾及其邻近海域不同粒级沉积有机碳分布特征[J]. 地球科学进展,2009,24(11):1202-1209. doi: 10.3321/j.issn:1001-8166.2009.11.004
[31] 赵军. 长江口与密西西比河口沉积有机碳生物地球化学比较研究[D]. 青岛: 中国海洋大学, 2011.
[32] 陈培雄,张鹤,周鑫,等. 三门湾近期围填海工程对海洋环境综合影响分析[J]. 绿色科技,2018(4):104-109. doi: 10.16663/j.cnki.lskj.2018.04.033
[33] KASTOWSKI M,HINDERER M,VECSEI A. Long-term carbon burial in European lakes:analysis and estimate[J]. Global Biogeochemical Cycles,2011,25(3):1-12.
[34] XU H,LAN J,LIU B,et al. Modern carbon burial in Lake Qinghai,China[J]. Applied Geochemistry,2013,39:150-155. doi: 10.1016/j.apgeochem.2013.04.004
[35] 宋以龙,陈敬安,杨海全,等. 云南抚仙湖沉积物有机质来源与时空变化特征[J]. 矿物岩石地球化学通报,2016,35(4):618-624,607. doi: 10.3969/j.issn.1007-2802.2016.04.002
[36] 张风菊,薛滨,姚书春. 中全新世以来呼伦湖沉积物碳埋藏及其影响因素分析[J]. 湖泊科学,2018,30(1):234-244. doi: 10.18307/2018.0123
[37] 陆健健. 中国滨海湿地的分类[J]. 环境导报,1996(1):1-2.
[38] 刘庆武,胡志艳. 如何用SPSS、SAS统计软件进行正态性检验[J]. 湘南学院学报,2005,7(3):56-58.
[39] 杨斌. 正态性检验的几种方法比较[J]. 统计与决策,2015(14):72-74. doi: 10.13546/j.cnki.tjyjc.2015.14.019
[40] TOBLER W R. A computer movie simulating urban growth in the Detroit Region[J]. Economic Geography,1970,46(2):234-240.
[41] 李新,程国栋,卢玲. 空间内插方法比较[J]. 地球科学进展,2000,15(3):260-265.
-


 下载:
下载:
