Characteristics of evaporation and its effect factors in the Golmud River catchment
-
摘要:
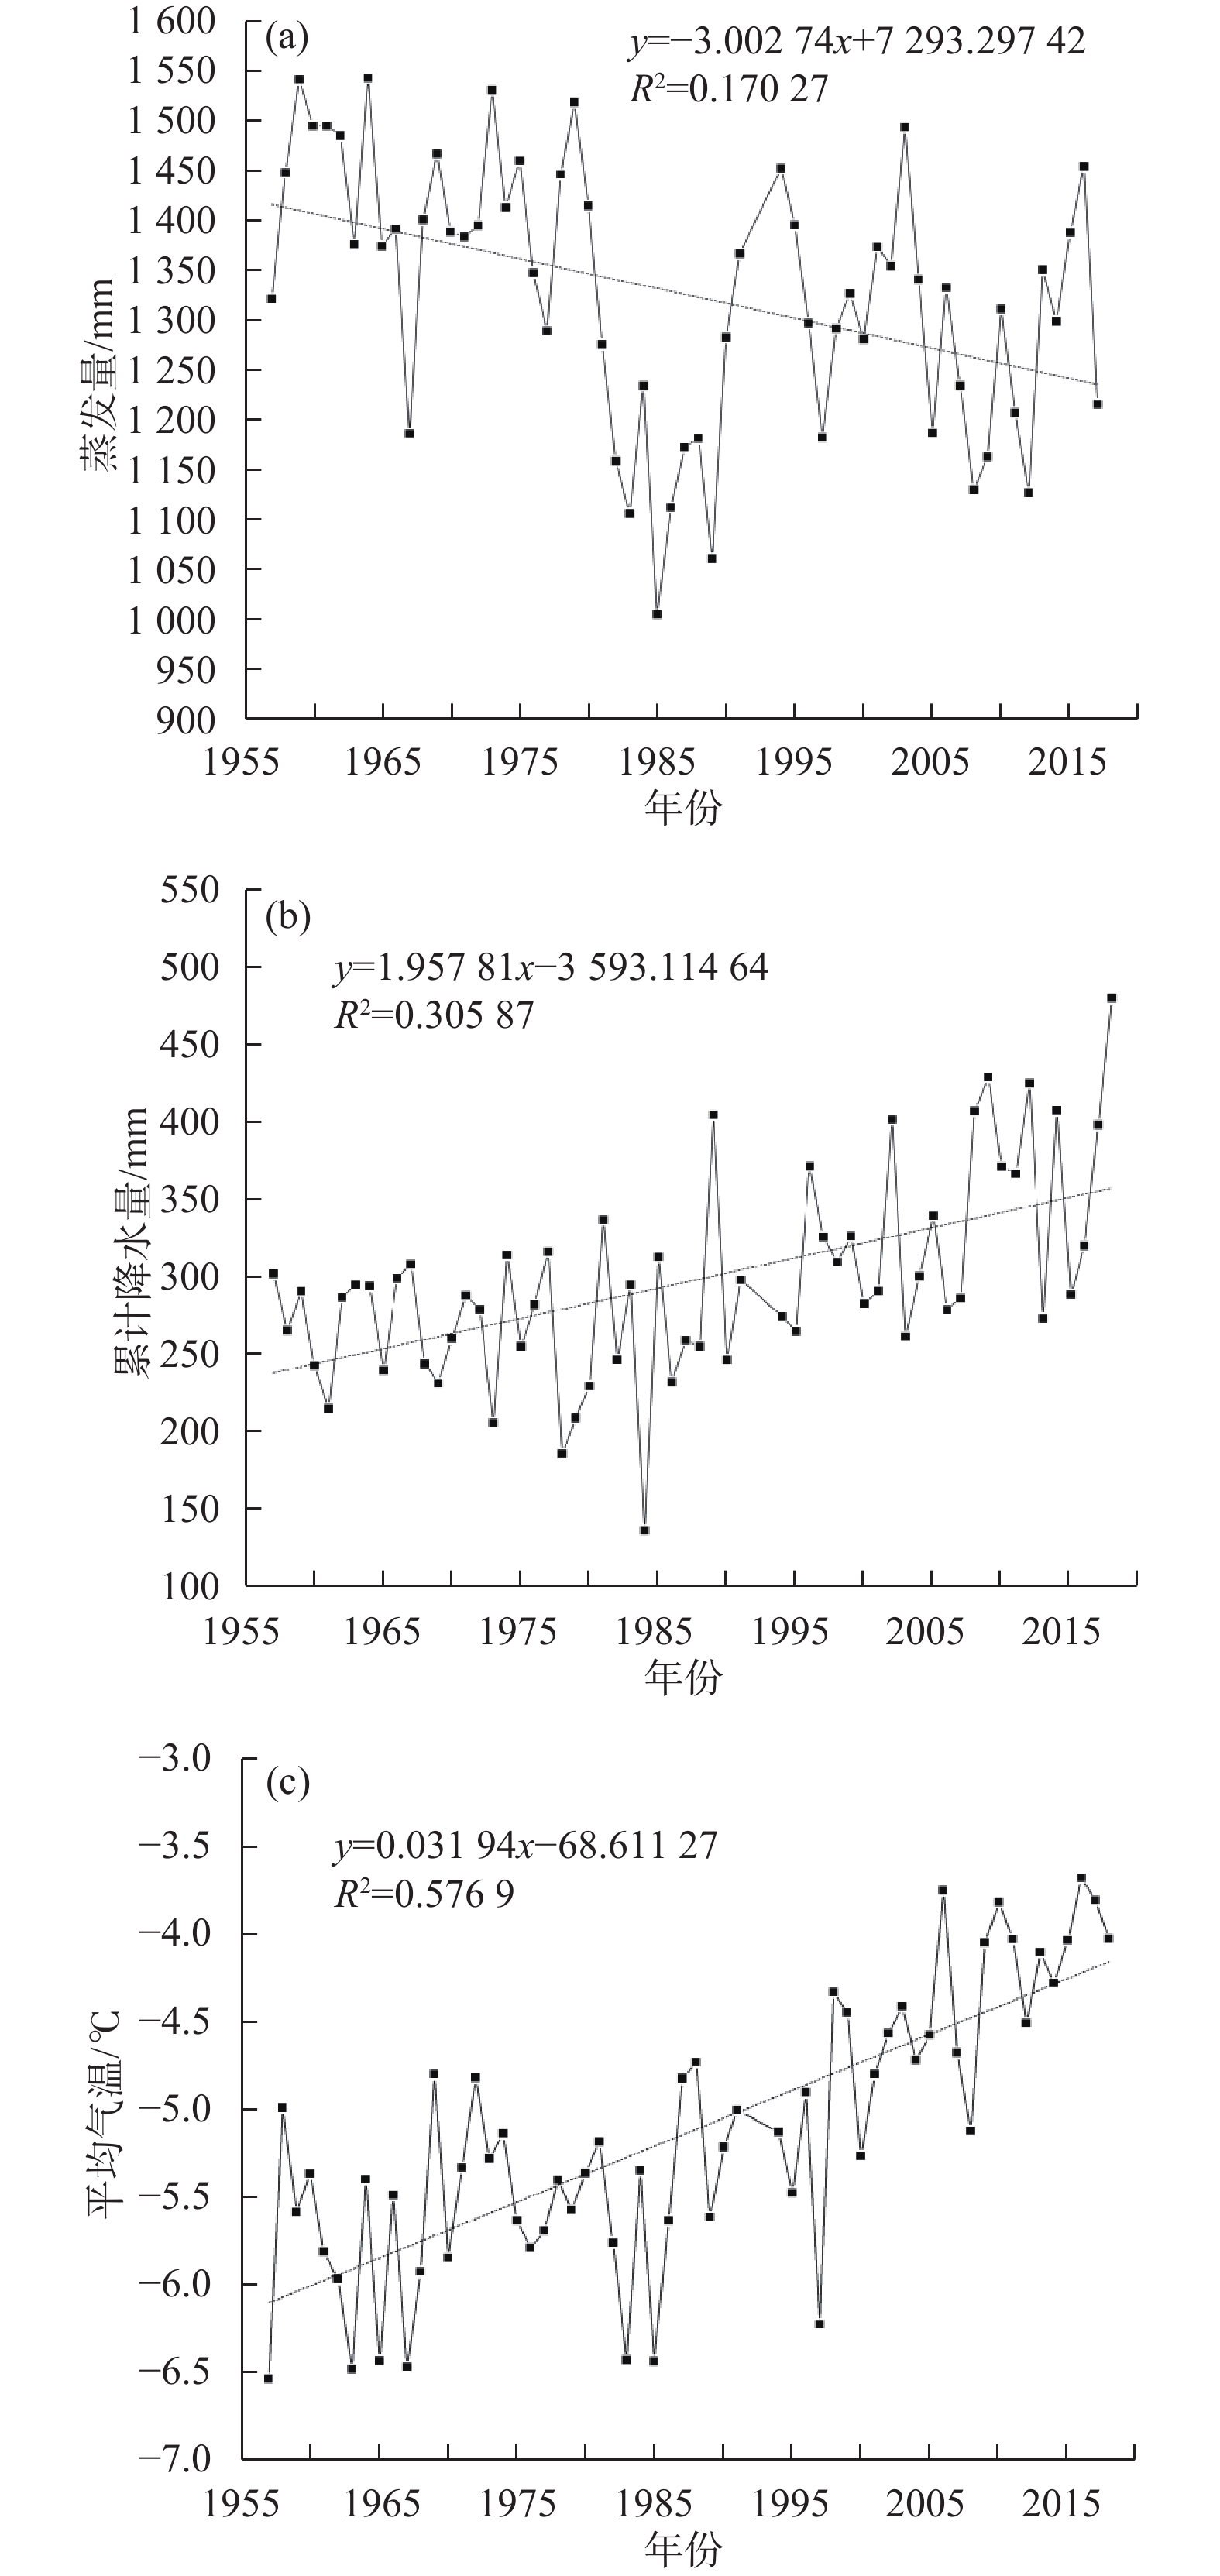
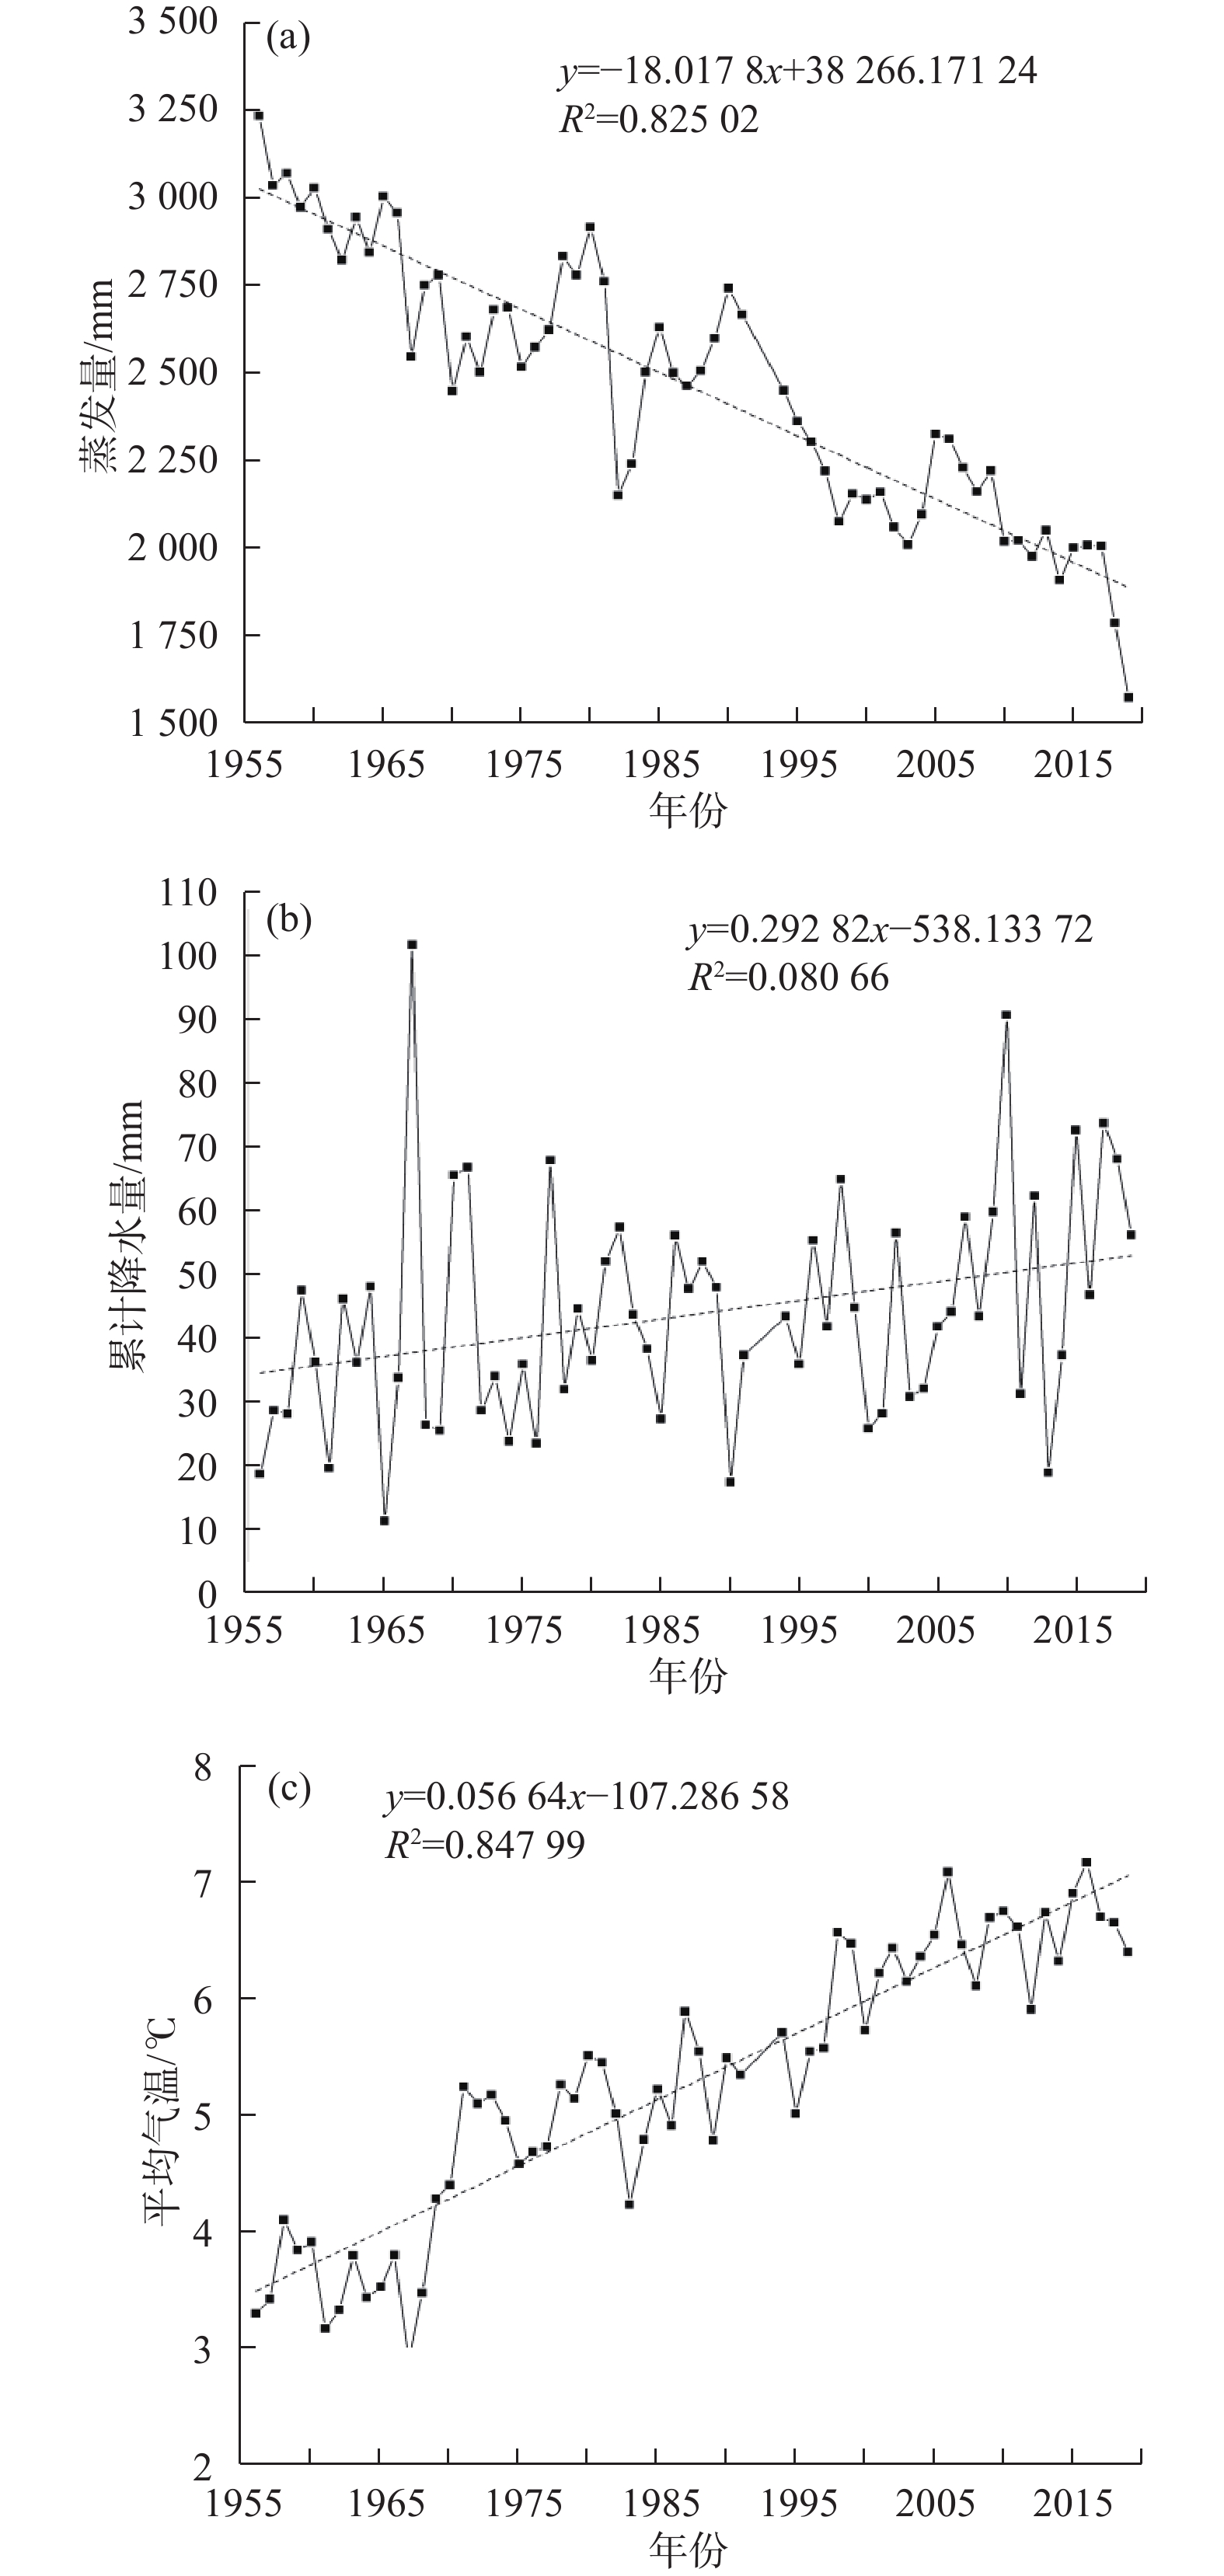
水面蒸发是水均衡的重要一项,阐明其变化特征对水资源评价具有重要的指导意义。格尔木河流域是我国西北旱区典型的内陆河流域,面临水资源开发利用与水害减灾双重挑战。前人对流域内水面蒸发相关研究未考虑主控因素及空间异质性,气候变化背景下水面蒸发特征也有待进一步研究。基于格尔木河流域气象观测资料,采用时间序列分析、相关分析和多元回归分析方法,研究了流域上游山区、中游戈壁砾石带及终端尾闾湖的水面蒸发特征及其主要影响因素。结果表明:(1)流域内水面蒸发呈波动下降趋势,但蒸发量空间差异明显,上游山区近60 年蒸发量减少了183.2 mm,中游近60 年减少了1135.1 mm,下游尾闾湖近30年减少了241.7 mm;(2)流域内水面蒸发主控因素不同,上游山区主控因素为气温,中游主控因素为风速,终端尾闾湖主控因素为水域面积;(3)流域内气候变化总体呈暖湿化,与全球气候变化一致,但水面蒸发未随气温升高和降水增加而增加,呈现出“蒸发悖论”特征。研究表明,水面蒸发的空间差异性及其主控因素对旱区流域蒸发和水资源评价具有重要影响。
Abstract:Evaporation is the key item of water balance calculation. Clarifying its characteristics will be helpful in water resources assessment. The Golmud river catchment is a typical arid inland river catchment in northwest of China, facing the challenges of reasonable groundwater exploitation and retarded groundwater disaster. Previous studies on surface water evaporation in the catchment did not consider the spatial heterogeneity and main control factors, which limits deep understanding of the evaporation process under the background of climate change. In this paper, based on time series, correlation and multiple regression analysis, the variation characteristics and main affecting factors of water evaporation in the upstream, midstream and downstream of the catchment are analyzed. The results show that (1) the water surface evaporation in the basin shows a fluctuating downward trend, but the spatial difference is obvious: 183.2 mm decreased in the upstream mountainous area in recent 60 years, 1135.1 mm decreased in the middle reaches in recent 60 years, and 241.7 mm decreased in the downstream terminal lake in recent 30 years. (2) The main controlling factors of water surface evaporation are different in the catchment: the main controlling factor is temperature in the upstream mountainous area, wind speed in the middle reaches, and water area in the terminal lake. (3) The climate change in the catchment is generally warm and humid, which is consistent with the global climate change. However, water evaporation does not increase with climate change, i.e., showing the “evaporation paradox” phenomena. The results indicate that great attention should be paid to the spatial differences and the main control factors, which have important influence on the evaporation research and water resource evaluation in arid areas.
-

-
表 1 五道梁气象站蒸发、降水及气温每10 年平均值
Table 1. Changes of the mean values of every 10 years of evaporation, precipitation and temperature in the Wudaoliang meteorological station
时间段 平均蒸发量/mm 平均降水量/mm 平均气温/℃ 1957—1966 1448.1 273.3 −5.8 1967—1976 1398.3 267.1 −5.5 1977—1986 1257.0 250.3 −5.7 1987—1998 1269.4 301.3 −5.1 1999—2008 1306.5 317.9 −4.6 2009—2018 1152.5 376.4 −4.0 表 2 五道梁气象站蒸发量与气象因子相关系数
Table 2. Correlation coefficient of evaporation and climatic factors in the Wudaoliang meteorological station
累计
蒸发累计
降水平均
气压平均相
对湿度平均
气温平均
风速平均太
阳辐射累计蒸发 1 累计降水 0.50 1 平均气压 0.38 0.39 1 平均相对湿度 0.34 0.75 0.38 1 平均气温 0.83 0.78 0.52 0.69 1 平均风速 −0.37 −0.47 −0.45 −0.56 −0.60 1 平均太阳辐射 0.87 0.66 0.39 0.56 0.88 −0.42 1 表 3 五道梁气象站蒸发量与气象因子回归分析
Table 3. Regression analyses of evaporation and climatic factors in the Wudaoliang meteorological station
相关系数 标准误差 t 统计量 P值 下限 95.0% 上限 95.0% 截距 0.16 0.08 2.00 0.05 0.00 0.31 累计降水量 −0.17 0.03 −5.40 0.00 −0.23 −0.11 平均气压 −0.02 0.08 −0.24 0.81 −0.18 0.14 平均相对湿度 −0.36 0.02 −14.56 0.00 −0.41 −0.31 平均气温 0.61 0.04 17.44 0.00 0.54 0.68 平均风速 0.05 0.02 1.84 0.07 0.00 0.09 太阳辐射 0.30 0.02 15.31 0.00 0.26 0.34 表 4 格尔木气象站蒸发、降水及气温每10 年平均值
Table 4. Changes of the mean values of every 10 years of evaporation, precipitation and temperature in the Golmud meteorological station
时间段 平均蒸发量/mm 平均降水量/mm 平均气温/℃ 1956—1965 2985.4 32.2 3.6 1966—1975 2646.3 44.3 4.4 1976—1985 2600.5 42.4 5.0 1986—1997 2481.0 43.6 5.4 1998—2007 2156.5 42.9 6.4 2008—2019 1978.6 55.2 6.6 表 5 格尔木气象站蒸发量与气象因子相关系数
Table 5. Correlation coefficient of evaporation and its effectors in the Golmud meteorological station
累计蒸发 累计降水 平均气压 平均相对湿度 平均气温 平均风速 平均太阳辐射 累计蒸发 1 累计降水 −0.41 1 平均气压 0.08 0.04 1 平均相对湿度 0.01 0.43 −0.06 1 平均气温 −0.81 0.25 0.12 −0.36 1 平均风速 0.75 −0.21 −0.06 0.15 −0.69 1 平均太阳辐射 0.48 −0.42 0.24 −0.34 −0.33 0.25 1 表 6 格尔木气象站蒸发量与气象因子回归分析
Table 6. Regression analyses of evaporation and climatic factors in the Golmud meteorological station
相关系数 标准误差 t统计量 P值 下限 95.0% 上限 95.0% 截距 0.60 0.14 4.44 0.00 0.33 0.88 累计降水 −0.09 0.08 −1.13 0.26 −0.26 0.07 平均气压 0.20 0.08 2.60 0.01 0.04 0.35 平均相对湿度 −0.20 0.08 −2.54 0.01 −0.36 −0.04 平均气温 −0.54 0.08 −6.40 0.00 −0.70 −0.37 平均风速 0.37 0.09 4.00 0.00 0.18 0.56 平均太阳辐射 0.06 0.11 0.55 0.58 −0.16 0.28 表 7 达布逊湖区蒸发、降水及气温每10年平均值
Table 7. Changes of mean values of every 10 years of evaporation, precipitation and temperature in the Dabuxun Lake
时间段 平均蒸发量/mm 平均降水量/mm 平均气温/℃ 1960—1969 / 24.6 5.0 1970—1979 / 24.1 5.1 1980—1989 / 23.9 5.3 1990—1999 1437.5 / 5.7 2000—2009 907.3 / / 2009—2018 1258.5 25.1 6.6 -
[1] LIU X M, LUO Y Z, ZHANG D, et al. Recent changes in pan-evaporation dynamics in China[J]. Geophysical Research Letters,2011,38(13):L13404.
[2] 柳春, 王守荣, 梁有叶, 等. 1961—2010年黄河流域蒸发皿蒸发量变化及影响因子分析[J]. 气候变化研究进展,2013,9(5):327 − 334. [LIU Chun, WANG Shourong, LIANG Youye, et al. Analysis of pan evaporation change and the influence factors in the Yellow River Basin in 1961-2010[J]. Progressus Inquisitiones DE Mutatione Climatis,2013,9(5):327 − 334. (in Chinese with English abstract) doi: 10.3969/j.issn.1673-1719.2013.05.003
[3] 王忠富, 杨礼箫, 白晓, 等. “蒸发悖论”在黑河流域的探讨[J]. 冰川冻土,2015,37(5):1323 − 1332. [WANG Zhongfu, YANG Lixiao, BAI Xiao, et al. Evaporation paradox in the Heihe River basin[J]. Journal of Glaciology and Geocryology,2015,37(5):1323 − 1332. (in Chinese with English abstract)
[4] 黄金廷, 崔旭东, 王冬, 等. 格尔木河流域地下水生态功能及经济损益阈值解析[J]. 干旱区地理,2019,42(2):263 − 270. [HUANG Jinting, CUI Xudong, WANG Dong, et al. Groundwater ecological function and economic profit and loss threshold in Golmud River Catchment[J]. Arid Land Geography,2019,42(2):263 − 270. (in Chinese with English abstract)
[5] XIAO Y, SHAO J L, FRAPE S K, et al. Groundwater origin, flow regime and geochemical evolution in arid endorheic watersheds: a case study from the Qaidam Basin, northwestern China[J]. Hydrology and Earth System Sciences,2018,22(8):4381 − 4400. doi: 10.5194/hess-22-4381-2018
[6] 马日新, 黄金廷, 田华, 等. 格尔木河流域近60 a降水、蒸发及温度变化特征分析[J]. 干旱区地理,2017,40(5):1005 − 1012. [MA Rixin, HUANG Jinting, TIAN Hua, et al. Characteristics of precipitation, evaporation and temperature at the Golmud River Catchment in recent 60 years[J]. Arid Land Geography,2017,40(5):1005 − 1012. (in Chinese with English abstract)
[7] 朱晓倩, 金晓媚, 张绪财, 等. 格尔木河流域山前平原区蒸散量的分布特征[J]. 水文地质工程地质,2019,46(5):55 − 64. [ZHU Xiaoqian, JIN Xiaomei, ZHANG Xucai, et al. Distribution characteristics of evapotranspiration in the valley piedmont plain of the Golmud River Basin[J]. Hydrogeology & Engineering Geology,2019,46(5):55 − 64. (in Chinese with English abstract)
[8] 杨笑天. 基于SEBS模型的格尔木河流域地表蒸散量遥感反演及其时空格局分析[D].西安: 长安大学, 2017.
YANG Xiaotian. Evapotranspiration estimating using remote sensing and spatial-temporal distribution of evapotranspiration in Golmud River basin based on SEBS model[D]. Xi’an: Changan University, 2017. (in Chinese with English abstract)
[9] 邓红章. 基于MODIS的格尔木地区蒸散量研究[D]. 西安: 长安大学, 2010.
DENG Hongzhang. Study on evapotranspiration in Golmud region based on modis[D]. Xi’an: Changan University, 2010. (in Chinese with English abstract)
[10] 王晓雪. 青海达布逊湖面积变化及湖泊蒸发量的计算[D]. 北京: 中国地质大学(北京), 2019.
WANG Xiaoxue. Area change and the evaporation estimation of Dabson Lake in Qinghai province[D]. Beijing: China University of Geosciences (Beijing), 2019. (in Chinese with English abstract)
[11] 李健, 王辉, 黄勇, 等. 柴达木盆地格尔木河流域生态需水量初步估算探讨[J]. 水文地质工程地质,2008,35(1):71 − 75. [LI Jian, WANG Hui, HUANG Yong, et al. Preliminary estimation on ecological consumption of water of Gelmud River in Chaidamu Basin[J]. Hydrogeology & Engineering Geology,2008,35(1):71 − 75. (in Chinese with English abstract) doi: 10.3969/j.issn.1000-3665.2008.01.016
[12] 张娟, 宋昌斌, 屈小荣, 等. 察尔汗盐湖矿区气象因素变化规律分析[J]. 化工矿物与加工,2020,49(5):48 − 50. [ZHANG Juan, SONG Changbin, QU Xiaorong, et al. Analysis on change rule of meteorological factors in Qarhan Salt Lake area[J]. Industrial Minerals & Processing,2020,49(5):48 − 50. (in Chinese with English abstract)
[13] 中国气象局气候变化中心. 中国气候变化蓝皮书(2020)[M]. 北京: 科学出版社, 2020.
Climate Change Center of China Meteorological Administration. Blue book on climate change in China (2020)[R]. Beijing: Science Press, 2020. (in Chinese)
[14] BRUTSAERT W, PARLANGE M B. Hydrological cycle explain the evaporation paradox[J]. Nature,1998,396:30 − 31. doi: 10.1038/23845
[15] RODERICK M L, ROTSTAYN L D, FARQUHAR G D, et al. On the attribution of changing pan evaporation[J]. Geophysical Research Letters,2007,34(17):L17403. doi: 10.1029/2007GL031166
-


 下载:
下载:


