

Geological hazard susceptibility evaluation in Wenchuan area based on three models of multivariate instability index analysis
-
摘要:
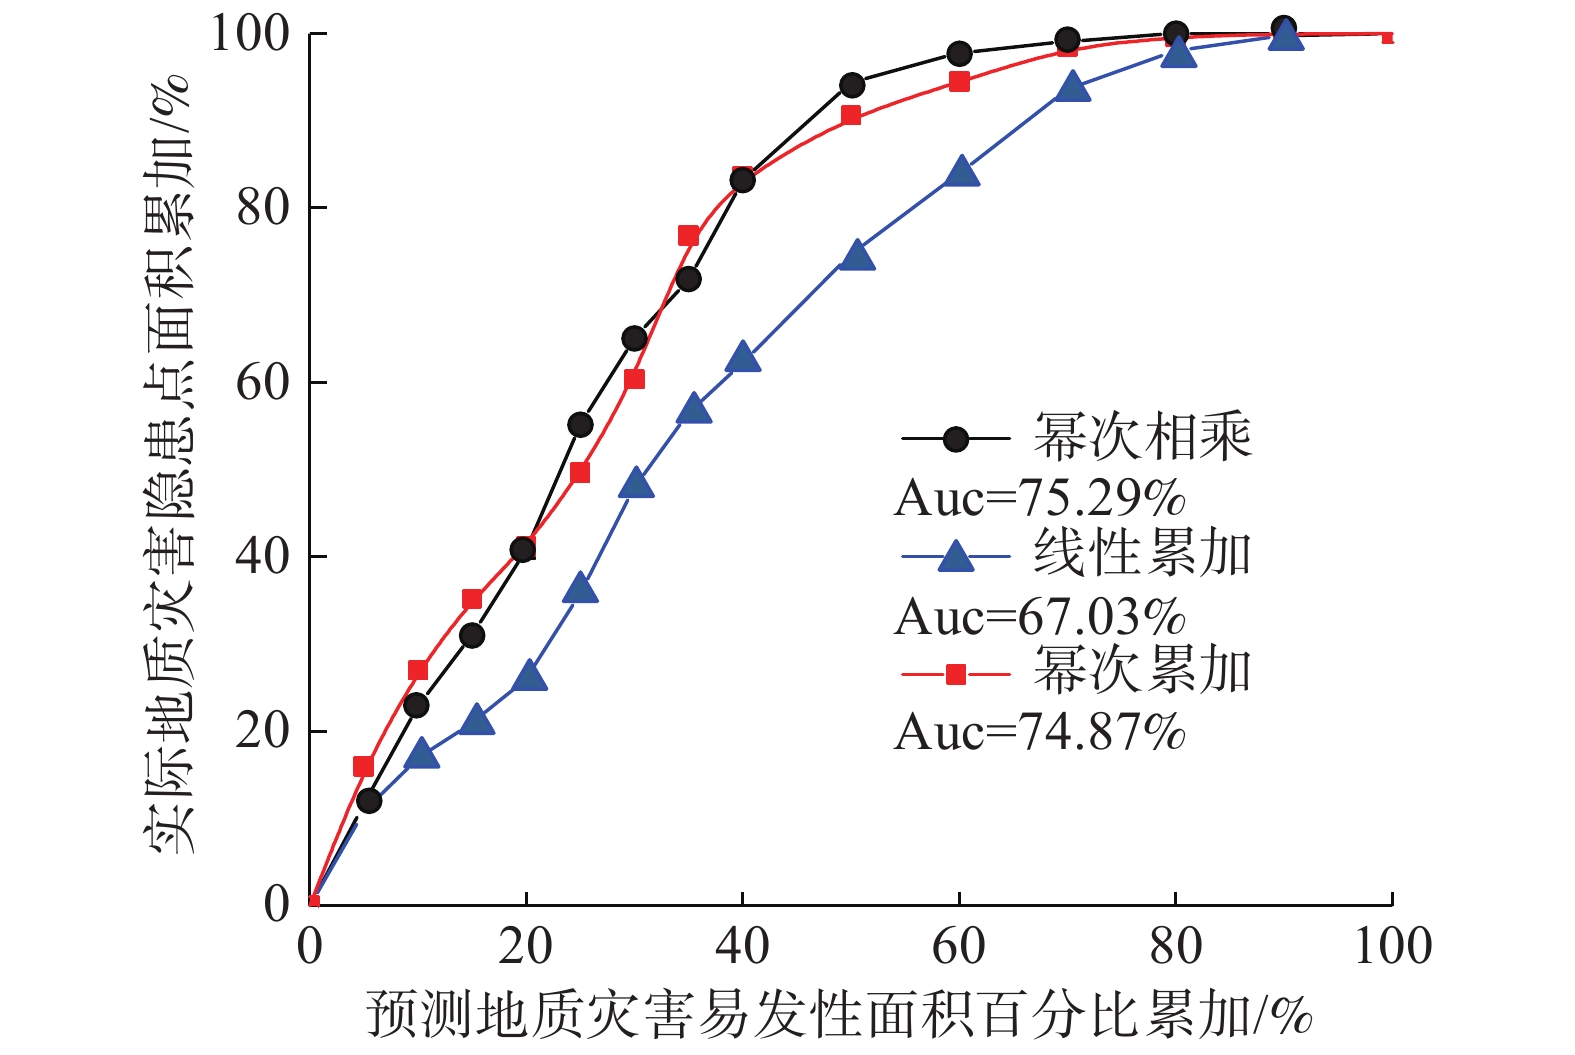
采用多变量不安定指数分析法模型并加以改进,应用于汶川县地质灾害易发性评价。选取坡度、坡向、地层岩性、距断层距离、植被覆盖率及距水系距离六项影响因子,结合四川省自然资源厅发布的汶川县地质灾害隐患点数据,以幂次相乘、线性累加、幂次累加这三种不同的不安定指数分析法模型分别得到了研究区地质灾害易发性分区图,并用接受者操作特性曲线(Receiver Operating Characteristic curve, ROC curve)验证了各种模型的评价性能。结果表明:(1)对本案例而言,幂次相乘模型相较其它两种模型具有最高的精度;(2)汶川县地质灾害“极高”“高”“中”“低”“极低”易发区的面积占比分别为:19.3%、24.6%、19.2%、19.3%、17.6%,且研究区地质灾害易发性较高的区域多分布在断裂带附近。本研究成果可为区域地质灾害防治工作提供理论借鉴和技术参考。
-
关键词:
- GIS /
- 地质灾害易发性 /
- 汶川 /
- 多变量不安定指数分析法
Abstract:A derived model of multivariate instability index analysis method was proposed to evaluate the susceptibility of geological disasters in Wenchuan County. Based on the data of potential geological hazards in Wenchuan County released by Sichuan Provincial Department of Natural Resources, six influencing factors including slope, aspect, stratum lithology, distance from fault, vegetation coverage and distance from water system are involved. Three different methods of multivariate instability index analysis, namely power multiplication, linear accumulation and power accumulation, are used to obtain the geological disaster susceptibility zoning map of the study area Receiver Operating Characteristic (ROC) curve verifies the evaluation performance of various models. The results show that: (1) for this case, the power multiplication model has the highest accuracy compared with the other two models; (2) the percentages of area with different susceptibility levels, i.e. very high, high, moderate, low, and very low, are 19.3%, 24.6%, 19.2%, 19.3%, 17.6% respectively, moreover, the higher level of susceptibility, the closer to the fault zones. This research provides theoretical and technical reference for the prevention and mitigation of regional geological disasters.
-

-
表 1 坡度评分值
Table 1. Grading of slope
坡度/(°) 出现地质灾害点的栅格数量 占总数比率/% 最大/% 最小/% 评分值 0~14.6 8445 18.9 19.2 0.7 9.8 14.6~23.6 8576 19.2 10 23.6~30.9 7977 17.8 9.3 30.9~37.2 7096 15.8 8.3 37.2~43.4 6071 13.5 7.2 43.4~50.4 4266 9.5 5.3 50.4~60.1 2057 4.6 2.9 60.1~88.6 311 0.7 1 合计 44795 100 — — —  下载: 导出CSV
表 2 坡向评分值
Table 2. Grading of slope aspect
坡向 出现地质灾害点的栅格数量 占总数比率/% 最大/% 最小/% 评分值 北 5286 11.8 16.9 10.3 3.0 东北 4592 10.3 1 东 5299 11.8 3.0 东南 6867 15.3 7.8 南 4667 10.4 1.1 西南 5041 11.3 2.4 西 5480 12.2 3.6 西北 7563 16.9 10 合计 44795 100 — — —
下载: 导出CSV
表 3 地层岩性评分值
Table 3. Score value of stratum lithology
地层岩性 出现地质灾害点
的栅格数量占总数比率
/%最大/% 最小/% 评分值 震旦系砂岩、白云岩 1971 4.4 64.2 0 1.6 志留系板岩、千枚岩 4838 10.8 2.5 泥盆系石灰岩 7033 15.7 3.2 石炭系灰岩 0 0 1 二叠系闪长岩 28758 64.2 10 三叠系砂岩、千枚岩 1971 4.4 1.6 侏罗系砂岩 224 0.5 1.1 合计 44795 100 — — —
下载: 导出CSV
表 4 植被覆盖率评分值
Table 4. Score value of vegetation coverage
植被归一化指数 出现地质灾害点
的栅格数量占总数比率
/%最大/% 最小/% 评分值 −0.16~0.03 224 0.5 51.4 0.5 1 0.03~0.11 4883 10.9 2.8 0.11~0.25 23025 51.4 10 0.25~0.39 16171 36.1 7.3 0.39~0.53 493 1.1 1.1 合计 44795 100 — — —
下载: 导出CSV
表 5 距断裂带距离评分值
Table 5. Score value of distance from fault zone
距断裂带距离/km 出现地质灾害点
的栅格数量占总数比率/% 最大/% 最小/% 评分值 0~5 36374 81.2 81.2 0 10 5~10 7346 16.4 2.8 10~15 1030 2.3 1.3 15~20 45 0.1 1 >20 0 0 1 合计 44795 100 — — —
下载: 导出CSV
表 6 距水系距离评分值
Table 6. Score value of distance from water system
距水系距离/m 出现地质灾害点
的栅格数量占总数比率/% 最大/% 最小/% 评分值 0~200 16977 37.9 37.9 7.1 10 200~600 15499 34.6 9 600~1200 9138 20.4 4.9 >1200 3181 7.1 1 合计 44795 100 — — —
下载: 导出CSV
表 7 各致灾因子变异系数
Table 7. Variation coefficient of disaster-inducing factor
致灾因子 各因子分级破坏率平均值 标准差 变异系数 坡度 0.125 0.065 52 坡向 0.125 0.022 17.6 地层岩性 0.143 0.210 147.19 植被覆盖率 0.2 0.203 101.62 距断裂带距离 0.2 0.312 156 距水系距离 0.25 0.122 49
下载: 导出CSV
表 8 各致灾因子权重值
Table 8. Weight value of disaster-inducing factors
排名 致灾因子 变异系数 权重值 1 距断裂带距离 156 0.298 2 地层岩性 147.19 0.281 3 植被覆盖率 101.62 0.194 4 坡度 52 0.099 5 距水系距离 49 0.094 6 坡向 17.6 0.034 合计 — — 1
下载: 导出CSV
-
[1] 薛凯喜, 李炀, 多会会, 等. 地质灾害及其防治的公众认知现状探析[J]. 中国地质灾害与防治学报,2019,30(5):113 − 121. [XUE Kaixi, LI Yang, DUO Huihui, et al. Analysis on the current situation of public perception of geological hazard and its prevention and control[J]. The Chinese Journal of Geological Hazard and Control,2019,30(5):113 − 121. (in Chinese with English abstract)
[2] 黄润秋, 李为乐. “5·12”汶川大地震触发地质灾害的发育分布规律研究[J]. 岩石力学与工程学报,2008,27(12):2585 − 2592. [HUANG Runqiu, LI Weile. Research on development and distribution rules of geohazards induced by Wenchuan earthquake on 12th May, 2008[J]. Chinese Journal of Rock Mechanics and Engineering,2008,27(12):2585 − 2592. (in Chinese with English abstract) doi: 10.3321/j.issn:1000-6915.2008.12.028
[3] 崔鹏, 庄建琦, 陈兴长, 等. 汶川地震区震后泥石流活动特征与防治对策[J]. 四川大学学报(工程科学版),2010,42(5):10 − 19. [CUI Peng, ZHUANG Jianqi, CHEN Xingchang, et al. Characteristics and countermeasures of debris flow in Wenchuan area after the earthquake[J]. Journal of Sichuan University (Engineering Science Edition),2010,42(5):10 − 19. (in Chinese with English abstract)
[4] CHEN M, TANG C, XIONG J, et al. The long-term evolution of landslide activity near the epicentral area of the 2008 Wenchuan earthquake in China[J]. Geomorphology,2020,367:107317. doi: 10.1016/j.geomorph.2020.107317
[5] 高会会, 裴向军, 崔圣华, 等. 汶川震区震后地质灾害发育分布及演化特征统计分析[J]. 长江科学院院报,2019,36(8):73 − 80. [GAO Huihui, PEI Xiangjun, CUI Shenghua, et al. Geological hazards after earthquake in Wenchuan earthquake area: Distribution and evolvement features[J]. Journal of Yangtze River Scientific Research Institute,2019,36(8):73 − 80. (in Chinese with English abstract) doi: 10.11988/ckyyb.20180109
[6] 王钧, 宇岩, 欧国强, 等. 岷江上游汶川地震重灾区山洪灾害危险分区研究[J]. 长江科学院院报,2017,34(1):54 − 60. [WANG Jun, YU Yan, OU Guoqiang, et al. Flash flood risk zoning of areas hit by Wenchuan earthquake in the upper reach of Minjiang river[J]. Journal of Yangtze River Scientific Research Institute,2017,34(1):54 − 60. (in Chinese with English abstract) doi: 10.11988/ckyyb.20150956
[7] 温铭生, 刘传正, 刘艳辉, 等. 汶川地震高烈度区崩滑流灾害区域预警[J]. 中国地质灾害与防治学报,2019,30(1):10 − 19. [WEN Mingsheng, LIU Chuanzheng, LIU Yanhui, et al. Regional warning of geological hazards in high seismic intensity area of Wenchuan Earthquake[J]. The Chinese Journal of Geological Hazard and Control,2019,30(1):10 − 19. (in Chinese with English abstract)
[8] 简李滨. 应用地理资讯系统建立坡地安定评估之计量方法[D]. 台中: 中兴大学, 1992
JIAN Libin. Establishment of measurement method for slope stability assessment using GIS. [D]. Taizhong: Zhongxing University, 1992. (in Chinese)
[9] 许冲, 戴福初, 姚鑫, 等. GIS支持下基于层次分析法的汶川地震区滑坡易发性评价[J]. 岩石力学与工程学报,2009,28(增刊 2):3978 − 3985. [XU Chong, DAI Fuchu, YAO Xin, et al. Gis-based landslide susceptibility assessment using analytical hierarchy process in Wenchuan earthquake region[J]. Chinese Journal of Rock Mechanics and Engineering,2009,28(Sup 2):3978 − 3985. (in Chinese with English abstract)
[10] 孟祥瑞, 裴向军, 刘清华, 等. GIS支持下基于因子分析法的都汶路沿线地质灾害易发性评价[J]. 中国地质灾害与防治学报,2016,27(3):106 − 115. [MENG Xiangrui, PEI Xiangjun, LIU Qinghua, et al. GIS-Based susceptibility assessment of geological hazards along the road from Dujiangyan to Wenchuan by factor analysis[J]. The Chinese Journal of Geological Hazard and Control,2016,27(3):106 − 115. (in Chinese with English abstract)
[11] 林虹宇, 丁明涛, 佘涛, 等. 岷江上游典型泥石流活动特征及其易发性评价[J]. 中国地质灾害与防治学报,2017,28(4):6 − 15. [LIN Hongyu, DING Mingtao, SHE Tao, et al. Characteristic analysis and susceptibility assessment of the typical debris flow in the upper reaches of Min River[J]. The Chinese Journal of Geological Hazard and Control,2017,28(4):6 − 15. (in Chinese with English abstract)
[12] 胡宝荣. 基于遥感与GIS技术的汶川县地震前后生态环境质量评价[D]. 成都: 成都理工大学, 2009
HU Baorong. Evaluation on the ecological environments before and after 5.12 Wenchuan earthquake by remote sensing and GIS[D]. Chengdu: Chengdu University of Technology, 2009. (in Chinese with English abstract)
[13] 程思, 易加强. 四川省汶川县地质灾害的成因及防治对策[J]. 地质灾害与环境保护,2007,18(4):1 − 6. [CHENG Si, YI Jiaqiang. Geological hazards and their preventions in Wenchuan County, Sichuan Province[J]. Journal of Geological Hazards and Environment Preservation,2007,18(4):1 − 6. (in Chinese with English abstract) doi: 10.3969/j.issn.1006-4362.2007.04.001
[14] 李明威, 唐川, 陈明, 等. 汶川震区北川县泥石流流域崩滑体时空演变特征[J]. 水文地质工程地质,2020,47(3):182 − 190. [LI Mingwei, TANG Chuan, CHEN Ming, et al. Spatio-temporal evolution characteristics of landslides in debris flow catchment in Beichuan County in the Wenchuan earthquake zone[J]. Hydrogeology & Engineering Geology,2020,47(3):182 − 190. (in Chinese with English abstract)
[15] 邱海军, 曹明明, 刘闻, 等. 基于三种不同模型的区域滑坡灾害敏感性评价及结果检验研究[J]. 地理科学,2014,34(1):110 − 115. [QIU Haijun, CAO Mingming, LIU Wen, et al. The susceptibility assessment of landslide and its calibration of the models based on three different models[J]. Scientia Geographica Sinica,2014,34(1):110 − 115. (in Chinese with English abstract)
[16] HOYER A, KUSS O. Meta-analysis of full ROC curves with flexible parametric distributions of diagnostic test values[J]. Research Synthesis Methods,2020,11(2):301 − 313. doi: 10.1002/jrsm.1395
[17] WALKER S P. The ROC curve redefined - optimizing sensitivity (and specificity) to the lived reality of cancer[J]. The New England Journal of Medicine,2019,380(17):1594 − 1595. doi: 10.1056/NEJMp1814951
[18] OMAR L, IVRISSIMTZIS I. Using theoretical ROC curves for analysing machine learning binary classifiers[J]. Pattern Recognition Letters,2019,128:447 − 451. doi: 10.1016/j.patrec.2019.10.004
-


图(5)
表(8)
计量
- 文章访问数: 1011
- PDF下载数: 11
- 施引文献: 0