

Dynamic threshold analysis method of early warning and forecast based on real-time geo-hazards monitoring data
-
摘要:
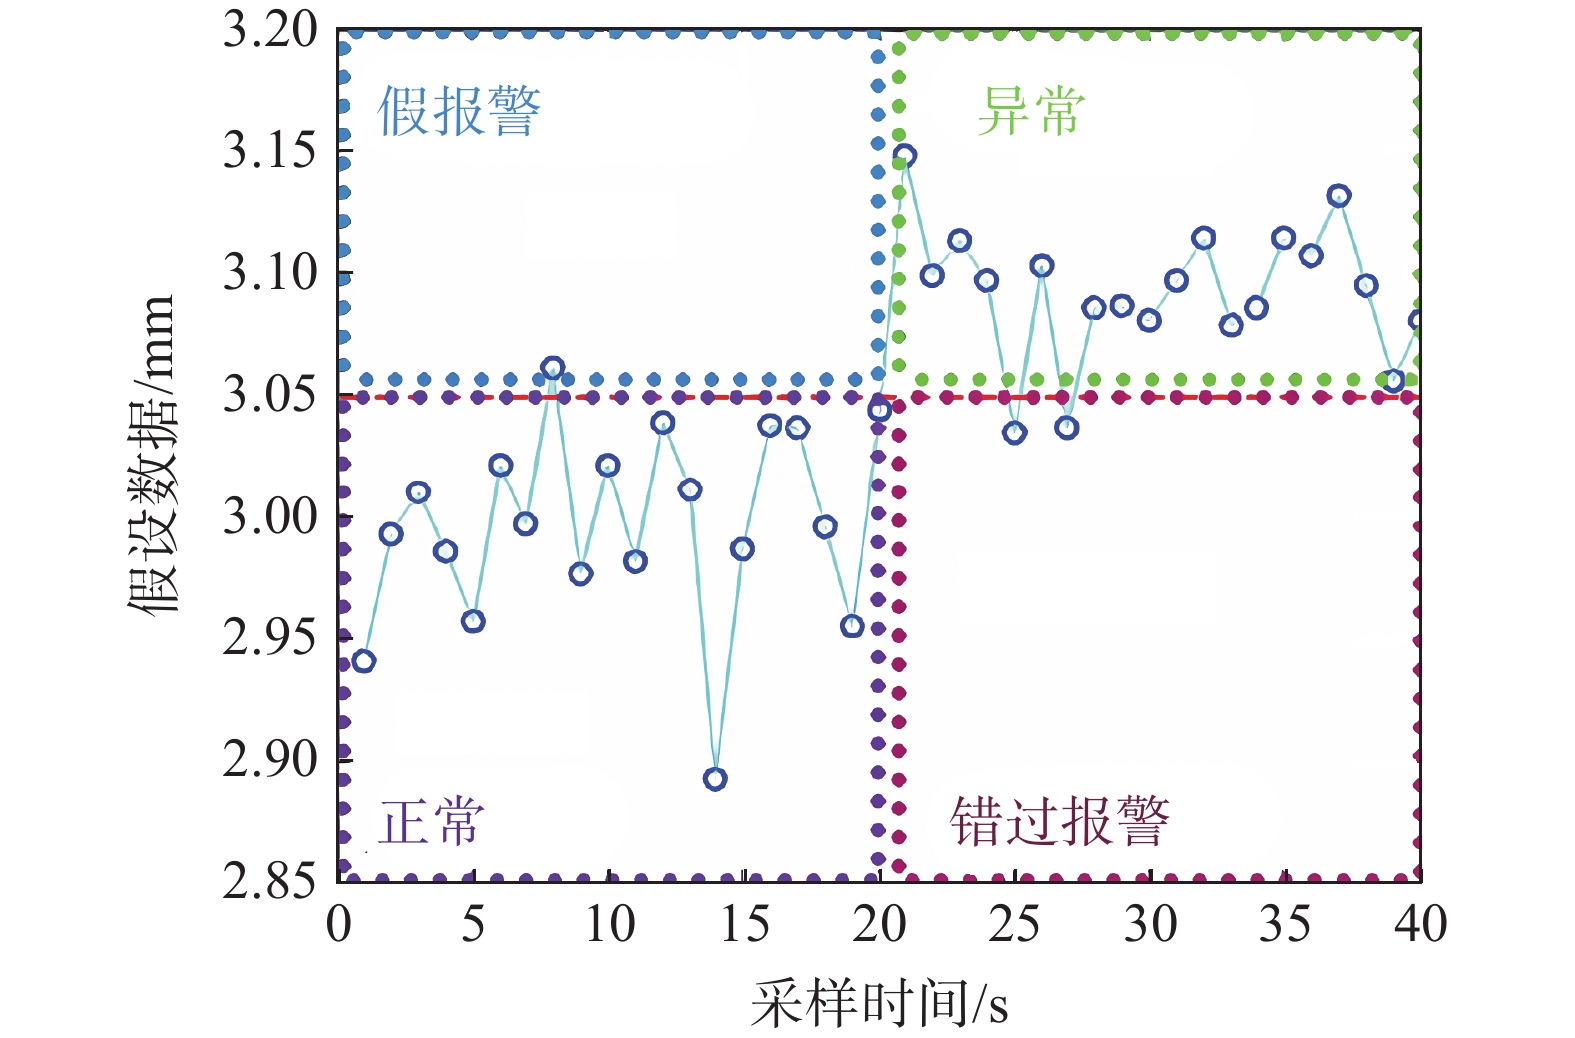
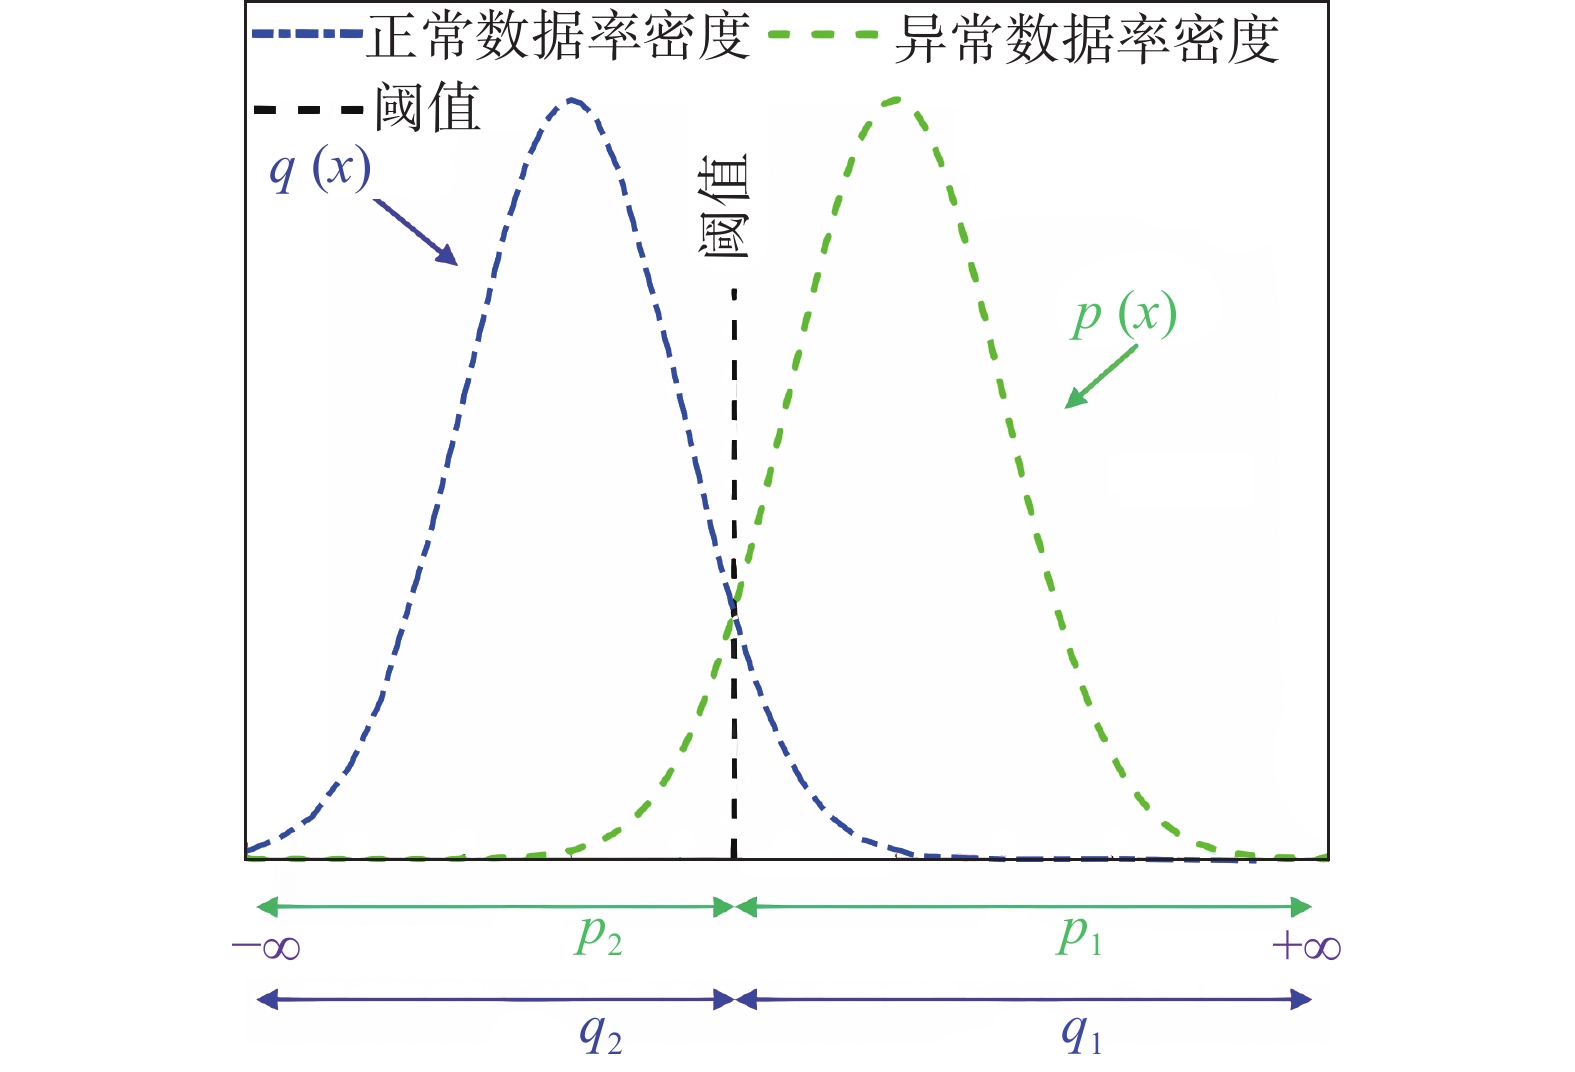
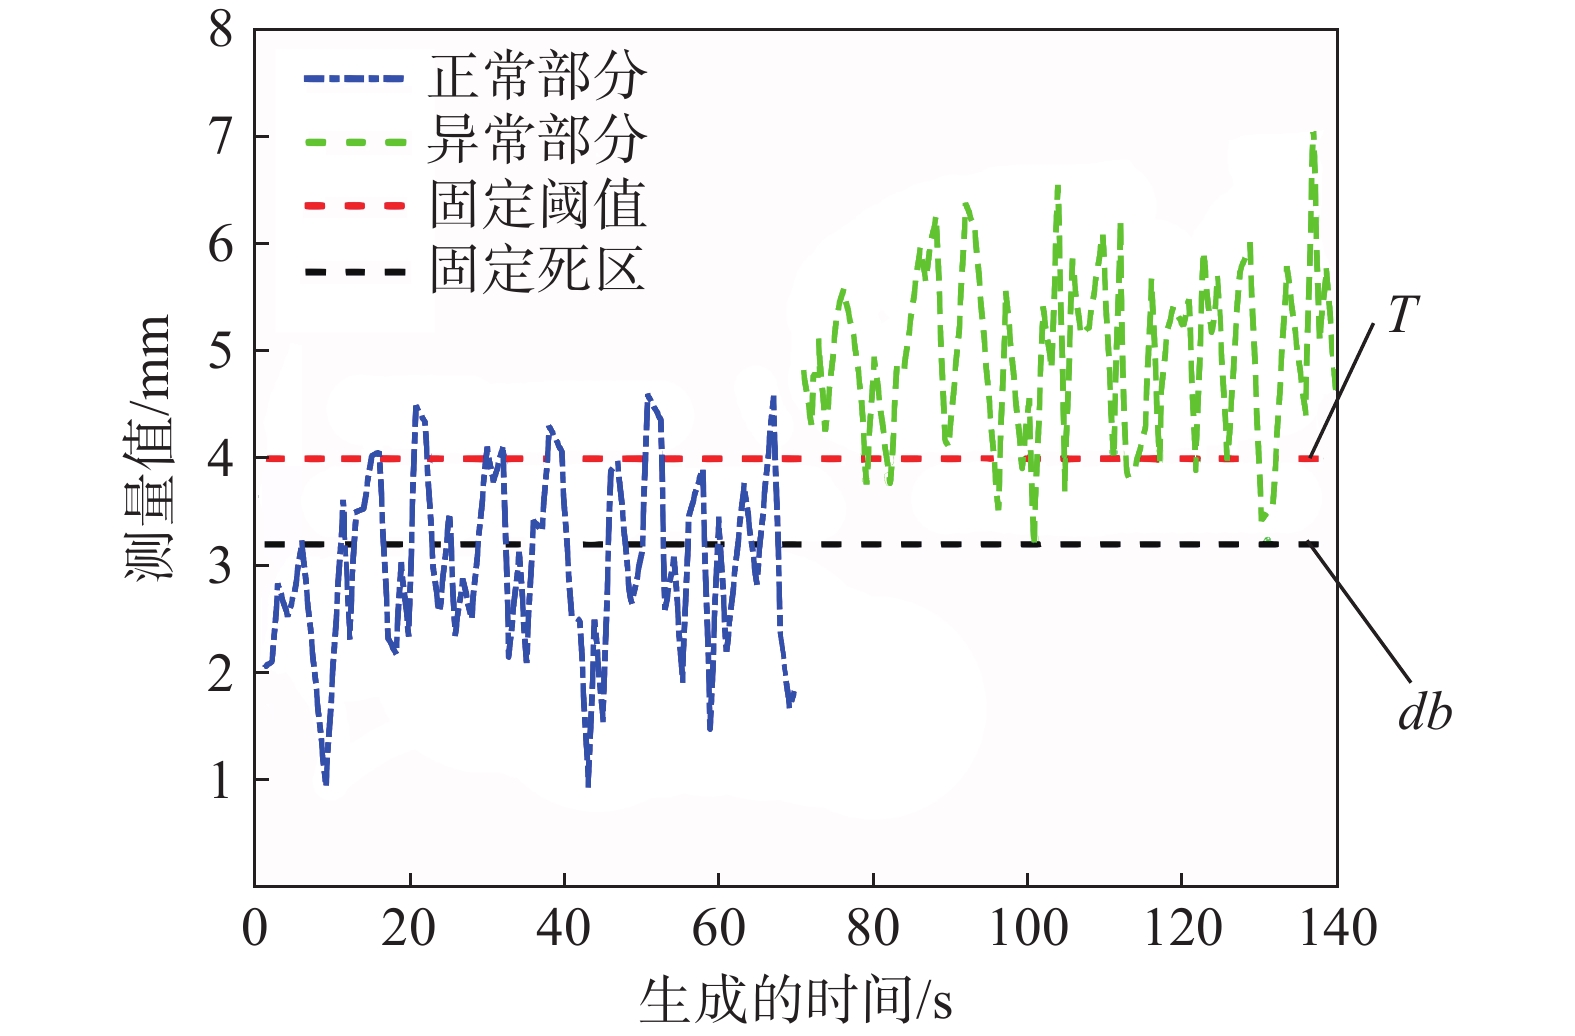
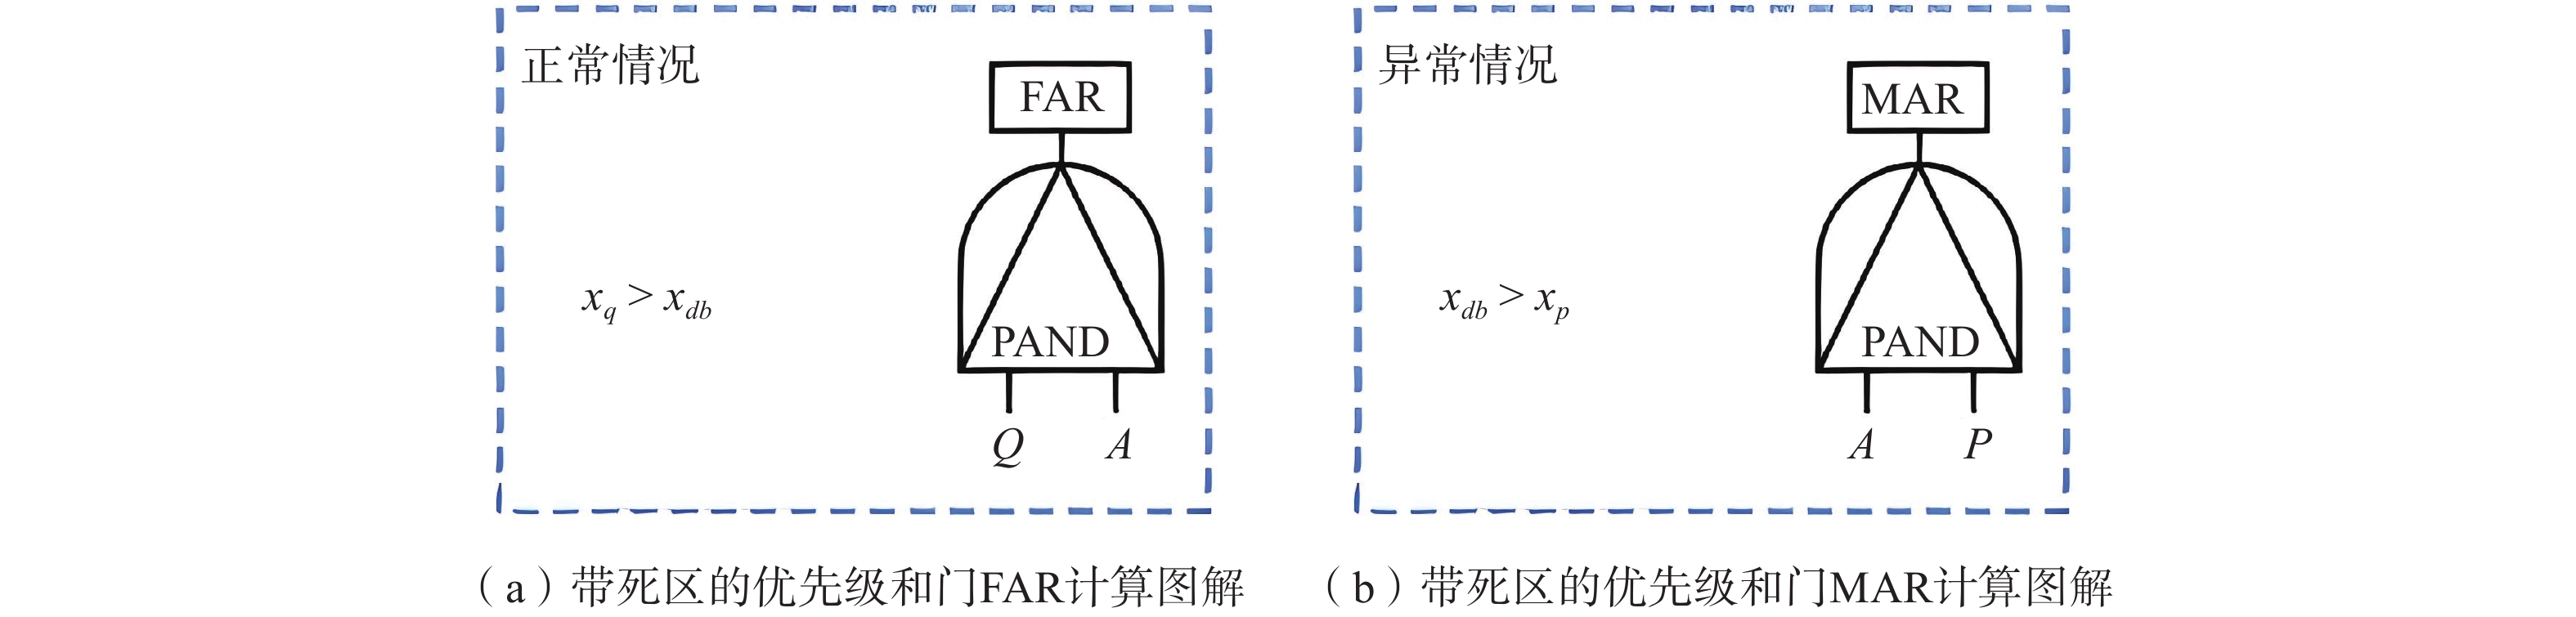
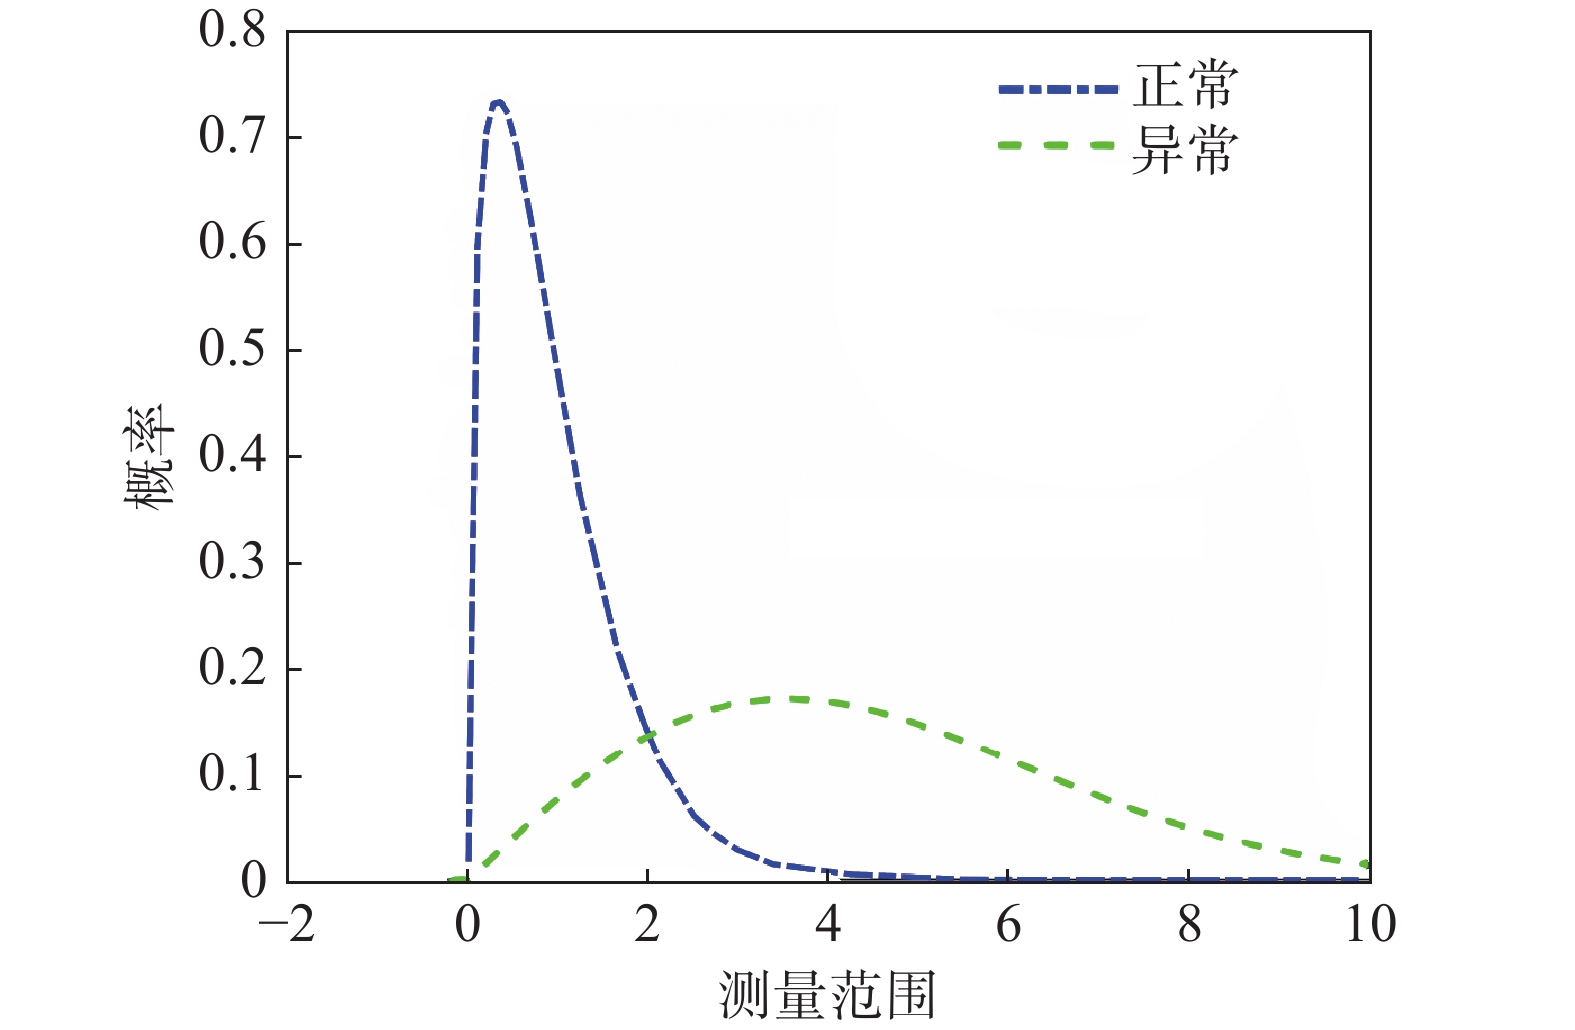
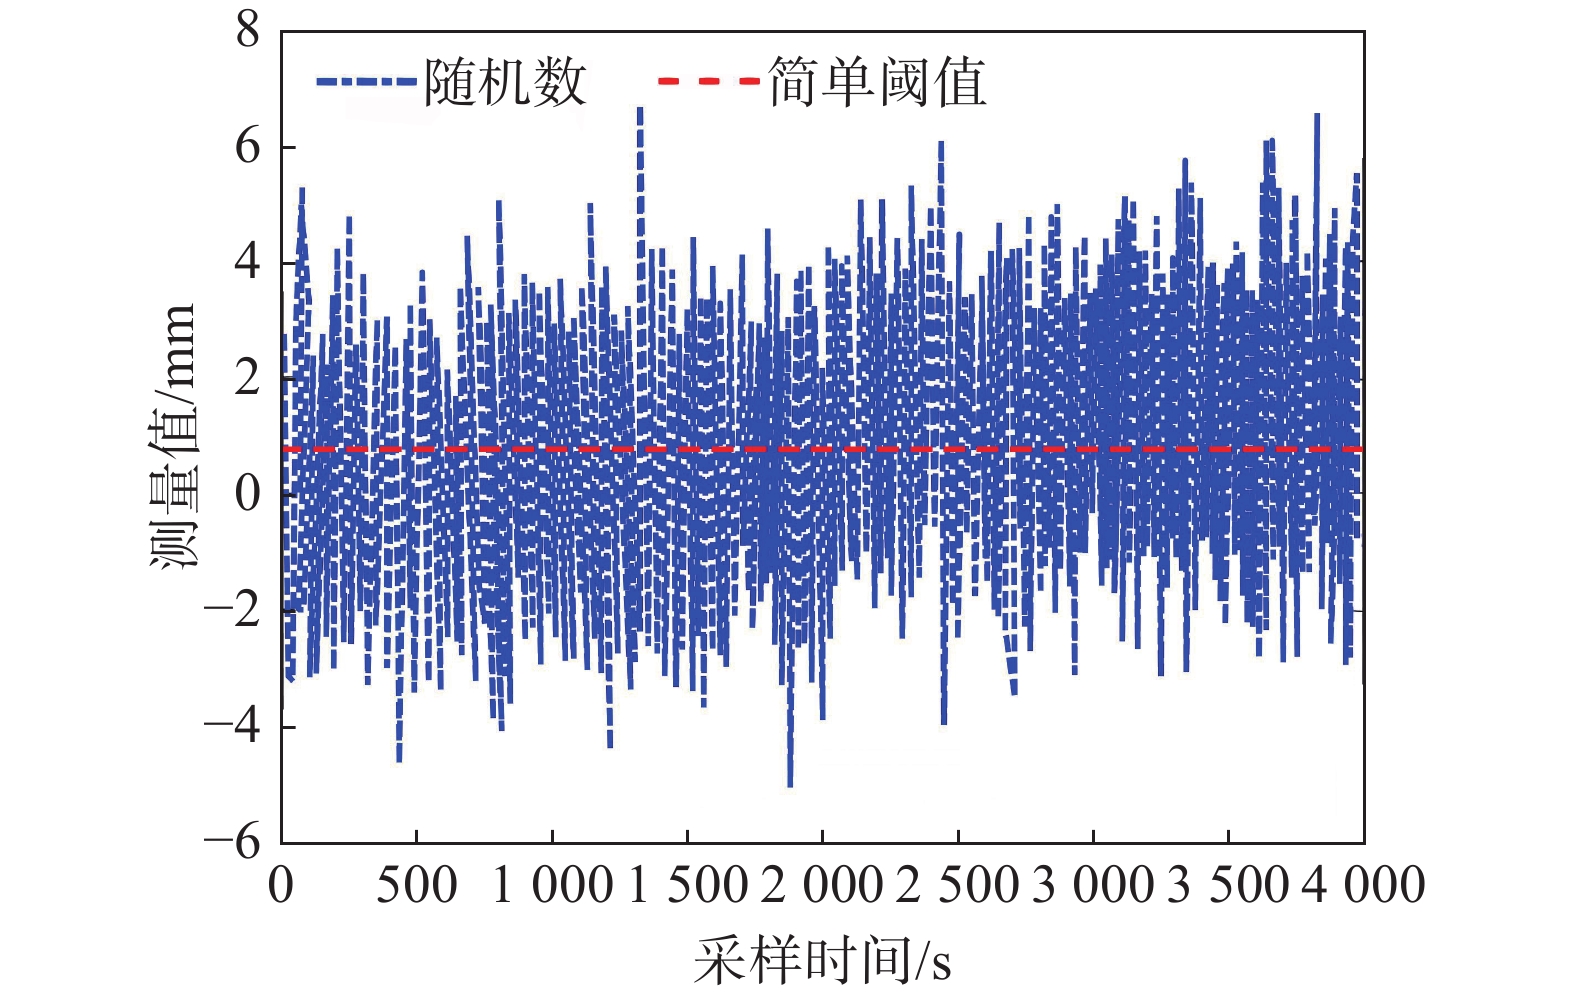
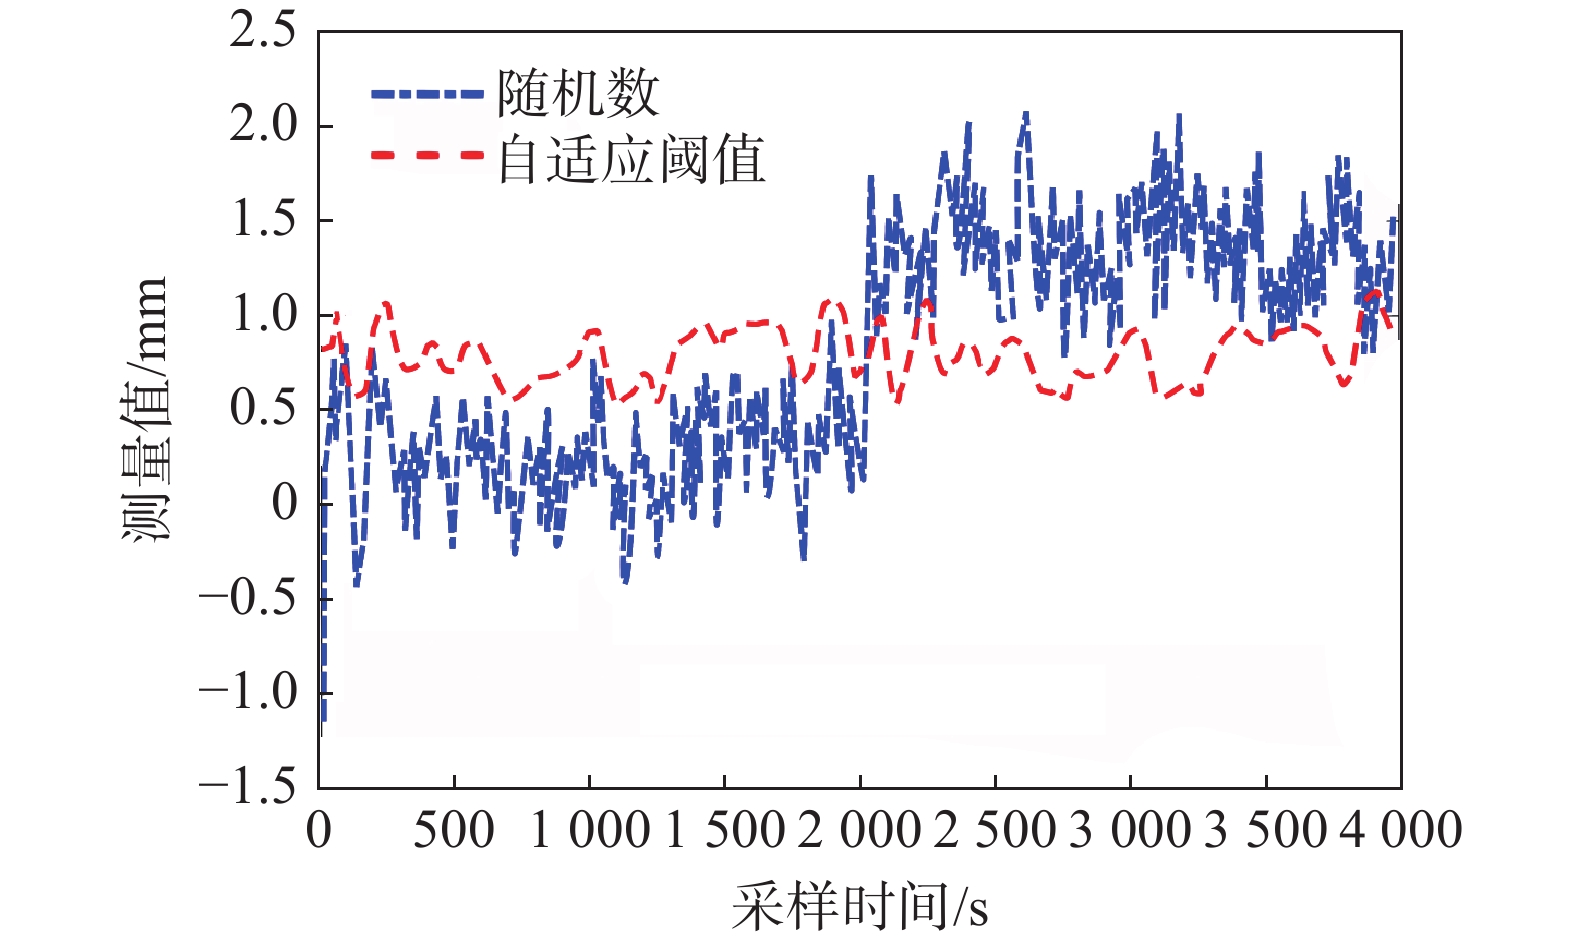
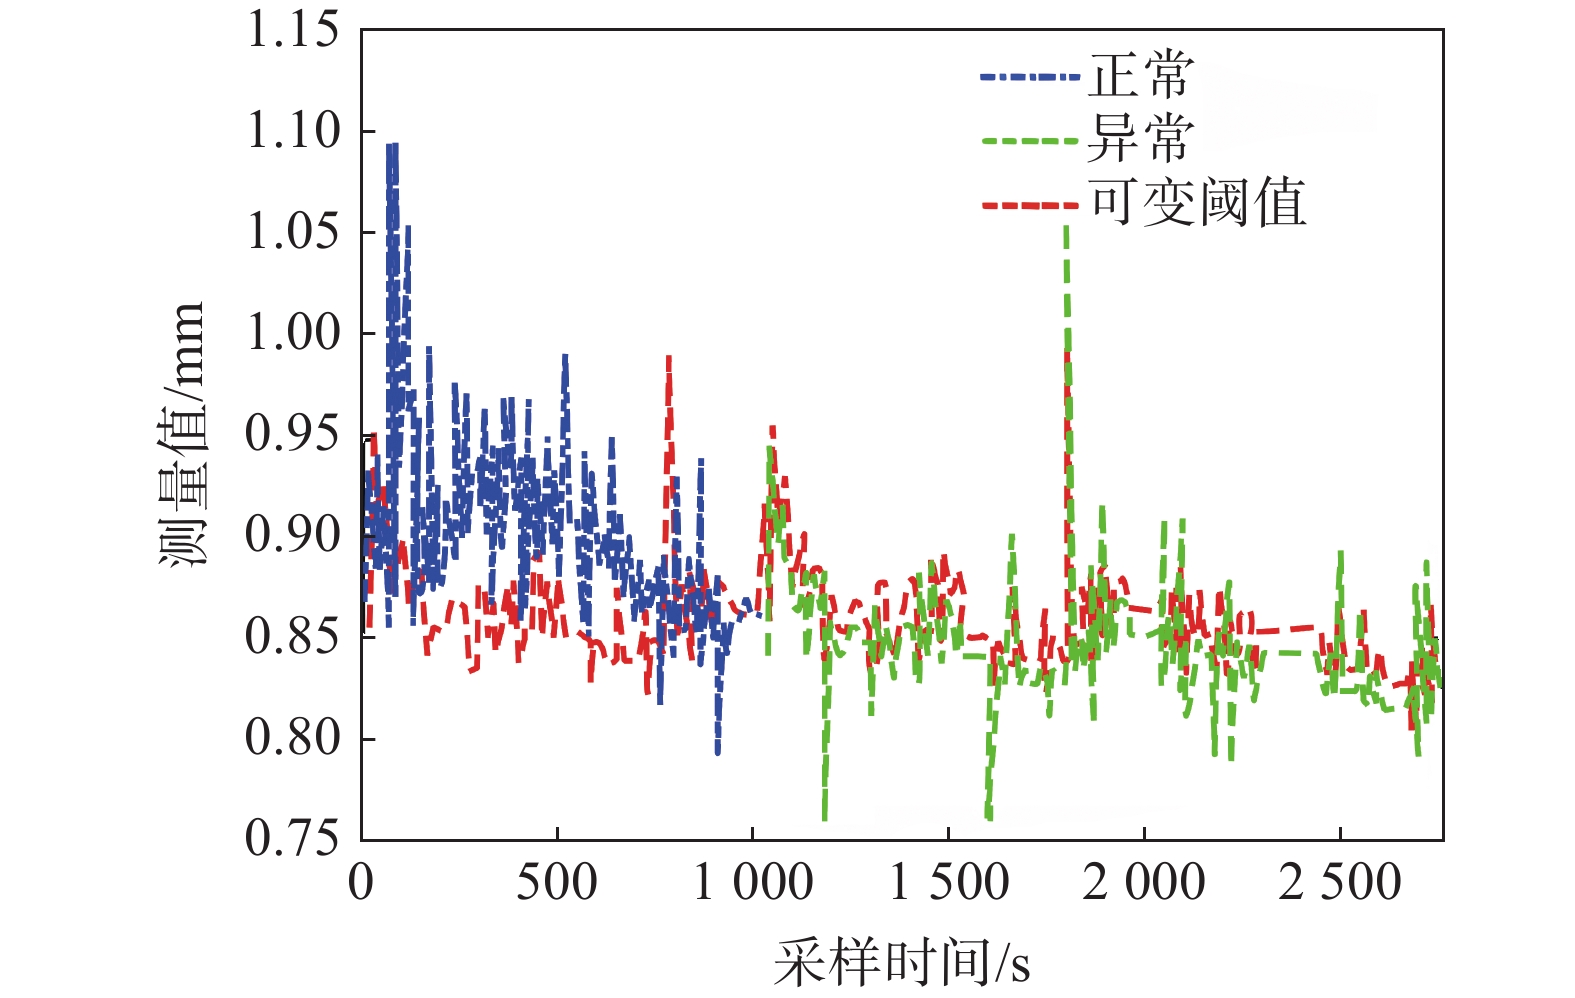
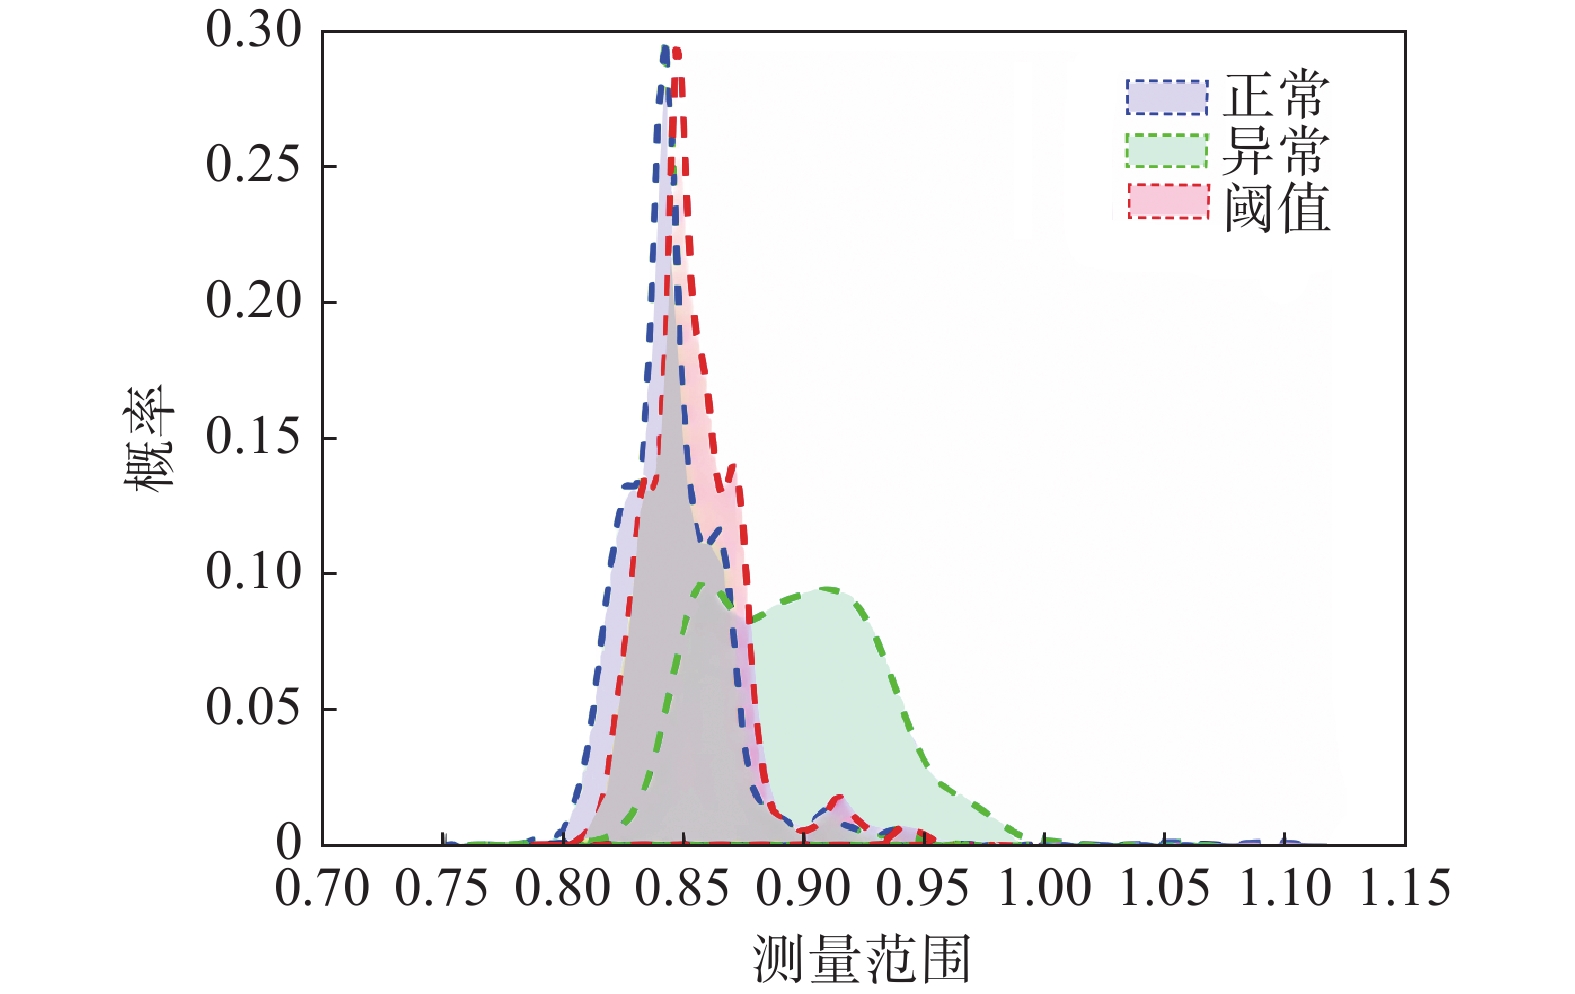
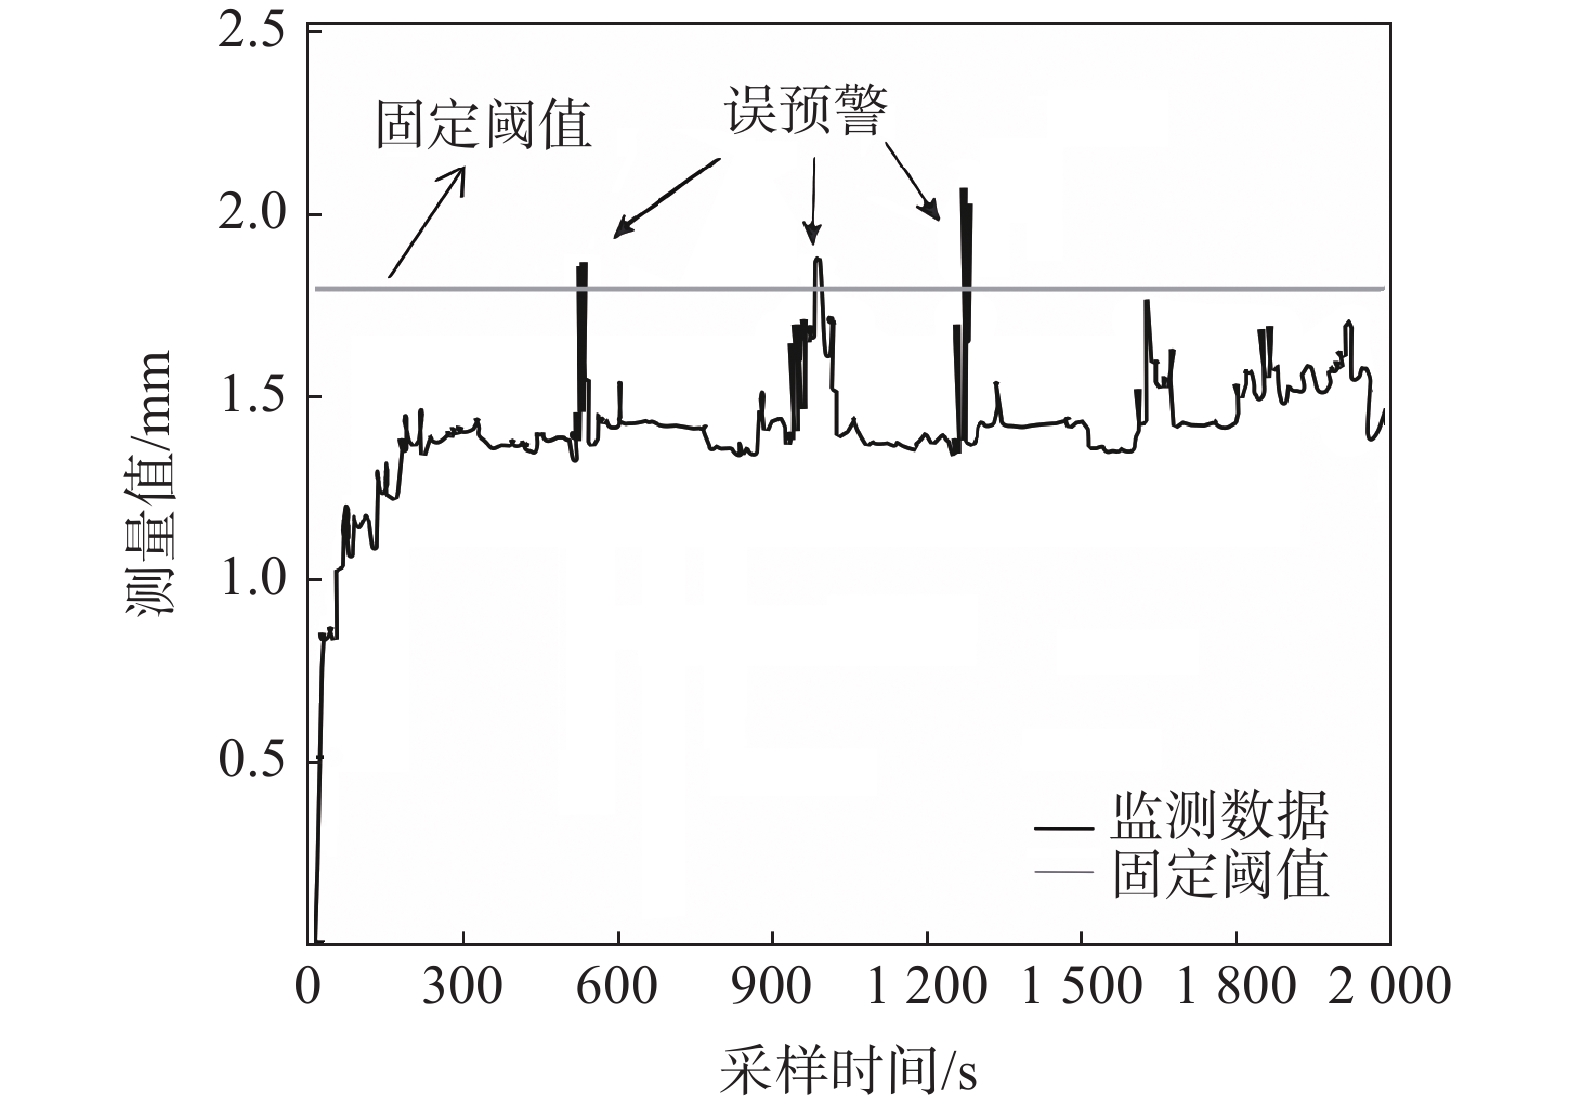
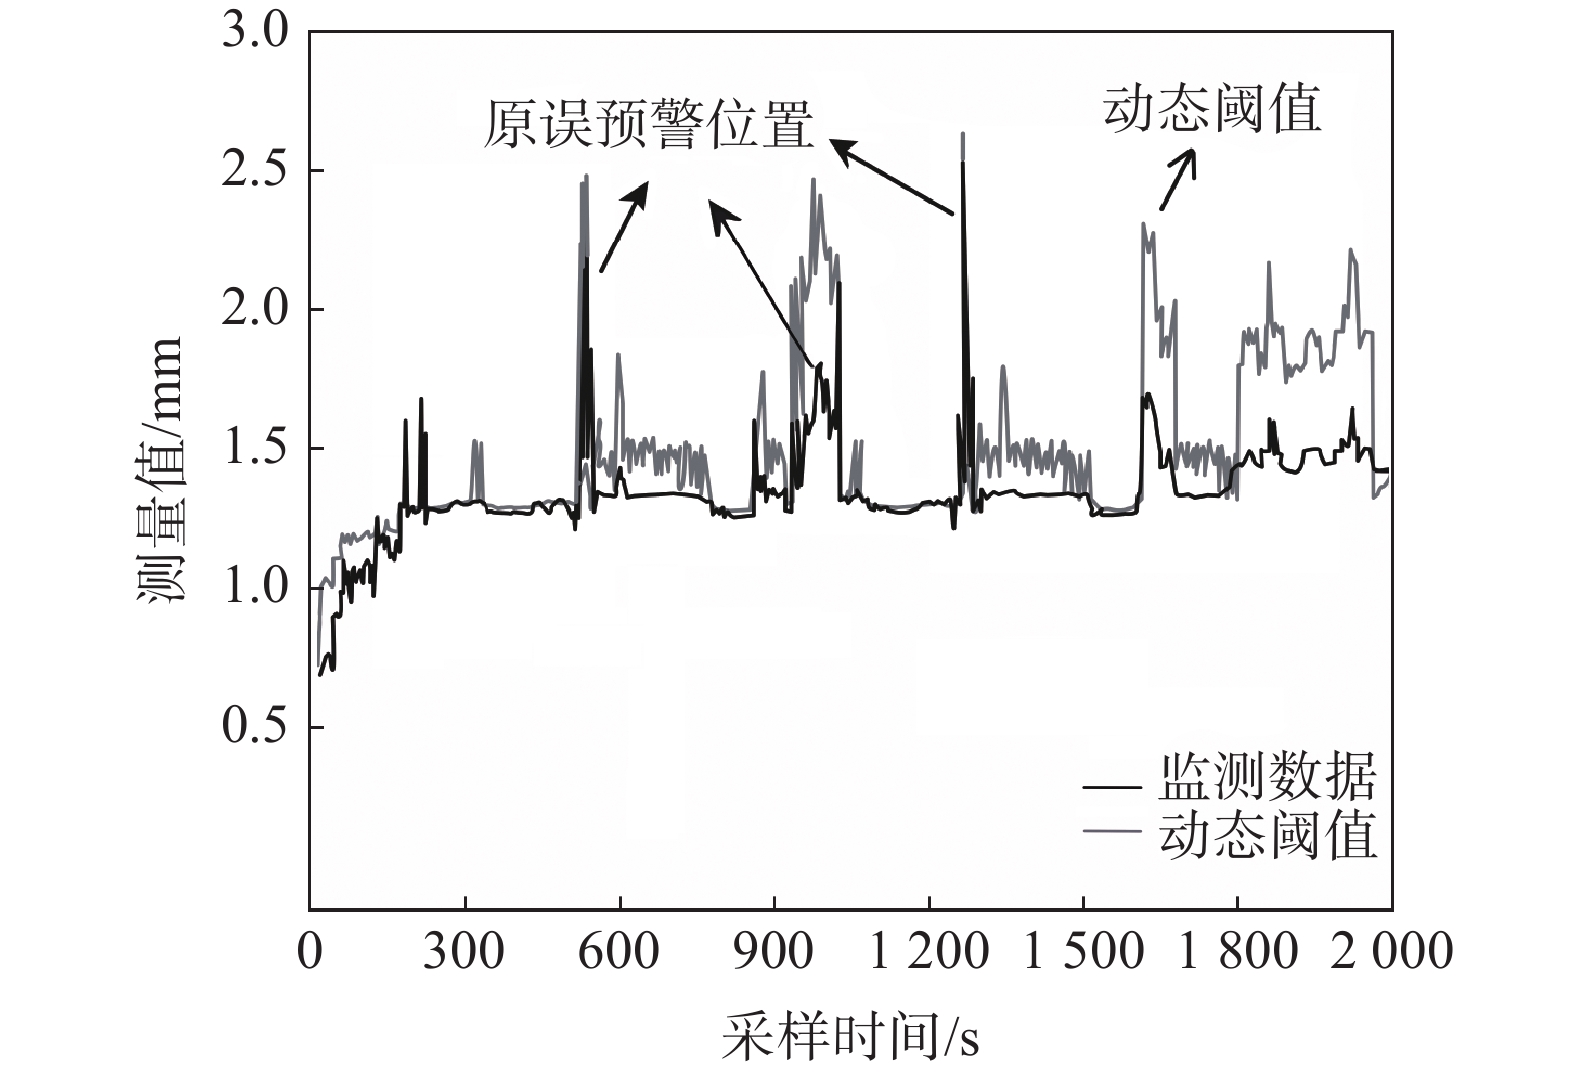
目前在地质灾害监测领域,监测预警信息的发布主要基于各类监测设备的阈值设定。阈值是根据经验或专家估计设定,不仅对地质灾害不同类型、不同环境缺乏针对性,而且设定后较长时间不变,或根据经验略微浮动,缺少数据样本分析的科学性。另外监测设备容易受到卫星信号等环境因素影响,因此在实际运行中可能会出现误报、漏报的情况。为了解决上述问题,文中提出了一种预警阈值自学习自修正从而进行动态调整的方法,引入了两种可变阈值,并提出了一种基于优先级和门以及半马尔可夫过程 VTAS的性能指标优化新方法。半马尔可夫过程的应用使该方法能够考虑具有非高斯分布的工业测量。此外,文中还提出了一种基于遗传算法的优化设计过程,用于优化参数设置,提高性能指标。通过数值仿真以及与以往研究的比较,说明了该方法的有效性。将该方法在实测点位上进行应用,根据结果可知,相比于使用固定阈值,该方法能有效地减少系统误报、漏报,提高地质灾害预警的准确性,从而更好地保护人民生命财产安全。
Abstract:Currently, in the field of geological disaster monitoring, monitoring and early warning information is mainly released based on the threshold setting of various types of monitoring equipment. However, since the thresholds are established according to empirical values or expert evaluations, there is a lack of pertinence to different types of geological disasters and different environments. Once set, these thresholds remain unchanged for a long time, and even when adjusted, they only slightly float based on experience, lacking scientific data sample analysis. Additionally, monitoring equipment is susceptible to satellite signals and environmental factors, leading to false alarms and false negatives during operation. To address these issues, a method of dynamic adjustment of self-learning and self-correction early warning thresholds is proposed. This method introduces two variable thresholds and a new performance index optimization method for VTAS based on priority and gate and semi-Markov processes. The application of the semi-Markov process allows the method to consider industrial measurements with non-Gaussian distributions. Moreover, an optimization design process based on genetic algorithms is proposed to improve performance indicators by optimizing parameter settings. Three numerical examples are used to illustrate the effectiveness of this approach and compare it with previous studies. When applied at the measured point, the method effectively reduce false alarms and under-alarms compared to the use of fixed thresholds, improving the accuracy of geological disaster early warning and better protecting the safety of people's lives and property.
-

-
表 1 可变阈值报警系统的结果
Table 1. Results of variable threshold alarm system
方法 固定阈值 固定阈值和死区 可变阈值 可变阈值和死区 指标 FAR 0.2668 0.2668 0.2009 0.2009 MAR 0.2036 0.0452 0.1836 0.0448  下载: 导出CSV
表 2 蒙特卡罗模拟与VTAS方法的比较
Table 2. Comparison between Monte Carlo simulation and VTAS
方法 蒙特卡罗模拟 VTAS的解 指标 FAR 0.159852 0.15867 MAR 0.159856 0.15867
下载: 导出CSV
表 3 所提出的解、蒙特卡罗结果和简单马尔可夫解之间的比较
Table 3. Comparison between the proposed solution, Monte Carlo results and simple Markov solutions
方法 VTAS的解 蒙特卡罗结果 简单马尔可夫解 指标 FAR 0.1371 0.1371 0.1455 MAR 0.1371 0.1070
下载: 导出CSV
表 4 可变阈值与其他方法性能指标的比较结果
Table 4. Comparison results of performance metrics of variable threshold method with other methods
方法 ST VTAS EWMA VTAS
(+EWMA filter)Evidence-based alarm
system3OMAF 3SADT 指标 MAR 0.3519 0.3118 0.0437 0.0518 0.0582 0.2470 0.1511 FAR 0.3806 0.2860 0.0447 0.0241 0.0429 0.2926 0.2527
下载: 导出CSV
表 5 不同方法性能指标的比较结果
Table 5. Comparison results of different methods’performance metrics
方法 固定阈值 可变阈值(带死区) 固定阈值(带死区) 指标 FAR 0.192783 0.289527 0.228910 MAR 0.460713 0.207569 0.364654
下载: 导出CSV
表 6 用遗传算法优化VTAS
Table 6. Optimizing VTAS with genetic algorithm
遗传算法中损失函数的权重 报警系统参数
(α, ω, n, m)MAR FAR AAD ω3 ω2 ω1 (25.024, 82, 1, 1) 0.2109 0.2282 1.2674 1 1 10 IRAAD IRFAR IRMAR 1 1e−05 1e−05 ω3 ω2 ω1 (25.039, 82, 2, 3) 0.0556 0.1681 2.8742 100 0.1 0.1 IRAAD IRFAR IRMAR 1 1e−03 1e−03 ω3 ω2 ω1 (25.680, 83, 2, 3) 0.0596 0.1625 2.8979 100 0.5 0.1 IRAAD IRFAR IRMAR 1 1e−03 1e−03
下载: 导出CSV
表 8 预警性能指标对比
Table 8. Comparison of early warning performance indicators
方法 MAR FAR 固定阈值 0.0830 0.137 可变阈值(带死区) 0.0007 0.013
下载: 导出CSV
-
[1] IZADI S L, SHAH D S, SHOOK S R, et al. A framework for optimal design of alarm systems[C]//Proceedings of the 7th IFAC SAFEPROCESS, 2009.
[2] NAGHOOSI E, IZADI I, CHEN T W. A study on the relation between alarm deadbands and optimal alarm limits[C]//Proceedings of the 2011 American Control Conference. June 29 - July 1, 2011, San Francisco, CA, USA. IEEE, 2011: 3627 − 3632.
[3] XU J. Performance assessment and design for univariate alarm systems based on FAR,MAR,and AAD[J]. IEEE Transactions on Automation Science and Engineering,2012,9(2):296 − 307. doi: 10.1109/TASE.2011.2176490
[4] NAGHOOSI E,IZADI I,CHEN T. Estimation of alarm chattering[J]. Journal of Process Control,2011,21(9):1243 − 1249. doi: 10.1016/j.jprocont.2011.07.015
[5] YUE C, IZADI I. Tongwen optimal alarm signal processing: Filter design and performance analysis[J]. J. Automation Science and Engineering, 2013, 10(2): 446 − 451.
[6] ADNAN N A,CHENG Y,IZADI I,et al. Study of generalized delay-timers in alarm configuration[J]. Journal of Process Control,2013,23(3):382 − 395. doi: 10.1016/j.jprocont.2012.12.013
[7] ADNAN N A,IZADI I,CHEN T W. On expected detection delays for alarm systems with deadbands and delay-timers[J]. Journal of Process Control,2011,21(9):1318 − 1331. doi: 10.1016/j.jprocont.2011.06.019
[8] YANG Fan, SHAH Sirish L, XIAO Deyun. Correlation analysis of alarm data and alarm limit design for industrial processes[C]//Proceedings of the 2010 American Control Conference. June 30 - July 2, 2010, Baltimore, MD, USA. IEEE, 2010: 5850 − 5855.
[9] SHARMA V, et al. A critical review on the application and problems caused by false alarms[J]. Singapore, 2018, s. n.
[10] AL-DABBAGH A W,HU Wenkai,LAI Shiqi,et al. Toward the advancement of decision support tools for industrial facilities:Addressing operation metrics,visualization plots,and alarm floods[J]. IEEE Transactions on Automation Science and Engineering,2018,15:1883 − 1896. doi: 10.1109/TASE.2018.2827309
[11] QUIÑONES-GRUEIRO M, PRIETO-MORENO A, VERDE C, et al. Data-driven monitoring of multimode continuous processes: A review[J]. Chemometr Intell Lab Syst 2019, 189(1): 56 – 71.
[12] HOLLIFIELD BR, HABIBI E, PINTO J. Alarm management: A comprehensive guide[J]. International Society of Automation (ISA), 2021, s. l.
[13] KONDAVEETI S R,SHAH S L,IZADI I. Application of multivariate statistics for efficient alarm generation[J]. IFAC Proceedings Volumes,2009,42(8):657 − 662. doi: 10.3182/20090630-4-ES-2003.00109
[14] CHENG Y,IZADI I,CHEN T W. Optimal alarm signal processing:filter design and performance analysis[J]. IEEE Transactions on Automation Science and Engineering,2013,10(2):446 − 451. doi: 10.1109/TASE.2012.2233472
[15] YANG H,LI H G. Optimization of process alarm thresholds:A multidimensional kernel density estimation approach[J]. Process Safety Progress,2014,33(3):292 − 298. doi: 10.1002/prs.11658
[16] HAN Liu,GAO Huihui,XU Yuan,et al. Combining FAP,MAP and correlation analysis for multivariate alarm thresholds optimization in industrial process[J]. Journal of Loss Prevention in the Process Industries,2016,40:471 − 478. doi: 10.1016/j.jlp.2016.01.022
[17] XU Xiaobin, LI Shibao, SONG Xiaojing, et al. The optimal design of industrial alarm systems based on evidence theory[J]. Control Eng Pract 2019, 46(1): 142 – 56.
[18] GAO Huihui, LIU Feifei, ZHU Qunxiong. A correlation consistency based multivariate alarm thresholds optimization approach[J]. ISA Transactions, Volume 65, 2016: 37 − 43.
[19] BAHAR-GOGANI M, ASLANSEFAT K, SHOOREHDELI M A. A novel extended adaptive thresholding for industrial alarm systems[C]//2017 Iranian Conference on Electrical Engineering (ICEE). May 2-4, 2017. Tehran, Iran. IEEE, 2017.
-


图(16)
表(8)
计量
- 文章访问数: 2609
- PDF下载数: 226
- 施引文献: 0