

Evaluation on spatial accuracy and validation of geological hazard susceptibility based on a multi-factor combination
-
摘要:
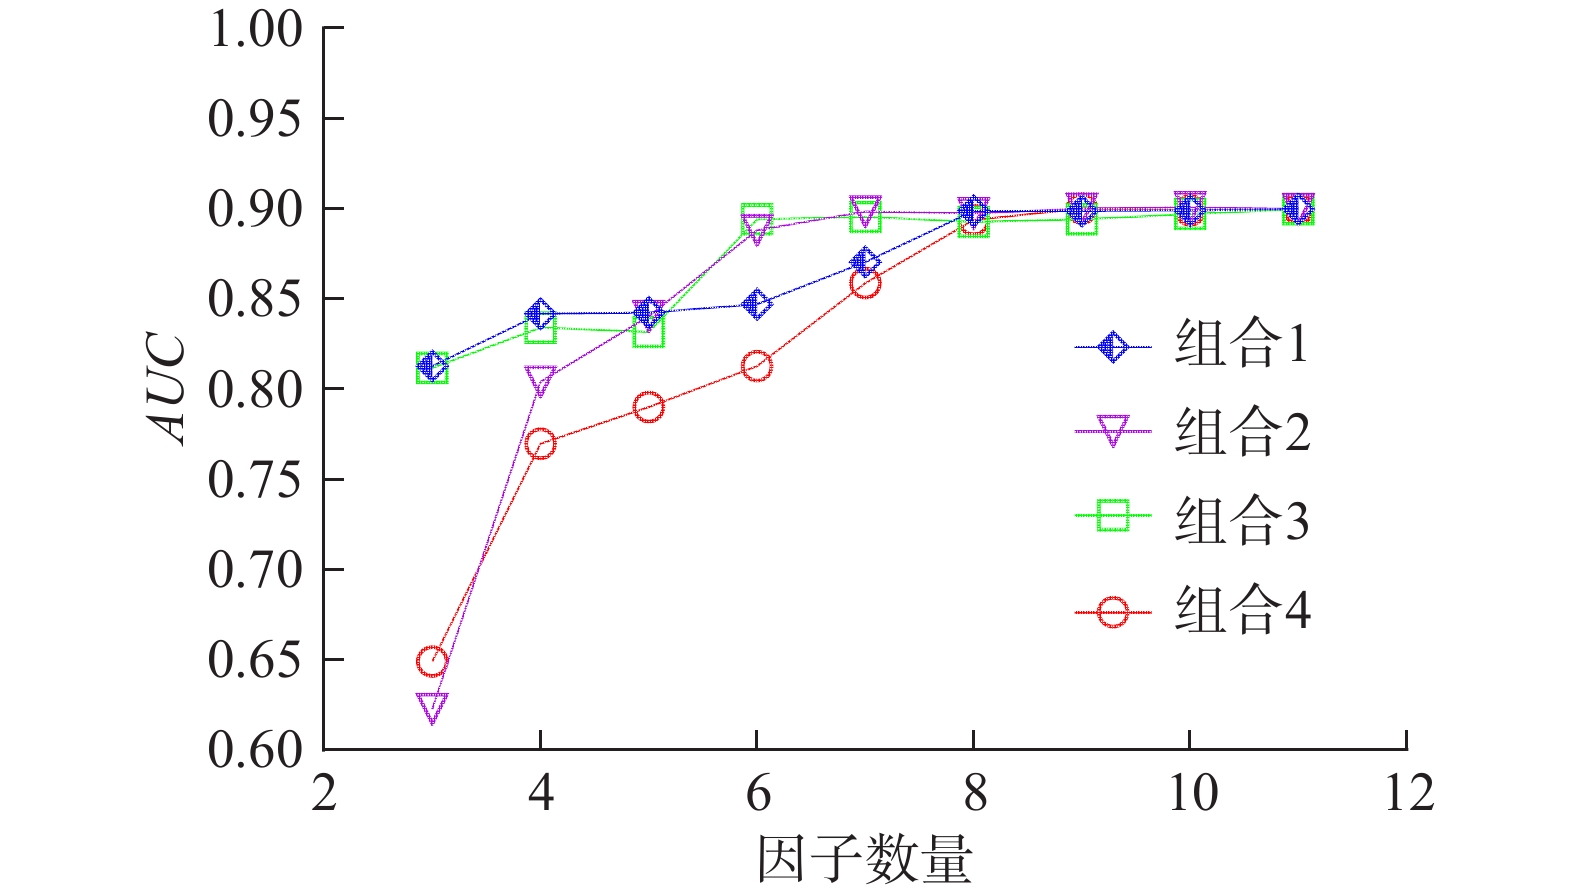
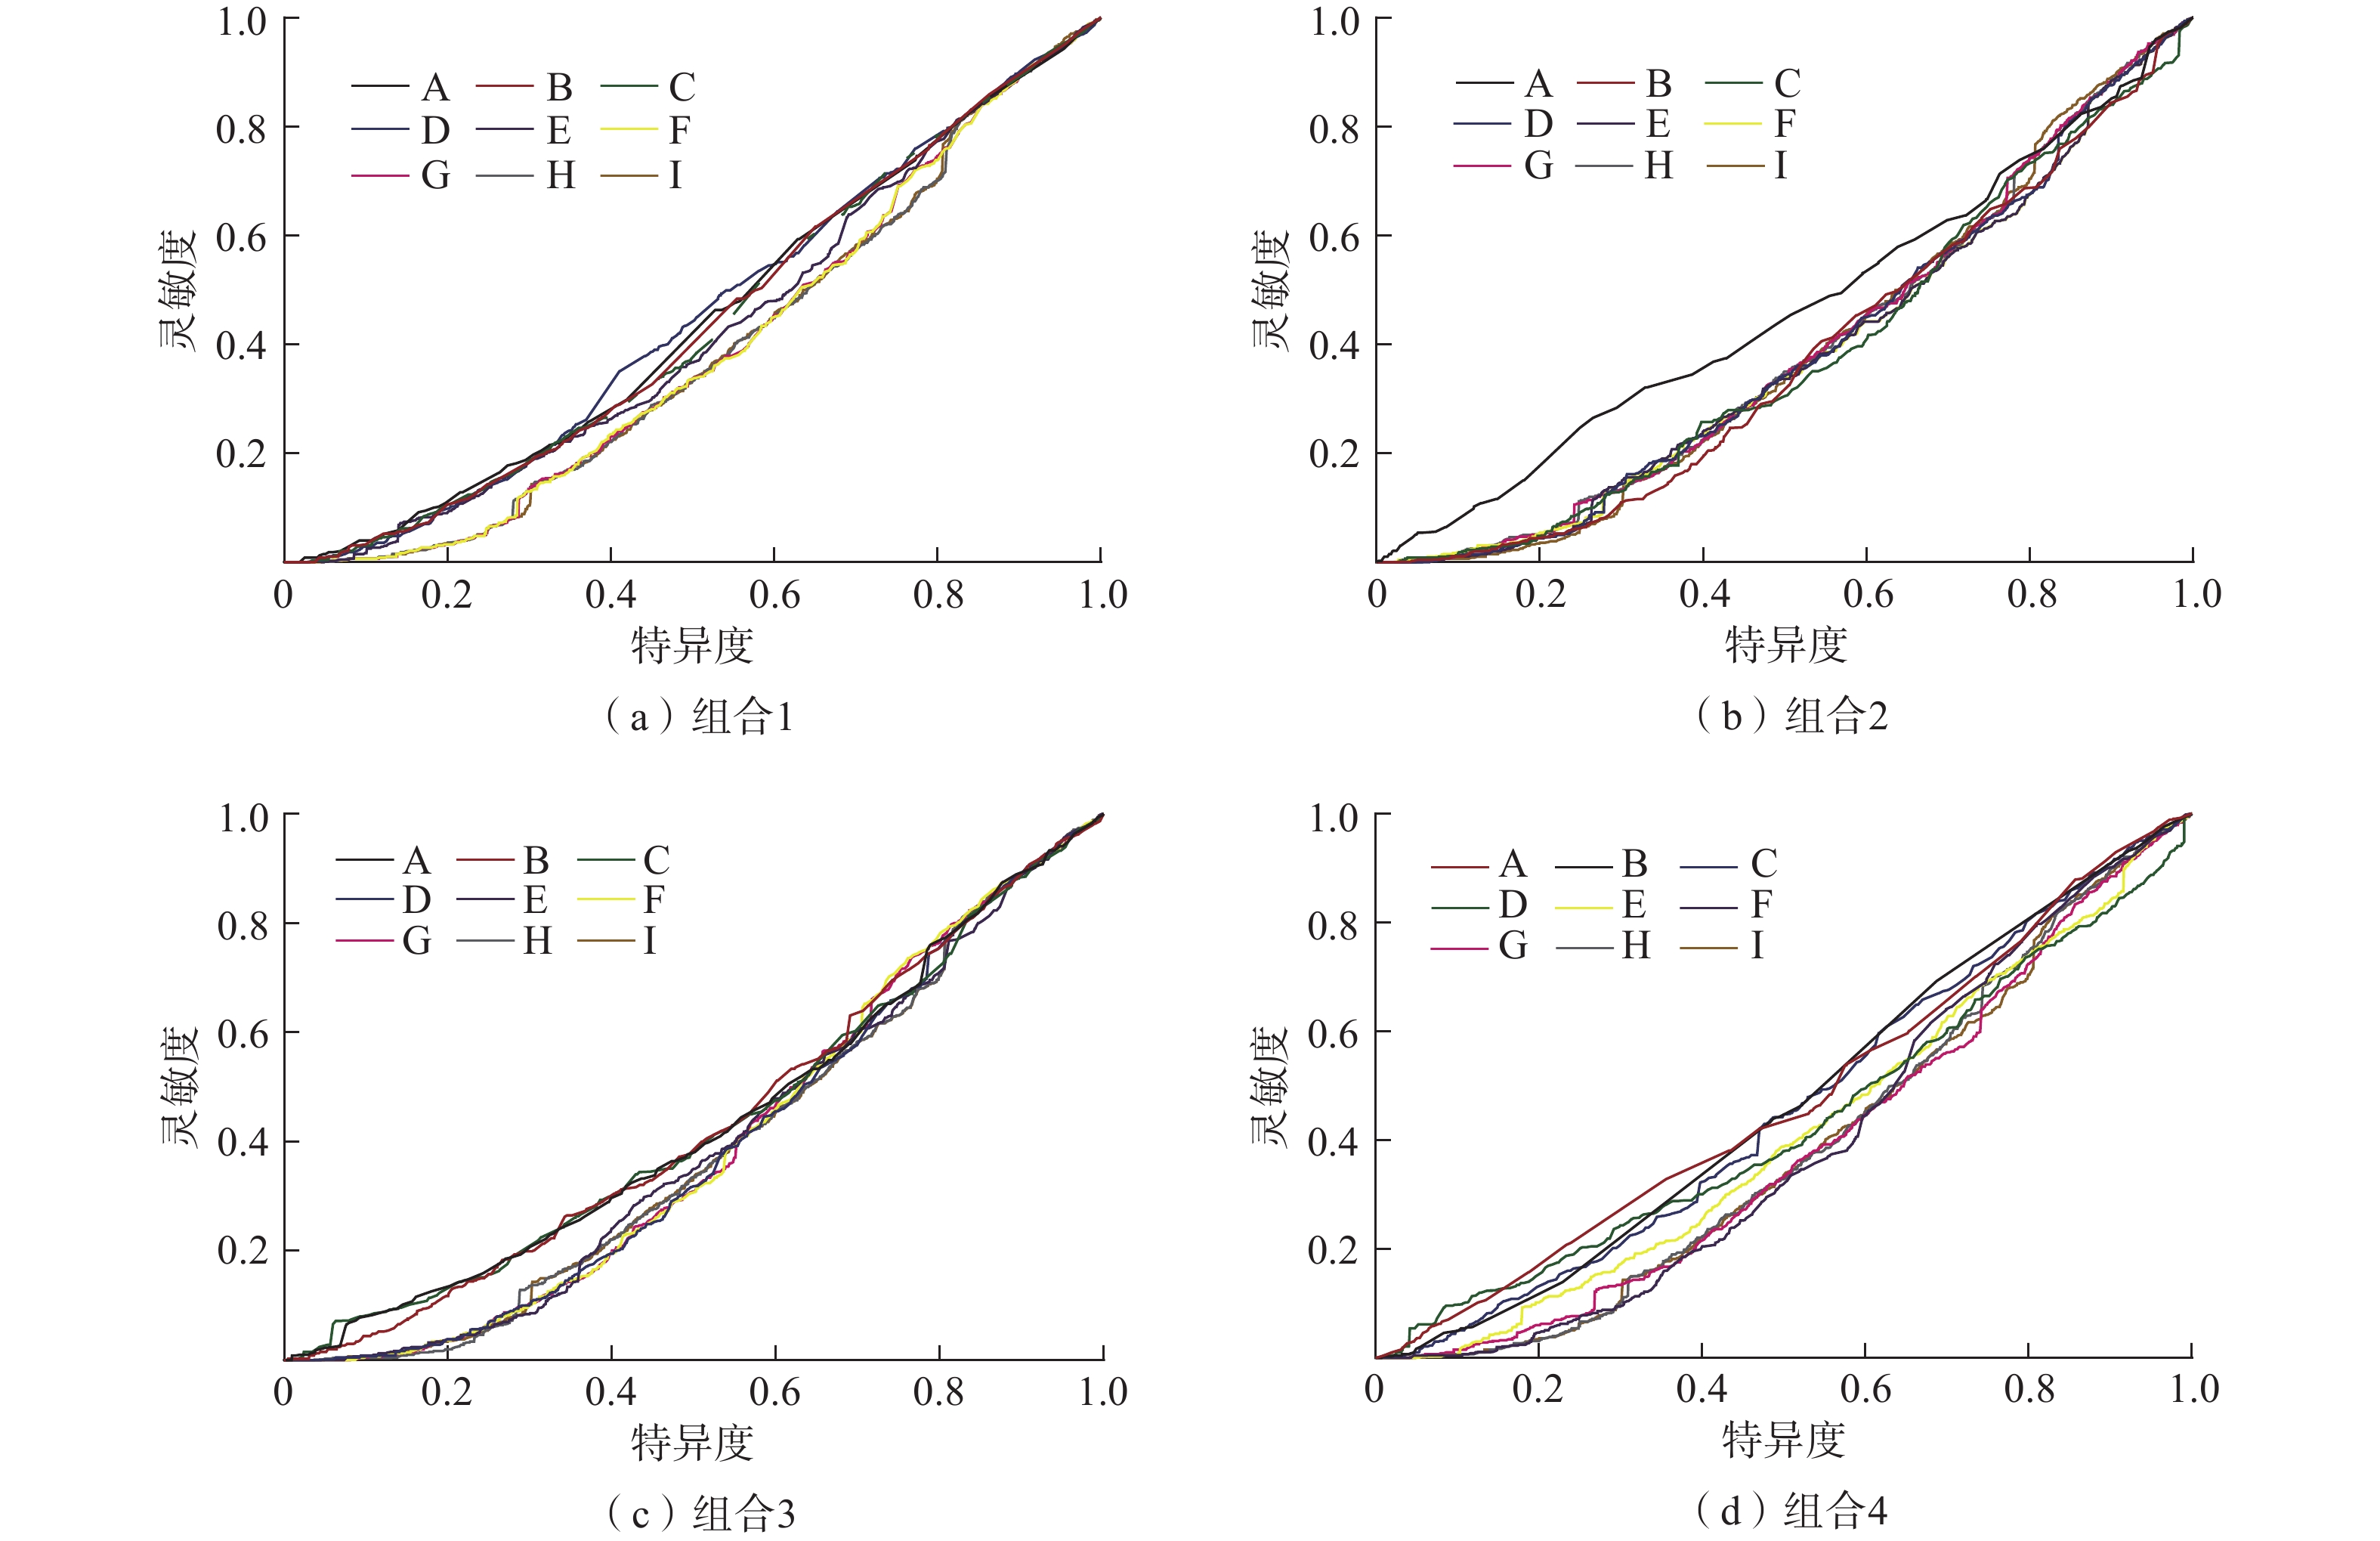
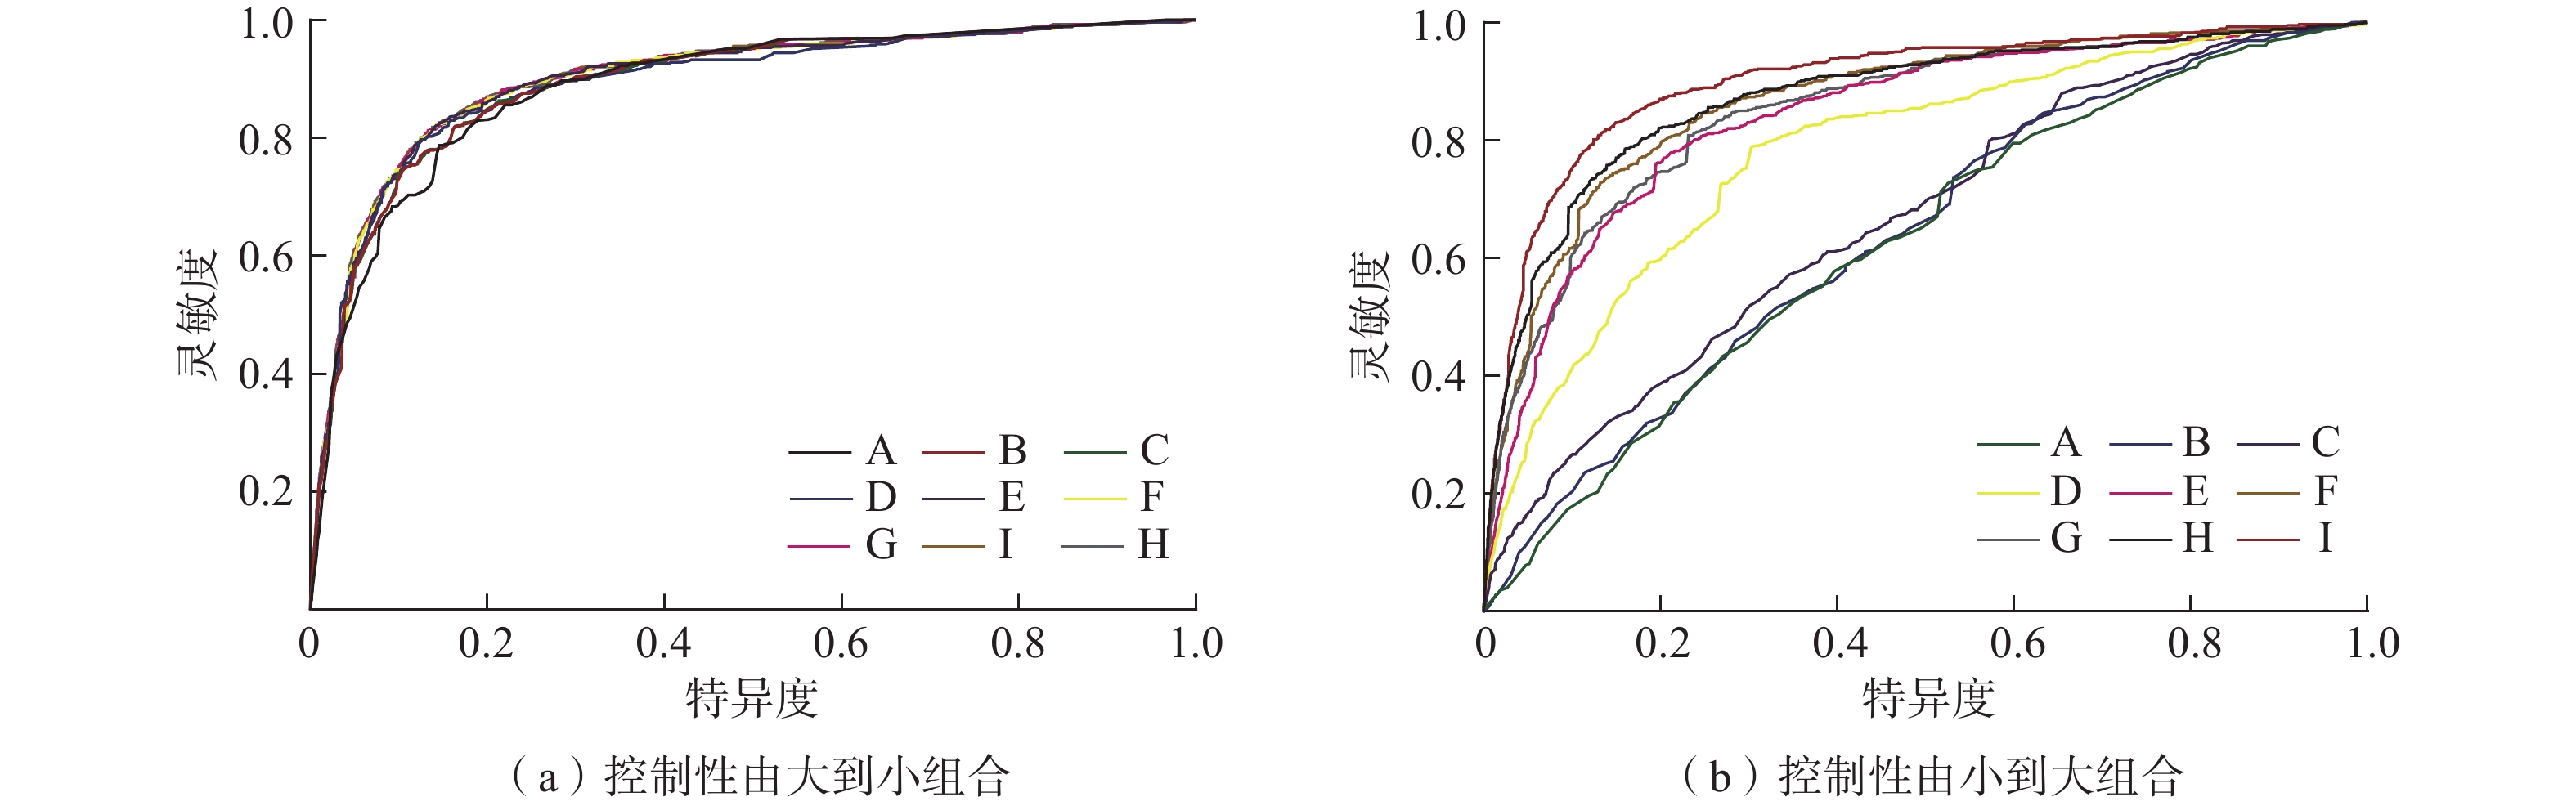
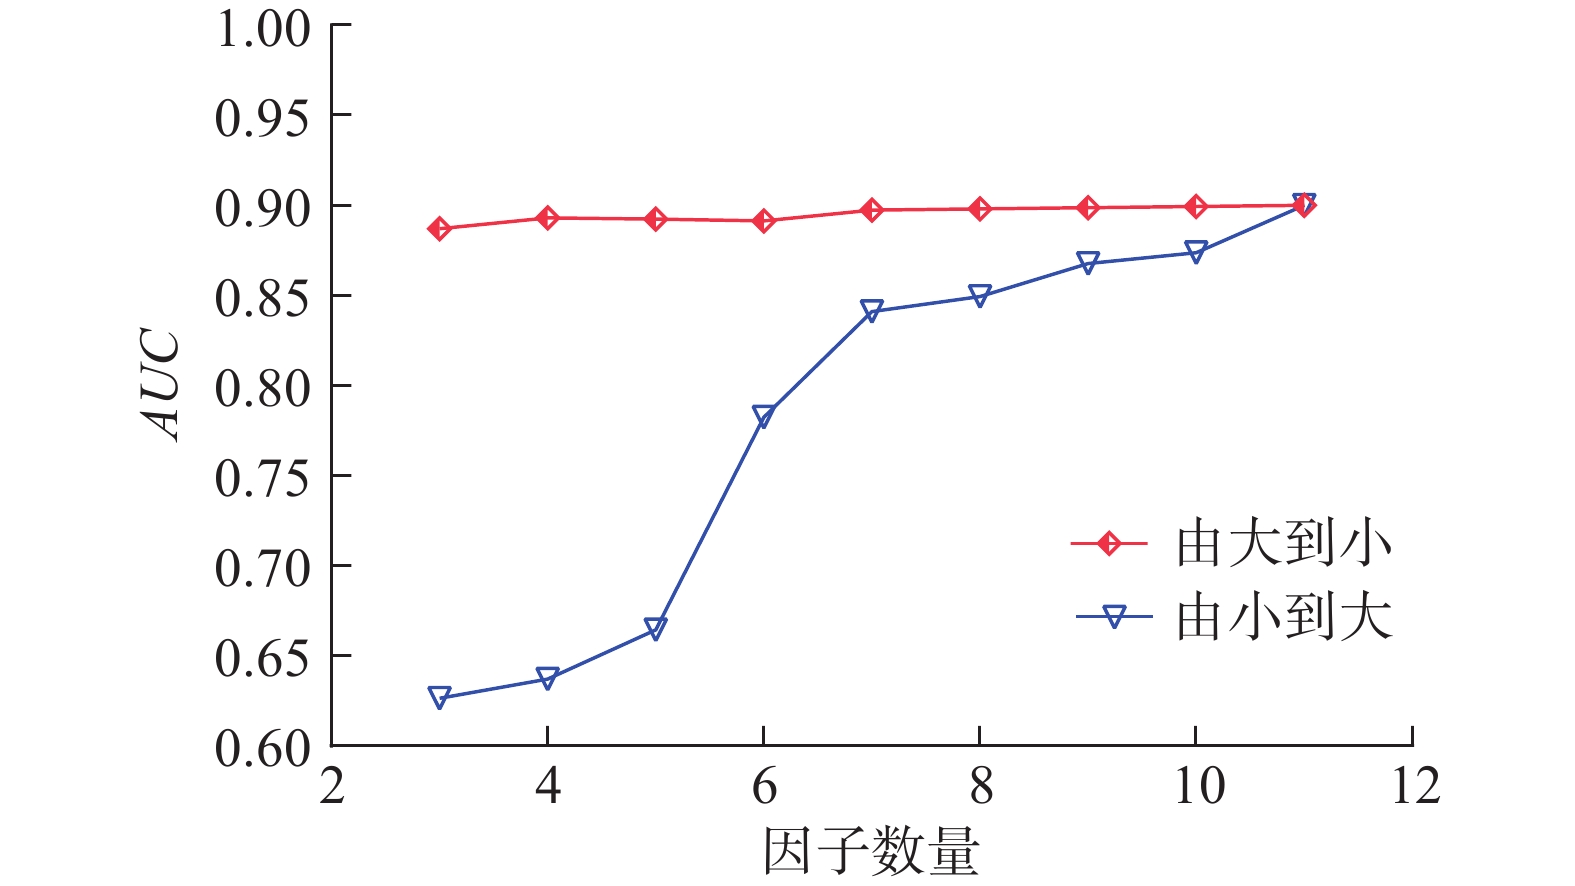
地质灾害的发生是多种因素相互作用、制约和触发的结果。长期以来,研究人员通过统计历史地质灾害所在区域的地质、地形、水文等环境因素预测未来地质灾害可能发生的位置、时间(或频率),即地质灾害易发性评价。地质灾害易发性评价前提工作是进行影响因子选取,而地质灾害发生的影响因子有数十种,是否叠加因子越多模型评价精度就越高?是否存在“最优因子数量”?这一简单而又关键的问题值得探讨。文章以四川省汶川县为例,选取11种广泛应用于地质灾害易发性评价的影响因子,按照4种排列组合模型,叠加3到11个因子信息量获得对应的地质灾害易发性指数分布图。运用成功率曲线确定线下面积值对各个结果进行预测精度评价。试验结果表明,按照初步设定的4种排列组合模型叠加因子数量到8个时,模型预测精度达到最大值;但在因子叠加过程中发现各个因子对于易发性的控制性与个人经验确定的控制性存在一定差异,按照实际因子控制性从大到小与从小到大排列组合后,叠加多个关键因子后模型预测精度才会达到峰值。研究成果表明,地质灾害易发性评价中叠加的因子数量越多,模型预测精度越高,叠加过程中如未加入关键因子,模型预测精度将不会达到峰值,说明地质灾害易发性评价不存在 “最优因子数量”。
Abstract:The occurrence of geological hazards is the result of the interaction, constraints, and triggers of various factors. For a long time, researchers have predicted the potential locations and time (or frequency) of future geological hazards in areas prone to historical geological disasters based on environmental factors such as geology, topography, and hydrology, known as geological hazard susceptibility assessment. A prerequisite for geological hazard susceptibility assessment is the selection of impact factors, and there are dozens of factors contributing to the occurrence of geological hazards. Does the accuracy of assessment model increase with the addition of more factors? Is there an “optimal number of factors”? This simple yet crucial question is worth exploring. Taking Wenchuan County, Sichuan Province, as an example, this study selects 11 commonly used influencing factors in geological hazard susceptibility assessment and arranges them into four different combination, superimposing information from 3 to 11 factors to obtain corresponding distribution maps of geological hazard susceptibility indexes. The area under curve (AUC) value was used to evaluate the predictive accuracy of the results. Experimental results show that the prediction accuracy of the model reaches its maximum value when the number of superposition factors added to the model reaches 8 according to the preliminary set four combinations. However, during the process of factor superposition, it is found that there are certain difference between the control of susceptibility by each factor and the control determined by individual experience. When the actual factor control is arranged from largest to smallest or from smallest to largest, the predictive accuracy of the model reaches its peak value after superposition of multiple key factors. The research findings indicates that the more factors added to the geological hazard susceptibility assessment, the higher the predictive accuracy of the model. If key factors are not included during the superimposition process, the predictive accuracy of the model will not reach its peak, indicating that there is no “optimal number of factors” in geological hazard susceptibility assessment.
-
Key words:
- geological hazard /
- susceptibility /
- impact factors /
- optimal factor quantity /
- key factors
-

-
表 1 因子分级及信息量
Table 1. Classification and information value of the factors
因子 分级 灾害点比例/% 因子分级
面积比例/%信息量 高程/m [784, 1200) 27.87 2.60 3.42 [1200, 1700) 40.78 8.69 2.23 [1700, 2200) 19.88 13.23 0.59 [2200, 2700) 7.26 16.98 −1.23 [2700, 5832] 4.21 58.50 −3.80 坡度/(°) [0, 10) 19.88 3.21 2.63 [0, 20) 26.85 13.30 1.01 [20, 30) 34.40 32.75 0.07 [30, 40) 14.95 37.66 −1.33 [40, 88] 3.92 13.08 −1.74 地面起伏度/m [0, 200) 15.09 4.49 1.75 [200, 400) 68.36 42.07 0.70 [400, 600) 15.38 45.22 −1.56 [600, 800) 1.02 7.29 −2.84 [800, ∞) 0.15 0.93 −2.69 沟谷密度
/(km·km−2)[0.23, 0.46) 1.30 13.65 −3.39 [0.46, 0.58) 6.08 24.26 −2.00 [0.58, 0.69) 31.84 33.00 −0.05 [0.69, 0.82) 42.26 23.38 0.85 [0.82, 1.23] 18.52 5.71 1.70 道路距离/m [0, 200) 1.01 1.70 −0.75 [200, 400) 2.32 1.68 0.46 [400, 600) 2.32 1.66 0.48 [600, 800) 2.32 1.66 0.48 [800, 1000) 2.32 1.64 0.50 [1000, ∞) 89.73 91.66 −0.03 断层距离/m [0, 500) 28.94 9.96 1.54 [500, 1000) 25.90 8.80 1.56 [1000, 1500) 10.27 7.27 0.50 [1500, 2000) 7.96 6.07 0.39 [2000, ∞) 26.92 67.90 −1.33 工程岩组 硬质岩组 18.38 9.56 0.94 软硬互层岩组 46.74 53.02 −0.18 软质岩组 34.88 37.42 −0.10 河流距离/m [0, 200) 8.10 1.59 2.35 [200, 400) 10.27 1.59 2.69 [400, 600) 11.29 1.59 2.82 [600, 800) 5.79 1.57 1.88 [800, 1000) 3.47 1.57 1.14 [1000, ∞) 61.07 92.07 −0.59 坡向 北 6.34 11.30 −0.83 北东 11.21 12.43 −0.15 东 16.37 14.93 0.13 南东 19.03 13.62 0.48 南 7.96 11.82 −0.57 南西 9.00 12.47 −0.47 西 12.24 11.26 0.12 北西 17.85 12.17 0.55 坡形 凹形坡 68.80 54.79 0.33 凸形坡 31.20 45.21 −0.53 植被指数 [−1, 0) 2.03 4.76 −1.23 [0, 0.1) 18.43 22.12 −0.26 [0.1, 0.25) 31.64 20.93 0.60 [0.25, 0.4) 23.08 23.69 −0.04 [0.4, 0.55) 21.04 18.31 0.20 [0.55, 0.6] 3.77 10.18 −1.43  下载: 导出CSV
表 2 因子权重
Table 2. Factor weights table
专家因子 1 2 3 4 5 6 7 8 平均值 ① 断层 0.055 0.269 0.193 0.223 0.138 0.182 0.209 0.135 0.176 ② 岩性 0.023 0.133 0.182 0.124 0.168 0.106 0.182 0.143 0.133 ③ 高程 0.171 0.053 0.018 0.022 0.099 0.138 0.012 0.056 0.071 ④ 坡度 0.028 0.116 0.108 0.146 0.083 0.203 0.141 0.112 0.117 ⑤ 坡向 0.169 0.014 0.038 0.041 0.086 0.106 0.024 0.023 0.063 ⑥ 沟谷密度 0.063 0.064 0.082 0.055 0.082 0.106 0.096 0.073 0.078 ⑦ 坡形 0.128 0.105 0.046 0.100 0.073 0.046 0.105 0.090 0.087 ⑧ 河流 0.123 0.031 0.084 0.103 0.042 0.043 0.089 0.196 0.089 ⑨ 道路 0.128 0.042 0.078 0.064 0.057 0.021 0.057 0.075 0.065 ⑩ 植被指数 0.044 0.053 0.018 0.043 0.036 0.036 0.050 0.028 0.039 ⑪ 起伏度 0.069 0.119 0.153 0.079 0.138 0.014 0.035 0.067 0.084
下载: 导出CSV
表 3 因子排列组合
Table 3. Factor combination table
因子数量 顺序组合 随机组合 组合 1 组合2 组合3 组合4 A(3) ①②③ ⑪⑩⑨ ③⑦⑪ ②④⑥ B(4) ①②③④ ⑪⑩⑨⑧ ①③⑤⑩ ②⑤⑨⑪ C(5) ①②③④⑤ ⑪⑩⑨⑧⑦ ②③⑤⑦⑨ ⑤⑦⑨⑩⑪ D(6) ①②③④⑤⑥ ⑪⑩⑨⑧⑦⑥ ①③④⑤⑧⑩ ②④⑥⑨⑩⑪ E(7) ①②③④⑤⑥⑦ ⑪⑩⑨⑧⑦⑥⑤ ①②④⑥⑦⑧⑪ ①③④⑤⑧⑨⑩ F(8) ①②③④⑤⑥⑦⑧ ⑪⑩⑨⑧⑦⑥⑤④ ①④⑤⑥⑧⑨⑩⑪ ①②③⑤⑦⑨⑩⑪ G(9) ①②③④⑤⑥⑦⑧⑨ ⑪⑩⑨⑧⑦⑥⑤④③ ①②④⑤⑥⑧⑨⑩⑪ ②③④⑥⑦⑧⑨⑩⑪ H(10) ①②③④⑤⑥⑦⑧⑨⑩ ⑪⑩⑨⑧⑦⑥⑤④③② ①②③⑤⑥⑦⑧⑨⑩⑪ ①②③④⑤⑥⑦⑧⑨⑪ I(11) ①②③④⑤⑥⑦⑧⑨⑩⑪ ⑪⑩⑨⑧⑦⑥⑤④③②① ①②③④⑤⑥⑦⑧⑨⑩⑪ ①③④⑤⑥⑦⑧⑨⑩⑪
下载: 导出CSV
-
[1] 黄发明. 基于3S和人工智能的滑坡位移预测与易发性评价[D]. 武汉:中国地质大学,2017. [HUANG Faming. Landslide displacement prediction and vulnerability evaluation based on 3S and artificial intelligence[D]. Wuhan:China University of Geosciences,2017. (in Chinese with English abstract)
HUANG Faming. Landslide displacement prediction and vulnerability evaluation based on 3S and artificial intelligence[D]. Wuhan: China University of Geosciences, 2017. (in Chinese with English abstract) [2] CÁRDENAS N Y,MERA E E. Landslide susceptibility analysis using remote sensing and GIS in the western Ecuadorian Andes[J]. Natural Hazards,2016,81(3):1829 − 1859. doi: 10.1007/s11069-016-2157-8
[3] POURGHASEMI H R,YANSARI Z T,PANAGOS P,et al. Analysis and evaluation of landslide susceptibility:A review on articles published during 2005-2016 (periods of 2005-2012 and 2013-2016)[J]. Arabian Journal of Geosciences,2018,11(9):193. doi: 10.1007/s12517-018-3531-5
[4] ERCANOGLU M. Landslide susceptibility assessment of SE Bartin (West Black Sea region,Turkey) by artificial neural networks[J]. Natural Hazards and Earth System Sciences,2005,5(6):979 − 992. doi: 10.5194/nhess-5-979-2005
[5] 张俊,殷坤龙,王佳佳,等. 三峡库区万州区滑坡灾害易发性评价研究[J]. 岩石力学与工程学报,2016,35(2):284 − 296. [ZHANG Jun,YIN Kunlong,WANG Jiajia,et al. Evaluation of landslide susceptibility for Wanzhou District of Three Gorges Reservoir[J]. Chinese Journal of Rock Mechanics and Engineering,2016,35(2):284 − 296. (in Chinese with English abstract)
ZHANG Jun, YIN Kunlong, WANG Jiajia, et al . Evaluation of landslide susceptibility for Wanzhou District of Three Gorges Reservoir[J]. Chinese Journal of Rock Mechanics and Engineering,2016 ,35 (2 ):284 −296 . (in Chinese with English abstract)[6] MANZO G,TOFANI V,SEGONI S,et al. GIS techniques for regional-scale landslide susceptibility assessment:The Sicily (Italy) case study[J]. International Journal of Geographical Information Science,2013,27(7):1433 − 1452. doi: 10.1080/13658816.2012.693614
[7] ABBASZADEH SHAHRI A,SPROSS J,JOHANSSON F,et al. Landslide susceptibility hazard map in southwest Sweden using artificial neural network[J]. CATENA,2019,183:104225. doi: 10.1016/j.catena.2019.104225
[8] REICHENBACH P,ROSSI M,MALAMUD B D,et al. A review of statistically-based landslide susceptibility models[J]. Earth-Science Reviews,2018,180:60 − 91. doi: 10.1016/j.earscirev.2018.03.001
[9] ZHAO Yu,WANG Rui,JIANG Yuanjun,et al. GIS-based logistic regression for rainfall-induced landslide susceptibility mapping under different grid sizes in Yueqing,Southeastern China[J]. Engineering Geology,2019,259:105147. doi: 10.1016/j.enggeo.2019.105147
[10] TRIGILA A,IADANZA C,ESPOSITO C,et al. Comparison of logistic regression and random forests techniques for shallow landslide susceptibility assessment in Giampilieri (NE Sicily,Italy)[J]. Geomorphology,2015,249:119 − 136. doi: 10.1016/j.geomorph.2015.06.001
[11] HE Qingfeng,SHAHABI H,SHIRZADI A,et al. Landslide spatial modelling using novel bivariate statistical based Naïve Bayes,RBF Classifier,and RBF Network machine learning algorithms[J]. Science of the Total Environment,2019,663:1 − 15. doi: 10.1016/j.scitotenv.2019.01.329
[12] REGMI N R,GIARDINO J R,VITEK J D. Modeling susceptibility to landslides using the weight of evidence approach:western Colorado,USA[J]. Geomorphology,2010,115(1/2):172 − 187.
[13] GUZZETTI F,CARRARA A,CARDINALI M,et al. Landslide hazard evaluation:A review of current techniques and their application in a multi-scale study,Central Italy[J]. Geomorphology,1999,31(1/2/3/4):181 − 216.
[14] 黄发明,汪洋,董志良,等. 基于灰色关联度模型的区域滑坡敏感性评价[J]. 地球科学,2019,44(2):664 − 676. [HUANG Faming,WANG Yang,DONG Zhiliang,et al. Regional landslide susceptibility mapping based on grey relational degree model[J]. Earth Science,2019,44(2):664 − 676. (in Chinese with English abstract)
HUANG Faming, WANG Yang, DONG Zhiliang, et al . Regional landslide susceptibility mapping based on grey relational degree model[J]. Earth Science,2019 ,44 (2 ):664 −676 . (in Chinese with English abstract)[15] 张玘恺,凌斯祥,李晓宁,等. 九寨沟县滑坡灾害易发性快速评估模型对比研究[J]. 岩石力学与工程学报,2020,39(8):1595 − 1610. [ZHANG Qikai,LING Sixiang,LI Xiaoning,et al. Comparison of landslide susceptibility mapping rapid assessment models in Jiuzhaigou County,Sichuan Province,China[J]. Chinese Journal of Rock Mechanics and Engineering,2020,39(8):1595 − 1610. (in Chinese with English abstract)
ZHANG Qikai, LING Sixiang, LI Xiaoning, et al . Comparison of landslide susceptibility mapping rapid assessment models in Jiuzhaigou County, Sichuan Province, China[J]. Chinese Journal of Rock Mechanics and Engineering,2020 ,39 (8 ):1595 −1610 . (in Chinese with English abstract)[16] 樊芷吟,苟晓峰,秦明月,等. 基于信息量模型与Logistic回归模型耦合的地质灾害易发性评价[J]. 工程地质学报,2018,26(2):340 − 347. [FAN Zhiyin,GOU Xiaofeng,QIN Mingyue,et al. Information and logistic regression models based coupling analysis for susceptibility of geological hazards[J]. Journal of Engineering Geology,2018,26(2):340 − 347. (in Chinese with English abstract)
FAN Zhiyin, GOU Xiaofeng, QIN Mingyue, et al . Information and logistic regression models based coupling analysis for susceptibility of geological hazards[J]. Journal of Engineering Geology,2018 ,26 (2 ):340 −347 . (in Chinese with English abstract)[17] 武雪玲,沈少青,牛瑞卿. GIS支持下应用PSO-SVM模型预测滑坡易发性[J]. 武汉大学学报(信息科学版),2016,41(5):665 − 671. [WU Xueling,SHEN Shaoqing,NIU Ruiqing. Landslide susceptibility prediction using GIS and PSO-SVM[J]. Geomatics and Information Science of Wuhan University,2016,41(5):665 − 671. (in Chinese with English abstract)
WU Xueling, SHEN Shaoqing, NIU Ruiqing . Landslide susceptibility prediction using GIS and PSO-SVM[J]. Geomatics and Information Science of Wuhan University,2016 ,41 (5 ):665 −671 . (in Chinese with English abstract)[18] 陈涛,钟子颖,牛瑞卿,等. 利用深度信念网络进行滑坡易发性评价[J]. 武汉大学学报(信息科学版),2020,45(11):1809 − 1817. [CHEN Tao,ZHONG Ziying,NIU Ruiqing,et al. Mapping landslide susceptibility based on deep belief network[J]. Geomatics and Information Science of Wuhan University,2020,45(11):1809 − 1817. (in Chinese with English abstract)
CHEN Tao, ZHONG Ziying, NIU Ruiqing, et al . Mapping landslide susceptibility based on deep belief network[J]. Geomatics and Information Science of Wuhan University,2020 ,45 (11 ):1809 −1817 . (in Chinese with English abstract)[19] 范强,巨能攀,向喜琼,等. 证据权法在区域滑坡危险性评价中的应用——以贵州省为例[J]. 工程地质学报,2014,22(3):474 − 481. [FAN Qiang,JU Nengpan,XIANG Xiqiong,et al. Landslides hazards assessment with weights of evidence:A case study in Guizhou,China[J]. Journal of Engineering Geology,2014,22(3):474 − 481. (in Chinese with English abstract)
FAN Qiang, JU Nengpan, XIANG Xiqiong, et al . Landslides hazards assessment with weights of evidence: A case study in Guizhou, China[J]. Journal of Engineering Geology,2014 ,22 (3 ):474 −481 . (in Chinese with English abstract)[20] 许冲,戴福初,姚鑫,等. 基于GIS的汶川地震滑坡灾害影响因子确定性系数分析[J]. 岩石力学与工程学报,2010,29(增刊1):2972 − 2981. [XU Chong,DAI Fuchu,YAO Xin,et al. GIS based certainty factor analysis of landslide triggering factors in Wenchuan earthquake[J]. Chinese Journal of Rock Mechanics and Engineering,2010,29(Sup 1):2972 − 2981. (in Chinese with English abstract)
XU Chong, DAI Fuchu, YAO Xin, et al. GIS based certainty factor analysis of landslide triggering factors in Wenchuan earthquake[J]. Chinese Journal of Rock Mechanics and Engineering, 2010, 29(Sup 1): 2972 − 2981. (in Chinese with English abstract) -


图(9)
表(3)
计量
- 文章访问数: 1792
- PDF下载数: 115
- 施引文献: 0