

Analysis of spatial-temporal distribution characteristics and influencing factors of land subsidence in Bozhou City, Anhui Province based on SBAS-InSAR technology
-
摘要:
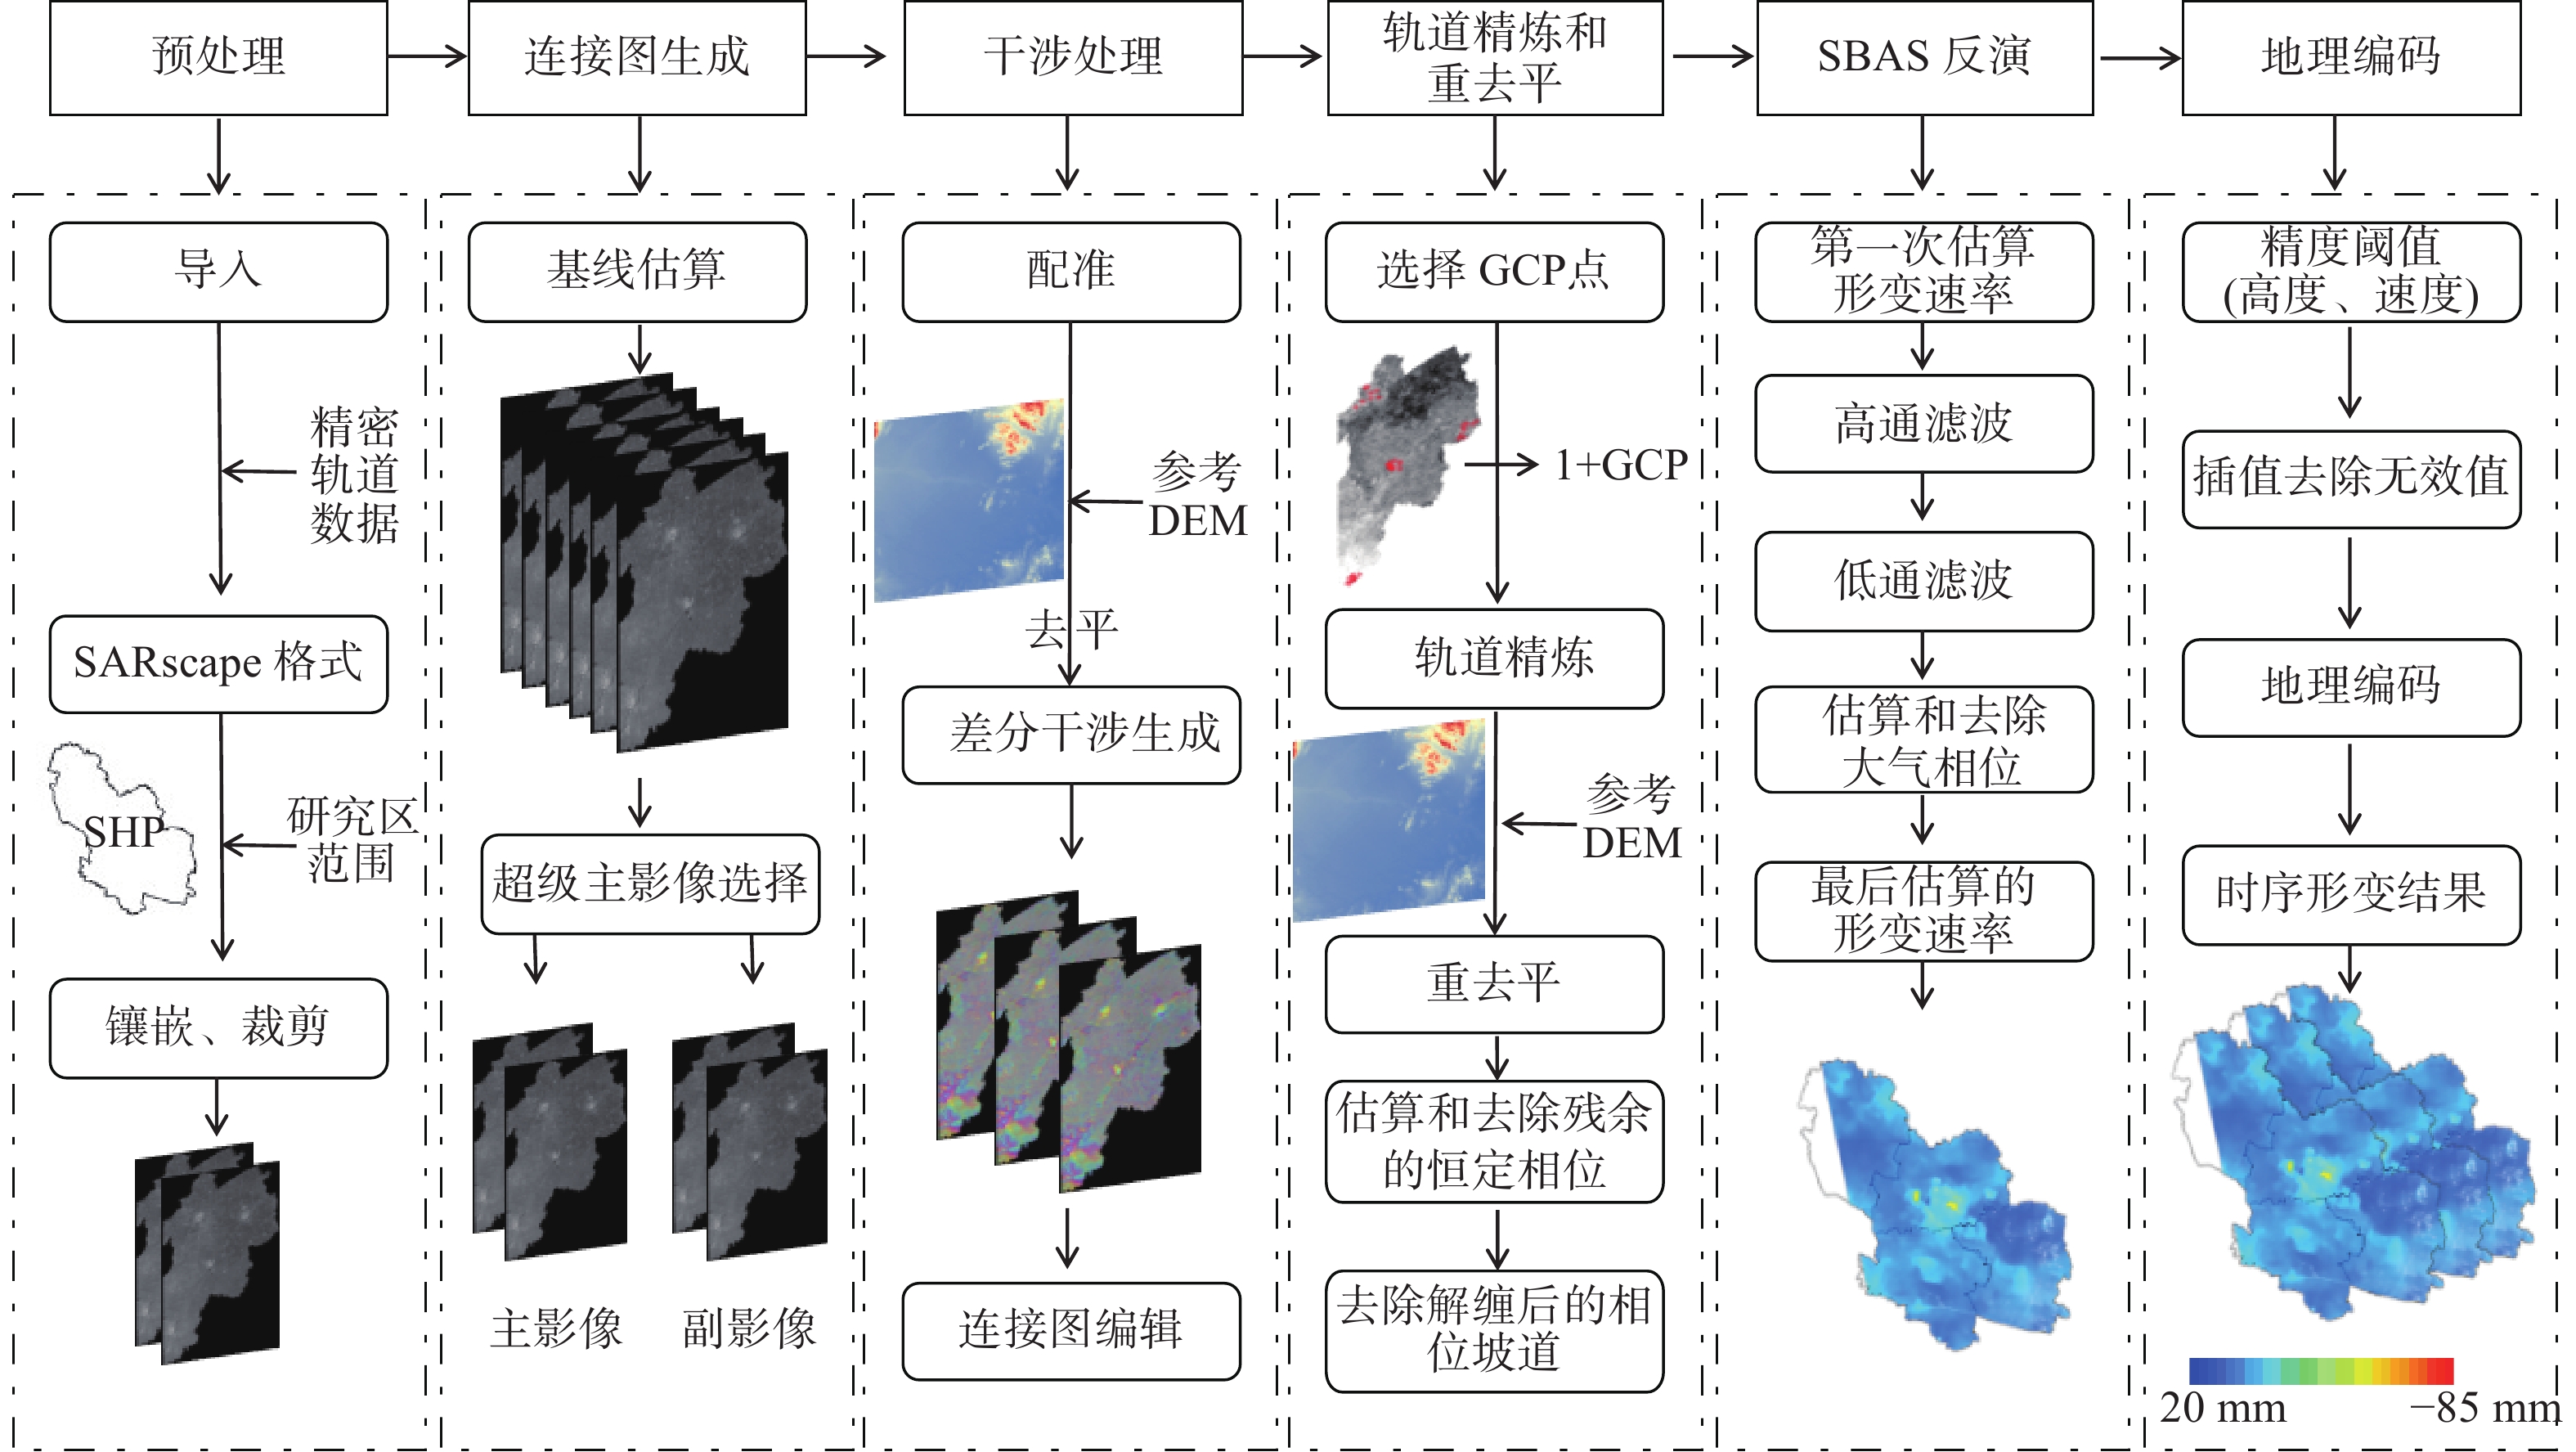
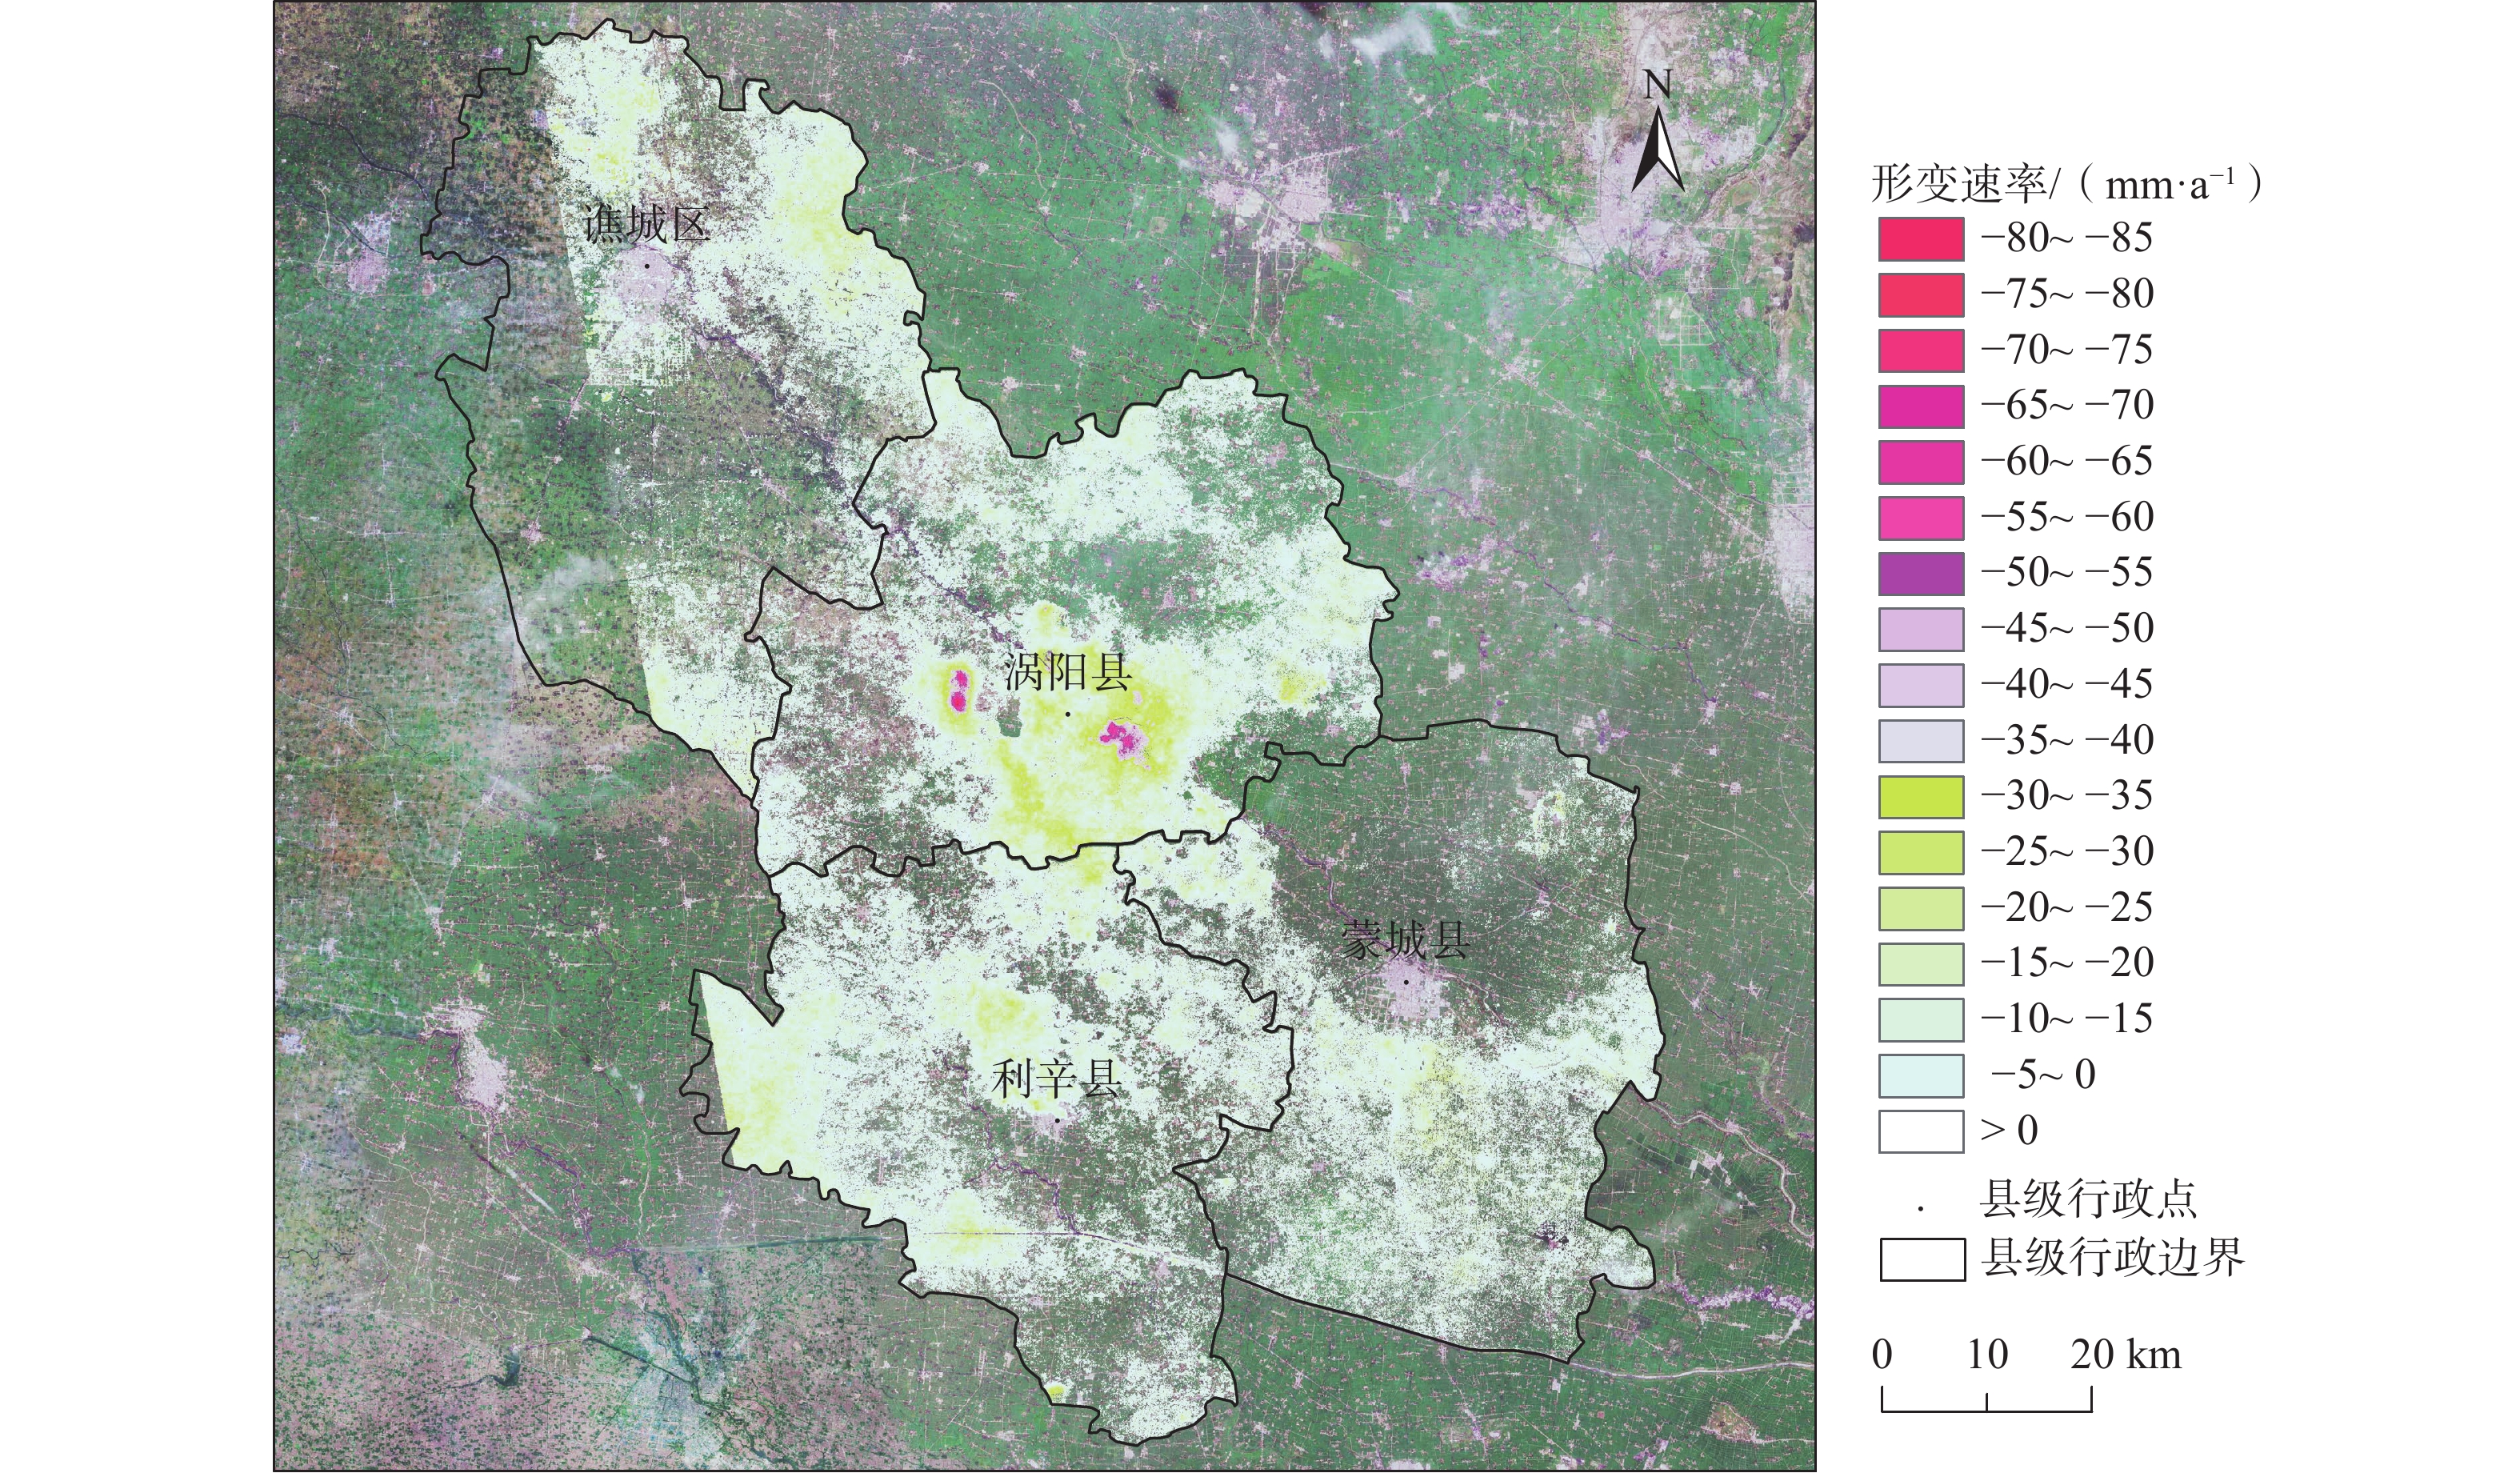
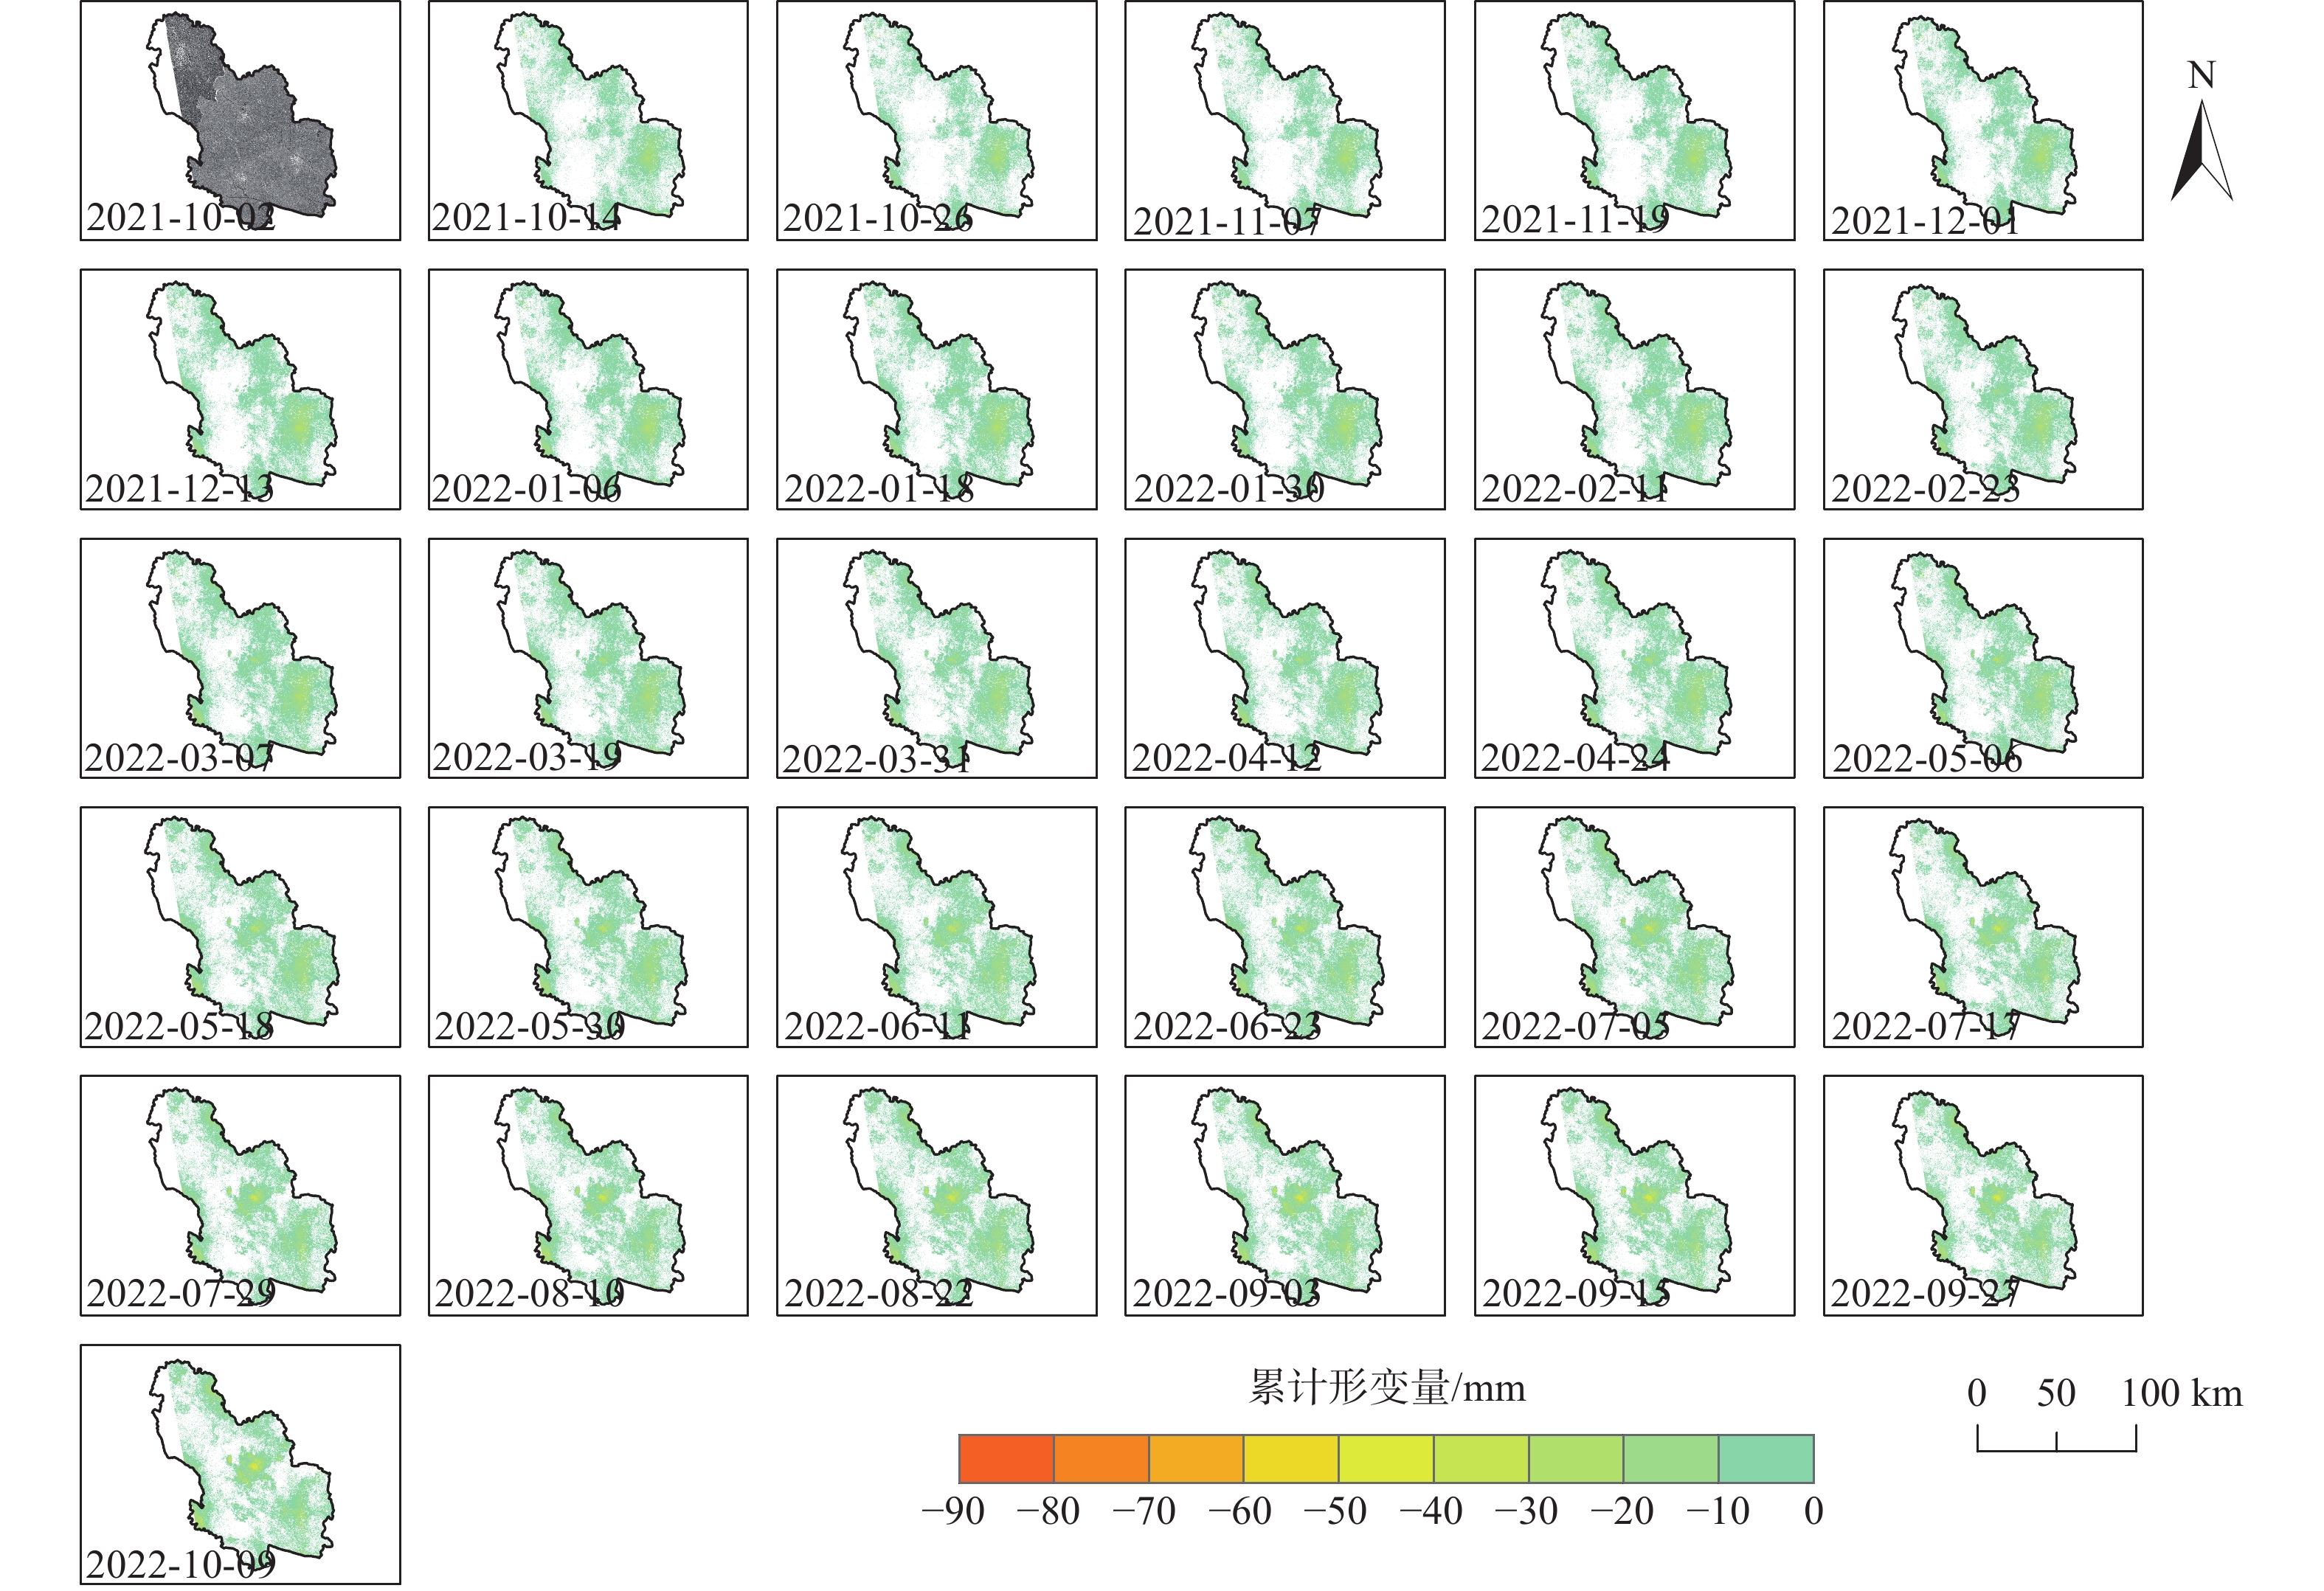
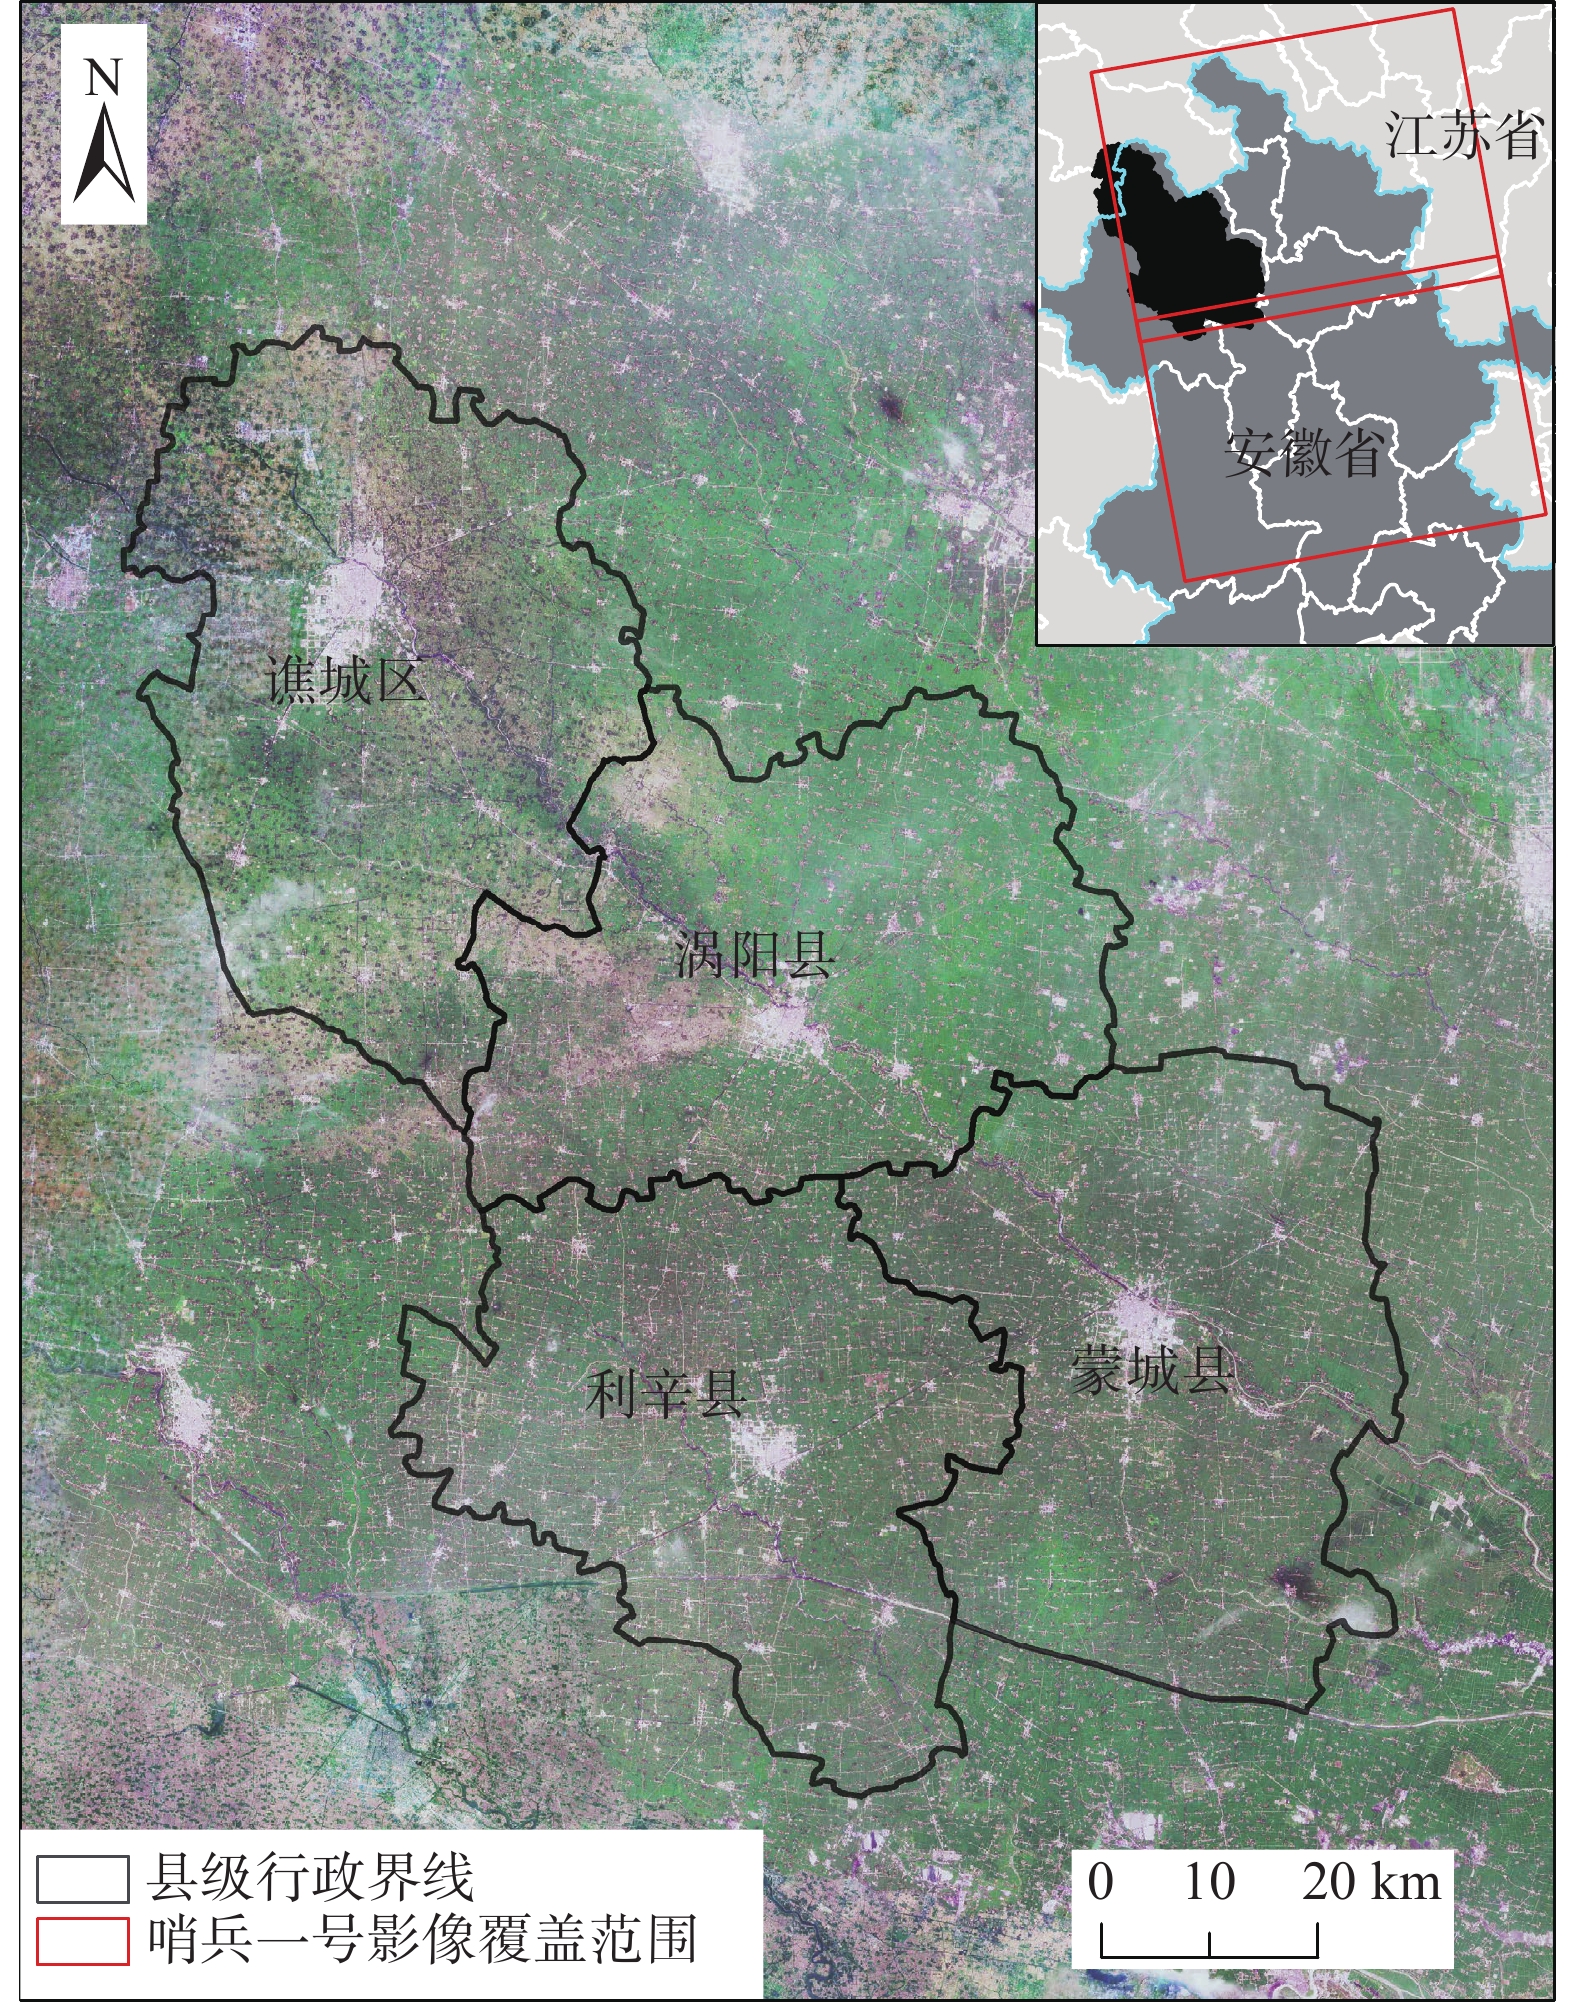
近年来皖北平原地区地面沉降问题相对突出,区域地面沉降驱动力的量化研究尚且匮乏。为深入研究沉降灾害的发育特征,文章以亳州市为例,基于62景Sentinel-1数据,利用SBAS-InSAR技术获取2021年10月至2022年10月期间地面沉降的时空分布特征,并结合地理加权回归模型对亳州市地面沉降主要驱动力进行探讨。研究结果表明:(1)亳州市主体沉降速率为5~30 mm/a,平均沉降速率为5.7 mm/a。(2)最严重沉降区位于涡阳县公吉寺镇北侧,幅值为84.3 mm/a,沉降主要受煤矿开采所致;非采煤沉降区,最大沉降速率为25.8 mm/a,位于谯城区东北侧。(3)各驱动力因素对地面沉降的贡献度从大到小排序为深层水位变幅、中深层水位变幅、中深层地下水埋深、深层地下水埋深、单位面积GDP、松散层厚度、道路密度、人口密度。研究结果可为地质灾害防治提供基础数据支撑。
-
关键词:
- 亳州市 /
- 地面沉降 /
- SBAS-InSAR /
- 地理加权回归模型 /
- 形变驱动力
Abstract:In recent years, land subsidence issues have become relatively prominent in the northern plain area of Anhui province, and there is lack of quantitative research on the driving forces of regional land subsidence. In order to further investigate the developmental characteristics of subsidence disasters and provide scientific, this paper takes Bozhou City as an example. Based on 62 scenes of Sentinel-1 data, SBAS-InSAR technology is employed to obtain the spatial-temporal distribution characteristics of land subsidence from October 2021 to October 2022. Additionally, a geographic weighted regression model is applied to explore the main driving factors of land subsidence in Bozhou city. The research results indicate: (1) The main subsidence rate in Bozhou City ranges from 5 to 30 mm/year,with an average subsidence rate of 5.7 mm /year. (2) The most serious subsidence area is located north of Gongji Temple Town in Woyang County, with an amplitude of 84.3 mm/year, mainly caused by coal mining. In non-coal mining subsidence areas, the maximum subsidence rate is 25.8 mm/year, located in the northeast of Qiaocheng District. (3) The contribution order of various driving factors to ground subsidence is as follows: fluctuation of deep water level, fluctuation of middle-deep water level, burial depth of middle-deep groundwater, burial depth of deep groundwater, GDP per unit area, thickness of loose layer, road density, and population density. The study results can provide basic data support for geological disaster prevention and control.
-

-
表 1 Sentinel-1卫星数据参数表
Table 1. Parameters of Sentinel-1 satellite data
参数 数值 监测日期 轨道高度/km 700 2021-10-02、2021-10-14、2021-10-26、
2021-11-07、2021-11-19、2021-12-01、
2021-12-13、2022-01-06、2022-01-18、
2022-01-30、2022-02-11、2022-02-23、
2022-03-07、2022-03-19、2022-03-31、
2022-04-12、2022-04-24、2022-05-06、
2022-05-18、2022-05-30、2022-06-11、
2022-06-23、2022-07-05、2022-07-17、
2022-07-29、2022-08-10、2022-08-22、
2022-09-03、2022-09-15、2022-09-27、
2022-10-09重访周期/d 12 入射角/(°) 29~46 分辨率/m 5×20 幅宽/m 250 极化方式 VV 轨道号 142,101 / 142,106  下载: 导出CSV
表 2 模型多重共线性检验
Table 2. Model multicollinearity test
因子 VIF 因子 VIF 中深层地下水埋深 1.234526 松散层厚度 1.519002 中深层水位变幅 1.625721 人口密度 1.116396 深层水位变幅 1.681352 道路密度 1.053348 深层地下水埋深 2.087465 单位面积GDP 2.481104
下载: 导出CSV
表 3 2022年地面沉降GWR回归模型参数
Table 3. Ground subsidence GWR regression model parameters for 2022
监测年份 带宽 赤池信息准则 可决系数 校正可决系数 2022年 824 11850.657545 0.394583 0.373125
下载: 导出CSV
表 4 SBAS-InSAR监测结果与水准数据对比
Table 4. Comparison between SBAS-InSAR monitoring results and leveling data
点名 实测形变量/mm SBAS-InSAR监测的形变量/mm 差值/mm BJ01 3 3.83 0.83 BJ02 −1 −0.54 −0.46 BXJ08 −4 −3.78 −0.22
下载: 导出CSV
表 5 模型运算结果叙述性统计
Table 5. Descriptive statistics of model calculation results
变量 最小值 中值 最大值 平均值 深层水位变幅 -1.487 0.938 7.769 3.141 中深层水位变幅 -1.482 0.602 2.674 0.596 中深层地下水埋深 -0.747 -0.311 0.065 -0.341 深层地下水埋深 -0.293 -0.050 0.085 -0.104 单位面积GDP -0.003 0.000 0.001 -0.001 松散层厚度 -0.014 0.000 0.013 -0.0005 道路密度 -0.000 0.000 0.001 0.0005 人口密度 -0.001 0.000 0.001 0.000
下载: 导出CSV
-
[1] 曹群,陈蓓蓓,宫辉力,等. 基于SBAS和IPTA技术的京津冀地区地面沉降监测[J]. 南京大学学报(自然科学),2019,55(3):381 − 391. [CAO Qun,CHEN Beibei,GONG Huili,et al. Monitoring of land subsidence in Beijing-Tianjin-Hebei Urban by combination of SBAS and IPTA[J]. Journal of Nanjing University (Natural Science),2019,55(3):381 − 391. (in Chinese with English abstract)
CAO Qun, CHEN Beibei, GONG Huili, et al. Monitoring of land subsidence in Beijing-Tianjin-Hebei Urban by combination of SBAS and IPTA[J]. Journal of Nanjing University (Natural Science), 2019, 55(3): 381-391. (in Chinese with English abstract)
[2] 杨魁,闫利,黄国满,等. InSAR和地表覆盖的地表沉降驱动力分析[J]. 测绘科学,2019,44(1):42 − 47. [YANG Kui,YAN Li,HUANG Guoman,et al. Research on the change of urban subsidence based on InSAR and land cover of national geographic conditions[J]. Science of Surveying and Mapping,2019,44(1):42 − 47. (in Chinese with English abstract)
YANG Kui, YAN Li, HUANG Guoman, et al. Research on the change of urban subsidence based on InSAR and land cover of national geographic conditions[J]. Science of Surveying and Mapping, 2019, 44(1): 42-47. (in Chinese with English abstract)
[3] 朱邦彦,唐超,任志忠,等. 基于PS-InSAR技术的珠海市地表形变监测与驱动力分析[J]. 测绘通报,2022(6):108 − 113. [ZHU Bangyan,TANG Chao,REN Zhizhong,et al. Surface deformation monitoring and driving force analysis in Zhuhai city based on PS-InSAR technology[J]. Bulletin of Surveying and Mapping,2022(6):108 − 113. (in Chinese with English abstract)
ZHU Bangyan, TANG Chao, REN Zhizhong, et al. Surface deformation monitoring and driving force analysis in Zhuhai city based on PS-InSAR technology[J]. Bulletin of Surveying and Mapping, 2022(6): 108-113. (in Chinese with English abstract)
[4] 尹承深,刘全明,王福强. 基于Sentinel-1A SAR数据的呼和浩特城区地表形变分析[J]. 中国地质灾害与防治学报,2023,34(2):73 − 81. [YIN Chengshen,LIU Quanming,WANG Fuqiang. Surface deformation analysis of Hohhot urban area based on SAR data from Sentinel-1A[J]. The Chinese Journal of Geological Hazard and Control,2023,34(2):73 − 81. (in Chinese with English abstract)
YIN Chengshen, LIU Quanming, WANG Fuqiang. Surface deformation analysis of Hohhot urban area based on SAR data from Sentinel-1A[J]. The Chinese Journal of Geological Hazard and Control, 2023, 34(2): 73-81. (in Chinese with English abstract)
[5] 戴真印,刘岳霖,张丽平,等. 基于改进时序InSAR技术的东莞地面沉降时空演变特征[J]. 中国地质灾害与防治学报,2023,34(1):58 − 67. [DAI Zhenyin,LIU Yuelin,ZHANG Liping,et al. Spatial-temporal evolution characteristics of land subsidence in Dongguan City based on improved InSAR technology[J]. The Chinese Journal of Geological Hazard and Control,2023,34(1):58 − 67. (in Chinese with English abstract)
DAI Zhenyin, LIU Yuelin, ZHANG Liping, et al. Spatial-temporal evolution characteristics of land subsidence in Dongguan City based on improved InSAR technology[J]. The Chinese Journal of Geological Hazard and Control, 2023, 34(1): 58-67. (in Chinese with English abstract)
[6] 董少春,种亚辉,胡欢,等. 基于时序InSAR的常州市2015—2018年地面沉降监测[J]. 南京大学学报(自然科学),2019,55(3):370 − 380. [DONG Shaochun,CHONG Yahui,HU Huan,et al. Ground subsidence monitoring during 2015-2018 in Changzhou based on time series InSAR method[J]. Journal of Nanjing University (Natural Science),2019,55(3):370 − 380. (in Chinese with English abstract)
DONG Shaochun, CHONG Yahui, HU Huan, et al. Ground subsidence monitoring during 2015-2018 in Changzhou based on time series InSAR method[J]. Journal of Nanjing University (Natural Science), 2019, 55(3): 370-380. (in Chinese with English abstract)
[7] 郭世鹏,张王菲,康伟,等. 融合PS、SBAS、DS InSAR技术的昆明地面沉降研究[J]. 遥感技术与应用,2022,37(2):460 − 473. [GUO Shipeng,ZHANG Wangfei,KANG Wei,et al. The study on land subsidence in Kunming by integrating PS,SBAS and DS InSAR[J]. Remote Sensing Technology and Application,2022,37(2):460 − 473. (in Chinese with English abstract)
GUO Shipeng, ZHANG Wangfei, KANG Wei, et al. The study on land subsidence in Kunming by integrating PS, SBAS and DS InSAR[J]. Remote Sensing Technology and Application, 2022, 37(2): 460-473. (in Chinese with English abstract)
[8] 陈毅,何毅,张立峰,等. 长短时记忆网络TS-InSAR地表形变预测[J]. 遥感学报,2022,26(7):1326 − 1341. [CHEN Yi,HE Yi,ZHANG Lifeng,et al. Surface deformation prediction based on TS-InSAR technology and long short-term memory networks[J]. National Remote Sensing Bulletin,2022,26(7):1326 − 1341. (in Chinese with English abstract) doi: 10.11834/jrs.20221457
CHEN Yi, HE Yi, ZHANG Lifeng, et al. Surface deformation prediction based on TS-InSAR technology and long short-term memory networks[J]. National Remote Sensing Bulletin, 2022, 26(7): 1326-1341. (in Chinese with English abstract) doi: 10.11834/jrs.20221457
[9] ZHANG Peng,GUO Zihao,GUO Shuangfeng,et al. Land subsidence monitoring method in regions of variable radar reflection characteristics by integrating PS-InSAR and SBAS-InSAR techniques[J]. Remote Sensing,2022,14(14):3265. doi: 10.3390/rs14143265
[10] 张凯翔,张占荣,于宪煜. SBAS-InSAR和PS-InSAR技术在鲁西南某线性工程沿线地面沉降成因分析中的应用[J]. 中国地质灾害与防治学报,2022,33(4):65 − 76. [ZHANG Kaixiang,ZHANG Zhanrong,YU Xianyu. Application of SBAS-InSAR and PS-InSAR technologies in analysis of landslide subsidence along a linear infrastructure in Southwestern Shandong[J]. The Chinese Journal of Geological Hazard and Control,2022,33(4):65 − 76. (in Chinese with English abstract)
ZHANG Kaixiang, ZHANG Zhanrong, YU Xianyu. Application of SBAS-InSAR and PS-InSAR technologies in analysis of landslide subsidence along a linear infrastructure in Southwestern Shandong[J]. The Chinese Journal of Geological Hazard and Control, 2022, 33(4): 65-76. (in Chinese with English abstract)
[11] 何秀凤,高壮,肖儒雅,等. InSAR与北斗/GNSS综合方法监测地表形变研究现状与展望[J]. 测绘学报,2022,51(7):1338 − 1355. [HE Xiufeng,GAO Zhuang,XIAO Ruya,et al. Application and prospect of the integration of InSAR and BDS/GNSS for land surface deformation monitoring[J]. Acta Geodaetica et Cartographica Sinica,2022,51(7):1338 − 1355. (in Chinese with English abstract)
HE Xiufeng, GAO Zhuang, XIAO Ruya, et al. Application and prospect of the integration of InSAR and BDS/GNSS for land surface deformation monitoring[J]. Acta Geodaetica et Cartographica Sinica, 2022, 51(7): 1338-1355. (in Chinese with English abstract)
[12] 李志伟,许文斌,胡俊,等. InSAR部分地学参数反演[J]. 测绘学报,2022,51(7):1458 − 1475. [LI Zhiwei,XU Wenbin,HU Jun,et al. Partial geoscience parameters inversion from InSAR observation[J]. Acta Geodaetica et Cartographica Sinica,2022,51(7):1458 − 1475. (in Chinese with English abstract)
LI Zhiwei, XU Wenbin, HU Jun, et al. Partial geoscience parameters inversion from InSAR observation[J]. Acta Geodaetica et Cartographica Sinica, 2022, 51(7): 1458-1475. (in Chinese with English abstract)
[13] FERRETTI A,PRATI C,ROCCA F. Permanent scatterers in SAR interferometry[J]. IEEE Transactions on Geoscience and Remote Sensing,2001,39(1):8 − 20. doi: 10.1109/36.898661
[14] BERARDINO P,FORNARO G,LANARI R,et al. A new algorithm for surface deformation monitoring based on small baseline differential SAR interferograms[J]. IEEE Transactions on Geoscience and Remote Sensing,2002,40(11):2375 − 2383. doi: 10.1109/TGRS.2002.803792
[15] 高胜,曾琪明,焦健,等. 永久散射体雷达干涉研究综述[J]. 遥感技术与应用,2016,31(1):86 − 94. [GAO Sheng,ZENG Qiming,JIAO Jian,et al. A review on persistent scatterer interferometric synthetic aperture radar[J]. Remote Sensing Technology and Application,2016,31(1):86 − 94. (in Chinese with English abstract)
GAO Sheng, ZENG Qiming, JIAO Jian, et al. A review on persistent scatterer interferometric synthetic aperture radar[J]. Remote Sensing Technology and Application, 2016, 31(1): 86-94. (in Chinese with English abstract)
[16] 朱建军,李志伟,胡俊. InSAR变形监测方法与研究进展[J]. 测绘学报,2017,46(10):1717 − 1733. [ZHU Jianjun,LI Zhiwei,HU Jun. Research progress and methods of InSAR for deformation monitoring[J]. Acta Geodaetica et Cartographica Sinica,2017,46(10):1717 − 1733. (in Chinese with English abstract) doi: 10.11947/j.AGCS.2017.20170350
ZHU Jianjun, LI Zhiwei, HU Jun. Research progress and methods of InSAR for deformation monitoring[J]. Acta Geodaetica et Cartographica Sinica, 2017, 46(10): 1717-1733. (in Chinese with English abstract) doi: 10.11947/j.AGCS.2017.20170350
[17] 潘建平,邓福江,徐正宣,等. 基于轨道精炼控制点精选的极艰险区域时序InSAR地表形变监测[J]. 中国地质灾害与防治学报,2021,32(5):98 − 104. [PAN Jianping,DENG Fujiang,XU Zhengxuan,et al. Time series InSAR surface deformation monitoring in extremely difficult area based on track refining control points selection[J]. The Chinese Journal of Geological Hazard and Control,2021,32(5):98 − 104. (in Chinese with English abstract)
PAN Jianping, DENG Fujiang, XU Zhengxuan, et al. Time series InSAR surface deformation monitoring in extremely difficult area based on track refining control points selection[J]. The Chinese Journal of Geological Hazard and Control, 2021, 32(5): 98-104. (in Chinese with English abstract)
[18] 王守沛,胡留洋. 基于D-InSAR技术在亳州市地面沉降分析[J]. 西部探矿工程,2020,32(7):114 − 116. [WANG Shoupei,HU Liuyang. Analysis of land subsidence in Bozhou city based on D-InSAR technology[J]. West-China Exploration Engineering,2020,32(7):114 − 116. (in Chinese)
WANG Shoupei, HU Liuyang. Analysis of land subsidence in Bozhou city based on D-InSAR technology[J]. West-China Exploration Engineering, 2020, 32(7): 114-116. (in Chinese)
[19] 彭鹏. 基于SBAS技术的亳州市地面沉降遥感监测应用研究[J]. 西部资源,2016(4):152 − 155. [PENG Peng. Bozhou city ground subsidence monitoring based on SBAS[J]. Westem Resources,2016(4):152 − 155. (in Chinese with English abstract)
PENG Peng. Bozhou city ground subsidence monitoring based on SBAS[J]. Westem Resources, 2016(4): 152-155. (in Chinese with English abstract)
[20] 辛洪光,朱虎,辛翌龙. 亳州市地面沉降成因分析与防治对策[J]. 城市与减灾,2021(3):34 − 38. [XIN Hongguang,ZHU Hu,XIN Yilong. Cause analysis and controlling countermeasures of surface subsidence in Bozhou City,Anhui Province[J]. City and Disaster Reduction,2021(3):34 − 38. (in Chinese)
XIN Hongguang, ZHU Hu, XIN Yilong. Cause analysis and controlling countermeasures of surface subsidence in Bozhou city, Anhui Province[J]. City and Disaster Reduction, 2021(3): 34-38. (in Chinese)
[21] 潘光永,陶秋香,陈洋,等. 基于SBAS-InSAR的山东济阳矿区沉降监测与分析[J]. 中国地质灾害与防治学报,2020,31(4):100 − 106. [PAN Guangyong,TAO Qiuxiang,CHEN Yang,et al. Monitoring and analysis of sedimentation in Jiyang mining area of Shandong Province based on SBAS-InSAR[J]. The Chinese Journal of Geological Hazard and Control,2020,31(4):100 − 106. (in Chinese with English abstract)
PAN Guangyong, TAO Qiuxiang, CHEN Yang, et al. Monitoring and analysis of sedimentation in Jiyang mining area of Shandong Province based on SBAS-InSAR[J]. The Chinese Journal of Geological Hazard and Control, 2020, 31(4): 100-106. (in Chinese with English abstract)
[22] 莫莉,王贤能. 基于PS-InSAR技术的后海深槽地面及建筑物形变监测分析[J]. 中国地质灾害与防治学报,2023,34(1):68 − 74. [MO Li,WANG Xianneng. Monitoring and analysis of ground and building settlement of deep trough in Houhai based on PS-InSAR technology[J]. The Chinese Journal of Geological Hazard and Control,2023,34(1):68 − 74. (in Chinese with English abstract)
MO Li, WANG Xianneng. Monitoring and analysis of ground and building settlement of deep trough in Houhai based on PS-InSAR technology[J]. The Chinese Journal of Geological Hazard and Control, 2023, 34(1): 68-74. (in Chinese with English abstract)
[23] 杨正荣,喜文飞,史正涛,等. 基于SBAS-InSAR技术的白鹤滩水电站库岸潜在滑坡变形分析[J]. 中国地质灾害与防治学报,2022,33(5):83 − 92. [YANG Zhengrong,XI Wenfei,SHI Zhengtao,et al. Deformation analysis in the bank slopes in the reservoir area of Baihetan Hydropower Station based on SBAS-InSAR technology[J]. The Chinese Journal of Geological Hazard and Control,2022,33(5):83 − 92. (in Chinese with English abstract)
YANG Zhengrong, XI Wenfei, SHI Zhengtao, et al. Deformation analysis in the bank slopes in the reservoir area of Baihetan Hydropower Station based on SBAS-InSAR technology[J]. The Chinese Journal of Geological Hazard and Control, 2022, 33(5): 83-92. (in Chinese with English abstract)
[24] 蒲川豪,许强,蒋亚楠,等. 延安新区地面沉降分布及影响因素的时序InSAR监测分析[J]. 武汉大学学报(信息科学版),2020,45(11):1728 − 1738. [PU Chuanhao,XU Qiang,JIANG Yanan,et al. Analysis of land subsidence distribution and influencing factors in Yan’an new district based on time series InSAR[J]. Geomatics and Information Science of Wuhan University,2020,45(11):1728 − 1738. (in Chinese with English abstract)
PU Chuanhao, XU Qiang, JIANG Yanan, et al. Analysis of land subsidence distribution and influencing factors in Yan’an new district based on time series InSAR[J]. Geomatics and Information Science of Wuhan University, 2020, 45(11): 1728-1738. (in Chinese with English abstract)
[25] 叶勇超,闫超德,罗先学,等. 时序InSAR郑州地铁沿线地面沉降分析[J]. 遥感学报,2022,26(7):1342 − 1353. [YE Yongchao,YAN Chaode,LUO Xianxue,et al. Analysis of ground subsidence along Zhengzhou metro based on time series InSAR[J]. National Remote Sensing Bulletin,2022,26(7):1342 − 1353. (in Chinese with English abstract) doi: 10.11834/jrs.20211246
YE Yongchao, YAN Chaode, LUO Xianxue, et al. Analysis of ground subsidence along Zhengzhou metro based on time series InSAR[J]. National Remote Sensing Bulletin, 2022, 26(7): 1342-1353. (in Chinese with English abstract) doi: 10.11834/jrs.20211246
[26] BRUNSDON C,FOTHERINGHAM A S,CHARLTON M E. Geographically weighted regression:A method for exploring spatial nonstationarity[J]. Geographical Analysis,2010,28(4):281 − 298. doi: 10.1111/j.1538-4632.1996.tb00936.x
[27] 张扬. 武汉市地面沉降时空格局、驱动因子及水文效应研究[D]. 武汉: 武汉大学, 2019
ZHANG Yang. Spatial-temporal patterns, driving forces and hydrological effects of land subsidence: A case study of Wuhan City, China[D]. Wuhan: Wuhan University, 2019. (in Chinese with English abstract)
[28] 张琦,曹蔚宁,延书宁. 旅游发展对城乡收入差距影响的空间异质性—基于多尺度地理加权回归模型(MGWR)[J]. 中国地质大学学报(社会科学版),2022,22(5):112 − 123. [ZHANG Qi,CAO Weining,YAN Shuning. Spatial heterogeneity of the impact of tourism development on urban-rural income gap in china—based on multi-scale geographically weighted regression model(MGWR)[J]. Journal of China University of Geosciences (Social Sciences Edition),2022,22(5):112 − 123. (in Chinese with English abstract)
ZHANG Qi, CAO Weining, YAN Shuning. Spatial heterogeneity of the impact of tourism development on urban-rural income gap in china—based on multi-scale geographically weighted regression model(MGWR)[J]. Journal of China University of Geosciences (Social Sciences Edition), 2022, 22(5): 112-123. (in Chinese with English abstract)
[29] JI Yanjie,MA Xinwei,YANG Mingyuan,et al. Exploring spatially varying influences on metro-bikeshare transfer:A geographically weighted Poisson regression approach[J]. Sustainability,2018,10(5):1526. doi: 10.3390/su10051526
[30] 梁勇旗,杜守华. 浅谈煤矿采空区的塌陷机理及发展因素[J]. 岩土工程界,2008(8):35 − 37. [LIANG Yongqi,DU Shouhua. Discussion on collapse mechanism and development factors of coal mine goaf[J]. Geotechnical Engineering World,2008(8):35 − 37. (in Chinese)
LIANG Yongqi, DU Shouhua. Discussion on collapse mechanism and development factors of coal mine goaf[J]. Geotechnical Engineering World, 2008(8): 35-37. (in Chinese)
[31] 黄多成,王守沛. 亳州市城市环境地质问题及防治对策浅析[J]. 地下水,2020,42(4):126 − 128. [HUANG Duocheng,WANG Shoupei. A brief analysis of Bozhou City environmental geological problems and countermeasures[J]. Ground Water,2020,42(4):126 − 128. (in Chinese with English abstract)
HUANG Duocheng, WANG Shoupei. A brief analysis of Bozhou city environmental geological problems and countermeasures[J]. Ground Water, 2020, 42(4): 126-128. (in Chinese with English abstract)
-

图(5)
表(5)
计量
- 文章访问数: 1638
- PDF下载数: 160
- 施引文献: 0