Determining safe yield and mapping water level zoning in groundwater resources of the Neishabour Plain
-
Abstract:
Groundwater is a crucial sources of water supply, especially in arid and semi-arid areas around the world. With uncontrolled withdrawals and limited availability of these resources, it is essential to determine the safe yield of these valuable resources. The Hill method approach was used in this study to determine the safe yield the Neishabour aquifer in Khorasan Razvi province in Iran. The results showed that the safe yield in the Neishabour aquifer is 60% lower than the current pumping amounts during the study period, indicating that further overdrafts could result in the destruction of this aquifer. This highlights the importance of using the Hill method to estimate the permitted exploitation from other aquifers, thus preventing problems caused by over-extraction and maintaining stability of global groundwater levels.
-
Key words:
- Hill method /
- Water level zoning maps /
- Groundwater pumping /
- Safe yield /
- Groundwater crisis
-

-
Table 1. Sum of pumping values and water level drop in the water years of the period
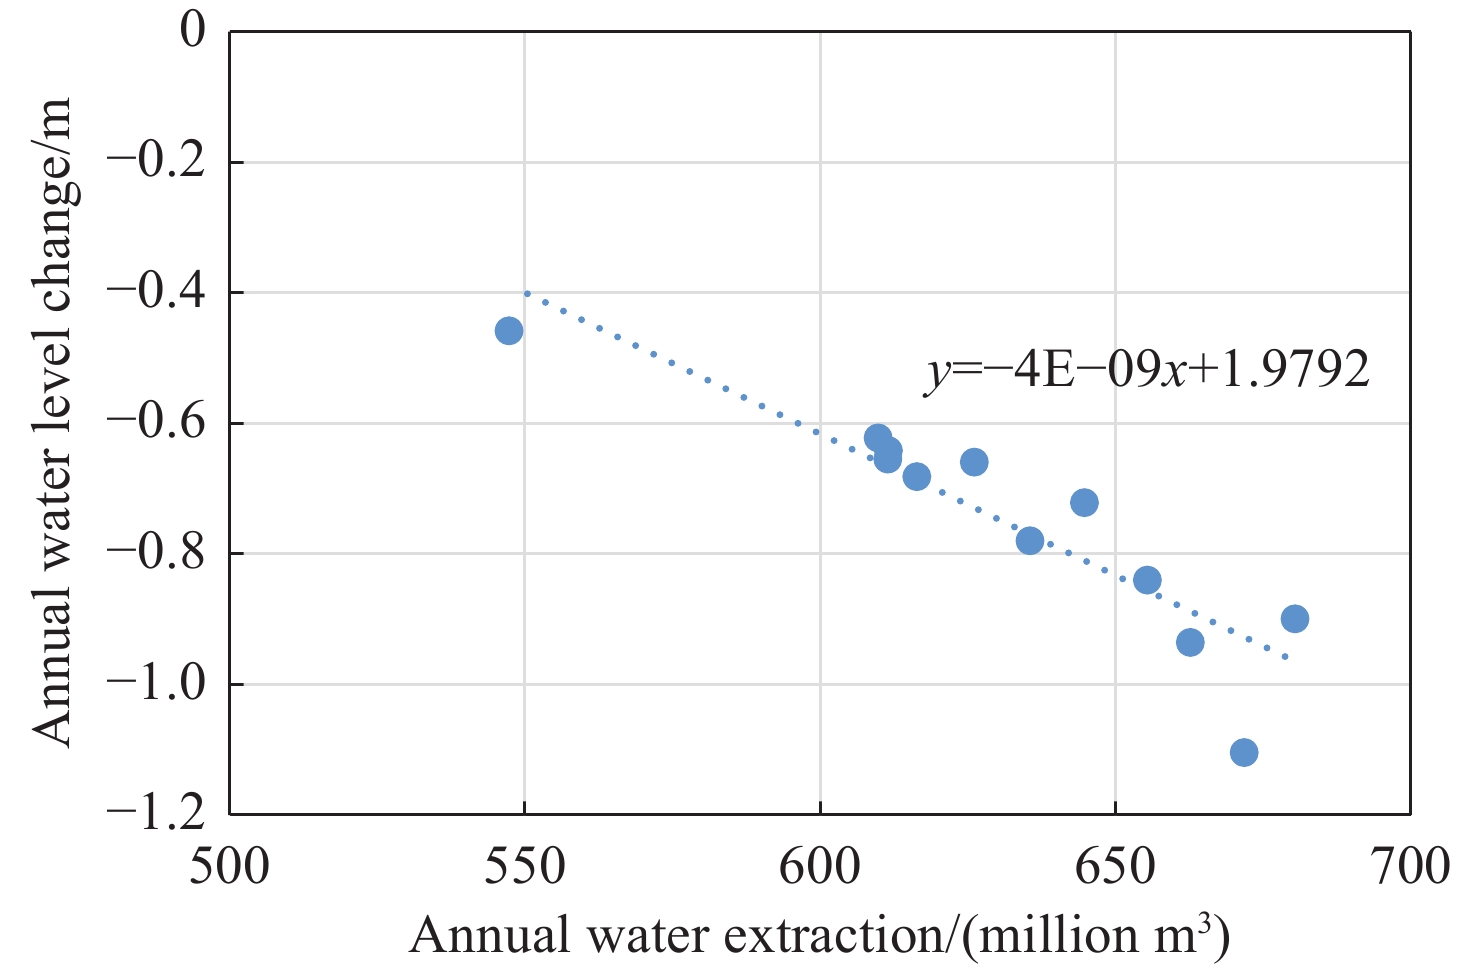
Water year Annual pumping (million m3) Annual water level change (m) 2000–2001 680.42 −0.90 2001–2002 671.82 −1.10 2002–2003 662.63 −0.93 2003–2004 655.39 −0.84 2005–2004 644.76 −0.72 2005–2006 635.54 −0.78 2006–2007 626.10 −0.66 2007–2008 616.36 −0.68 2008–2009 609.83 −0.62 2009–2010 611.46 −0.65 2010–2011 611.52 −0.64 2011–2012 547.29 −0.45 Table 2. Average annual pumping values of the period after reducing the pumping percentage compared to initial pumping values
Average annual pumping values of the period (million m3) The percentage of pumping reduction compared to existing (initial) values (%) 557.99 −10 495.83 −20 433.99 −30 371.99 −40 315.45 −50 245.84 −60 Table 3. Determination of safe yield from the obtained curve equation
Water year Annual pumping (million m3) Annual water level change (m) 2000–2001 680.42 −0.90 2001–2002 671.82 −1.10 2002–2003 662.63 −0.93 2003–2004 655.39 −0.84 2005–2004 644.76 −0.72 2005–2006 635.54 −0.78 2006–2007 626.10 −0.66 2007–2008 616.36 −0.68 2008–2009 609.83 −0.62 2009–2010 611.46 −0.65 2010–2011 611.52 −0.64 2011–2012 547.29 −0.45 From the curve equation to zero water level drop
494.8 0 Table 4. Determining the safe yield from the obtained line equation
The percentage of Pumping reduction compared to existing (initial) values (%) Average annual pumping values of the period (million m3) Average annual water level changes of the period (m) −10 557.99 −0.70 −20 495.83 −0.54 −30 433.99 −0.39 −40 371.99 −0.25 −50 315.45 −0.11 −60 245.84 +0.02 From the curve equation to zero water level drop
257.2 0 -
Akbari B, Hejazi A. 2017. The importance of water resources management in Iran with emphasis on groundwater. The 7th National Conference on Agriculture and Sustainable Natural Resources.
Alizadeh A, Izadi A, Davari K, et al. 2013. Estimation of actual evapotranspiration on a year-basin scale using SWAT. Iranian Journal of Irrigation and Drainage, 2: 243-258. https://www.sid.ir/paper/131662/fa
Alley William M, Stanley AL. 2004. The journey from safe yield to sustainability. Groundwater, 42(1): 12−16. DOI:10.1111/j.1745-6584.2004.tb02446.x.
Bredehoeft J. 1997. Safe yield and the water budget myth. Groundwater, 35(6): 929. DOI:10.1111/j.1745-6584.1997.tb00162.x.
Izadi A. 2013. Application and evaluation of a developed integrated model of groundwater-surface water in the Neishabour Basin. Ph. D. Dissertation in Water Science and Engineering, Faculty of Agriculture, Ferdowsi University of Mashhad.
Kalf FR, Woolley DR. 2005. Applicability and methodology of determining sustainable yield in groundwater systems. Hydrogeology Journal, 13: 295−312. DOI:10.1007/s10040-004-0401-x.
Kamran KV, Khorrami B, Roostaei S. 2018. Assessment of groundwater-level susceptibility to degradation based on analytical network process (ANP). International Journal of Environment and Geoinformatics, 5(3): 314−324. DOI:10.30897/ijegeo.451067.
Meyland SJ. 2011. Examining safe yield and sustainable yield for groundwater supplies and moving to managed yield as water resource limits become a reality. Department of Environmental Technology, New York Institute of Technology, USA, water resource management, 1: 813.
Meinzer E. 1923. Outline of groundwater hydrology, with definitions. Geological Survey, Water Supply: 494.
Naik P, Awasthi A. 2003. Groundwater resources assessment of the Koyna River basin, India. Hydrogeology Journal, 11: 582−594. DOI:10.1007/s10040-003-0273-5.
Nazarieh F. 2017. Development and evaluation of an integrated simulation model of surface flow, unsaturated, and saturated areas in the Neishabour plain. Ph. D. Dissertation in Water Science and Engineering, Faculty of Agriculture, Ferdowsi University of Mashhad. https://ganj.irandoc.ac.ir/#/articles/b8f1157641ec90c37f3a108914a1f435
Panahi Gh, Hassanzadeh Eskafi M, Faridhosseini A, et al. 2021 Physical–chemical evaluation of groundwater quality in semi-arid areas: Case study—Sabzevar plain, Iran. Sustainable Water Resources Management, 7: 99.
Sharp J. 2016. Sustainability of groundwater resources: Conceptual evolution, opportunities, & challenges. Session I: 2. DOI:10.1130/abs/2017SC-288962.
Wilson E. 2005. Safe Yield of an Aquifer. Water Encyclopedia, 5: 575−576. DOI:10.1002/047147844X.gw1006.
Yazdani, Mansoorian H. 2014. Zoning the exploitation potential of groundwater resources using quantitative and qualitative data of the Neishabour plain aquifer. Journal of Irrigation and Water Engineering, 15: 118. http://www.waterjournal.ir/article_70951.
-


 下载:
下载:
