

Estimating aquifer transmissivity using Dar-Zarrouk parameters to delineate groundwater potential zones in Alluri Seetharama Raju District, Andhra Pradesh, India
-
Abstract:
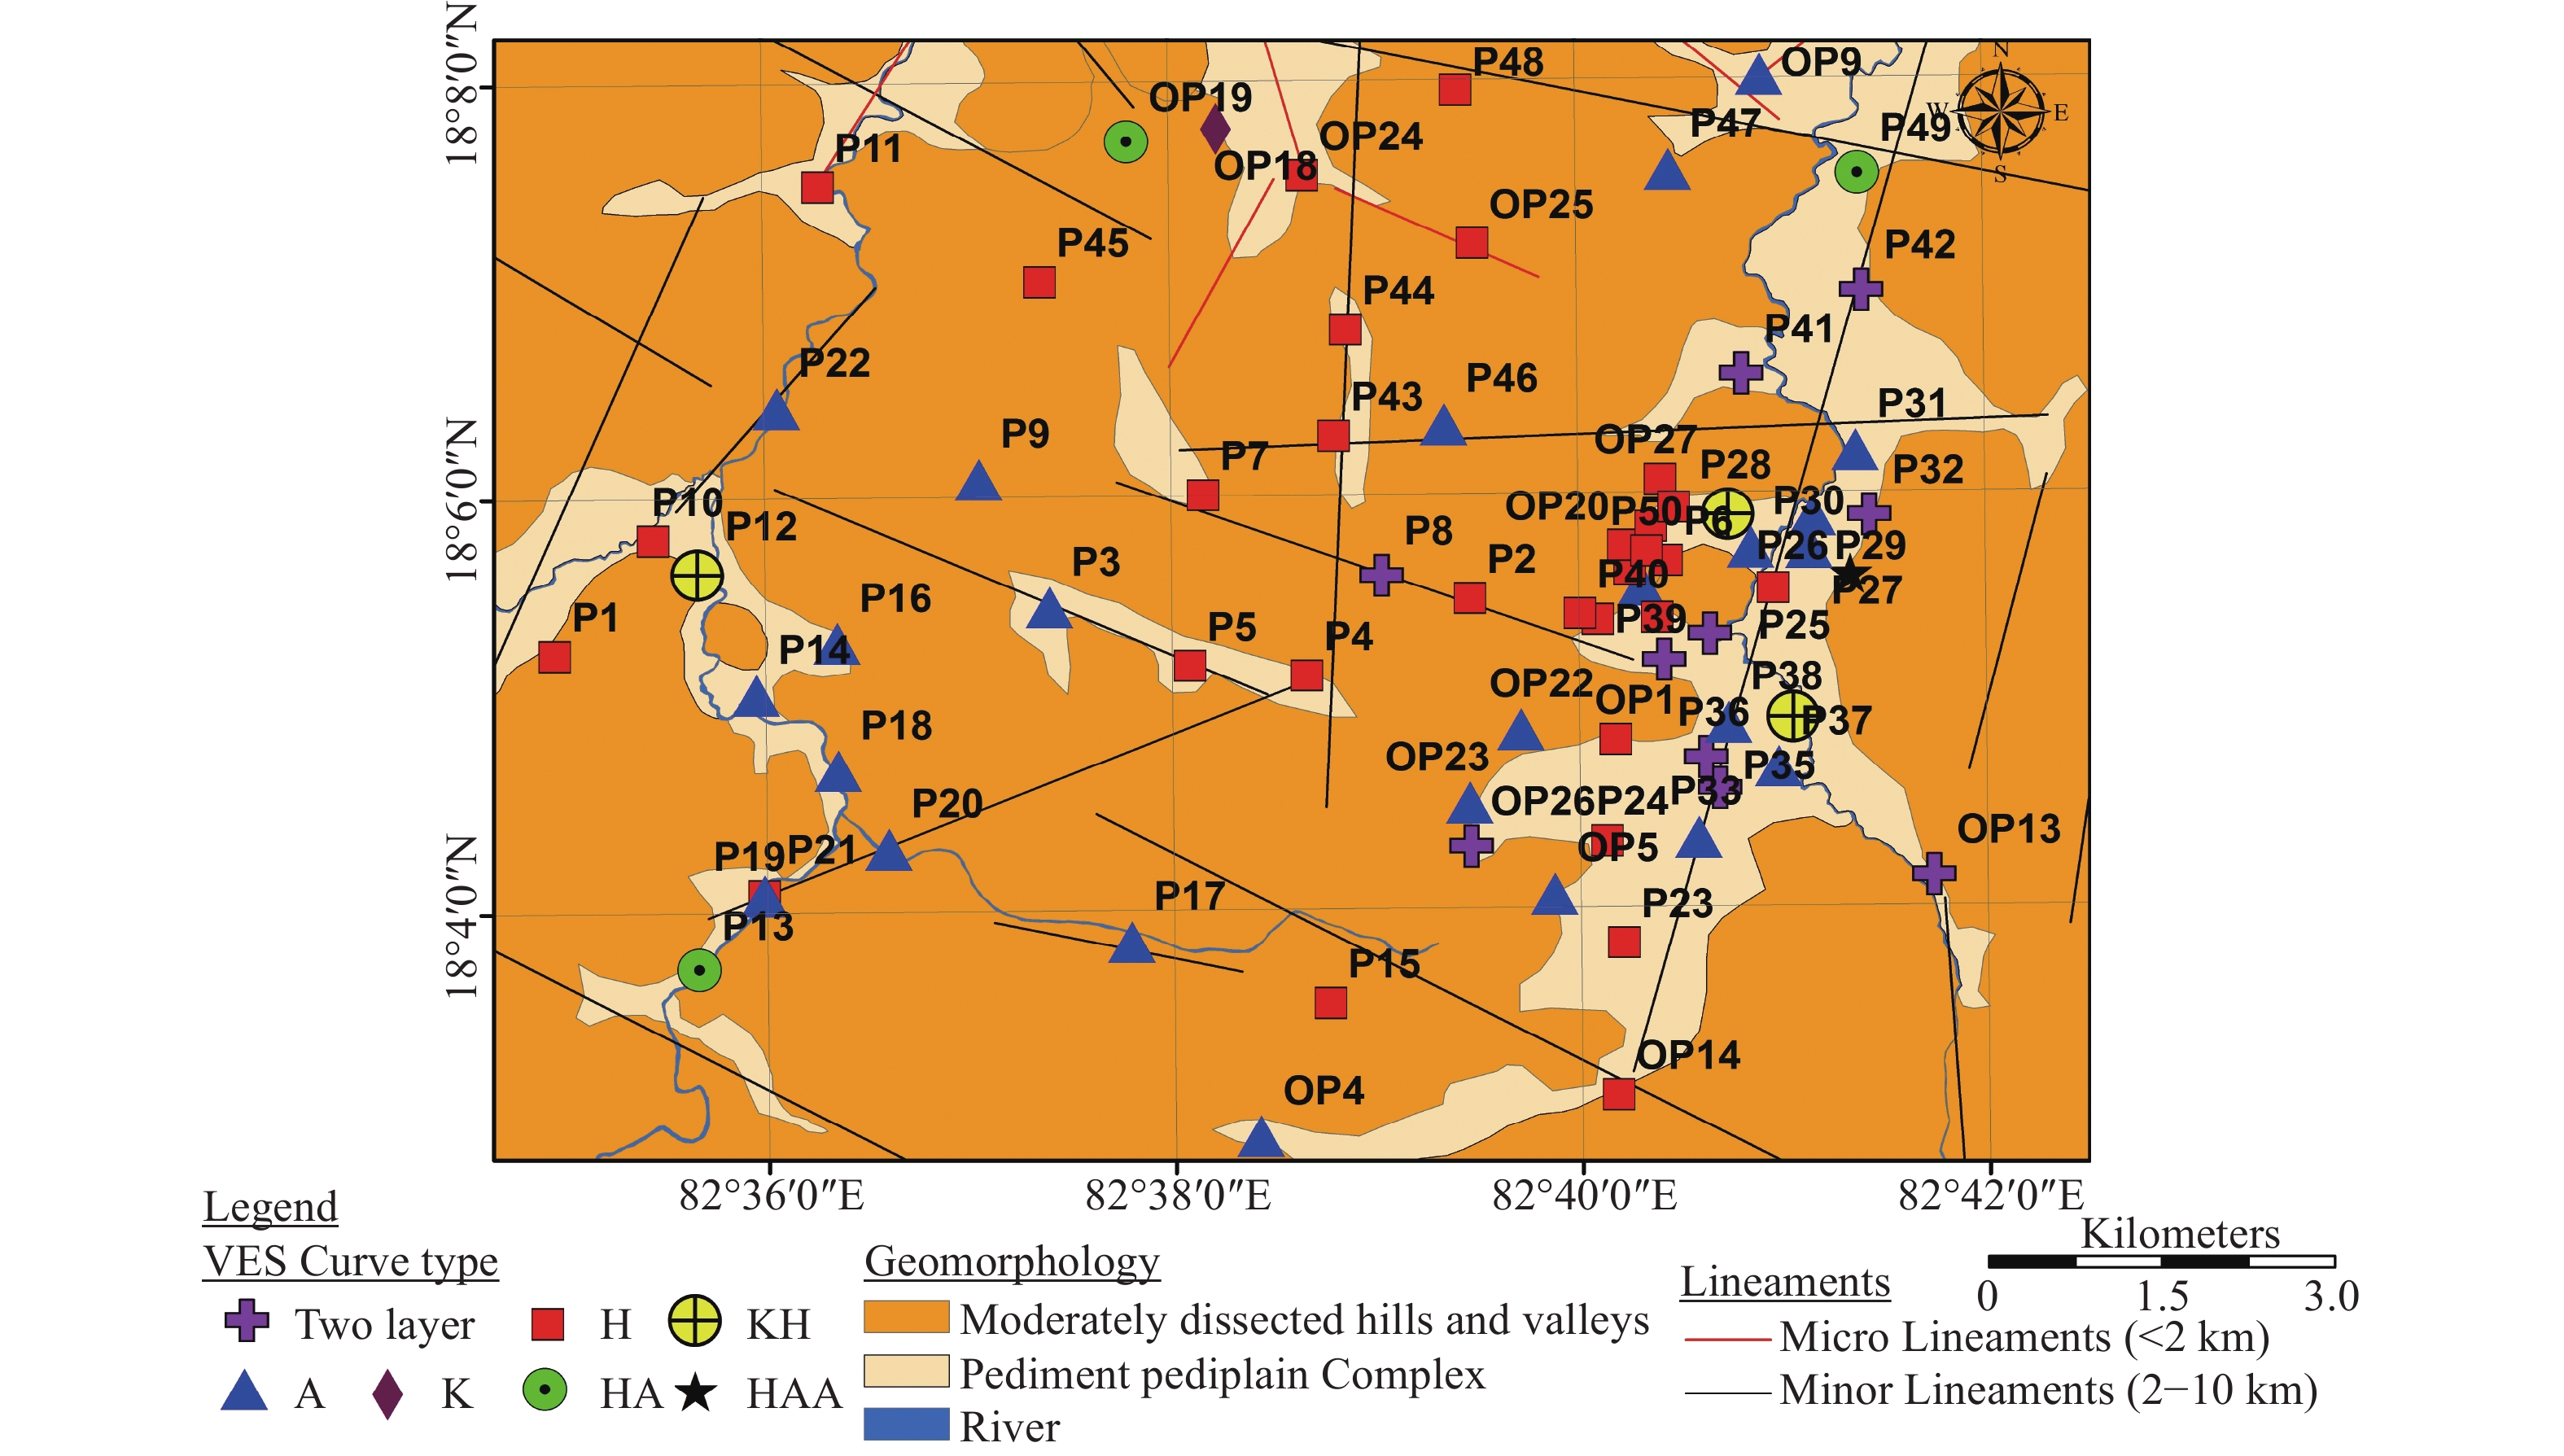
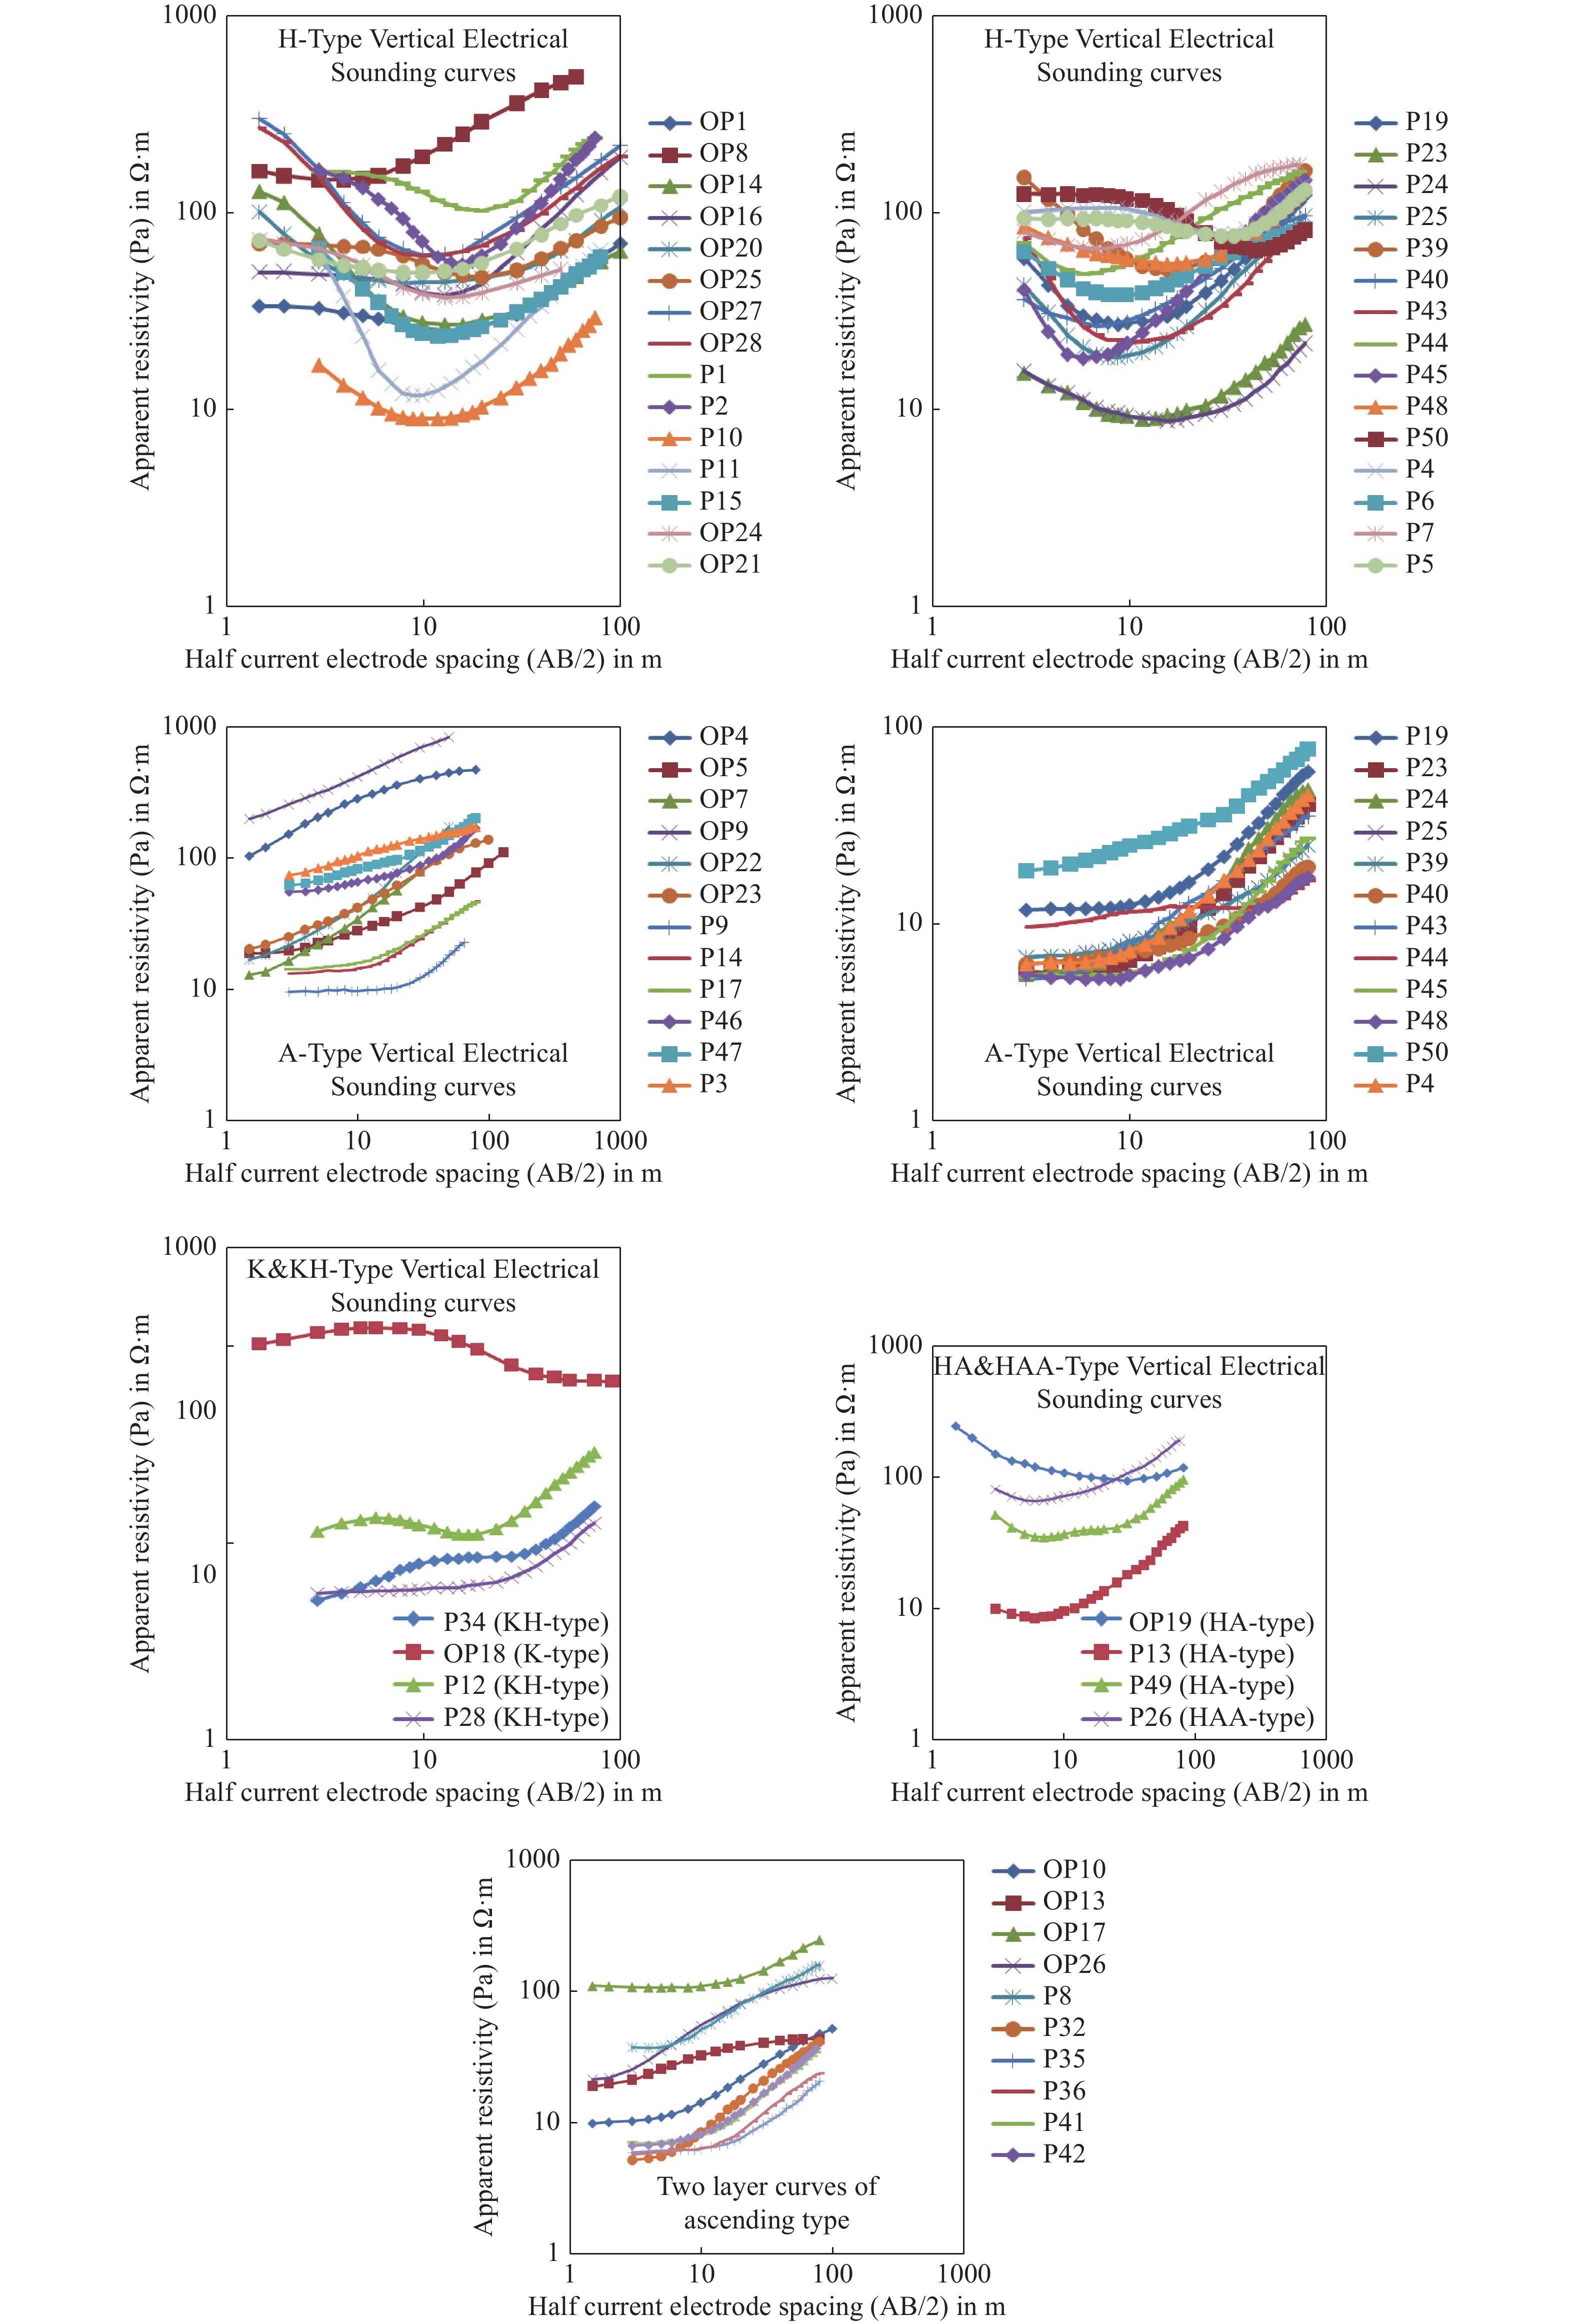
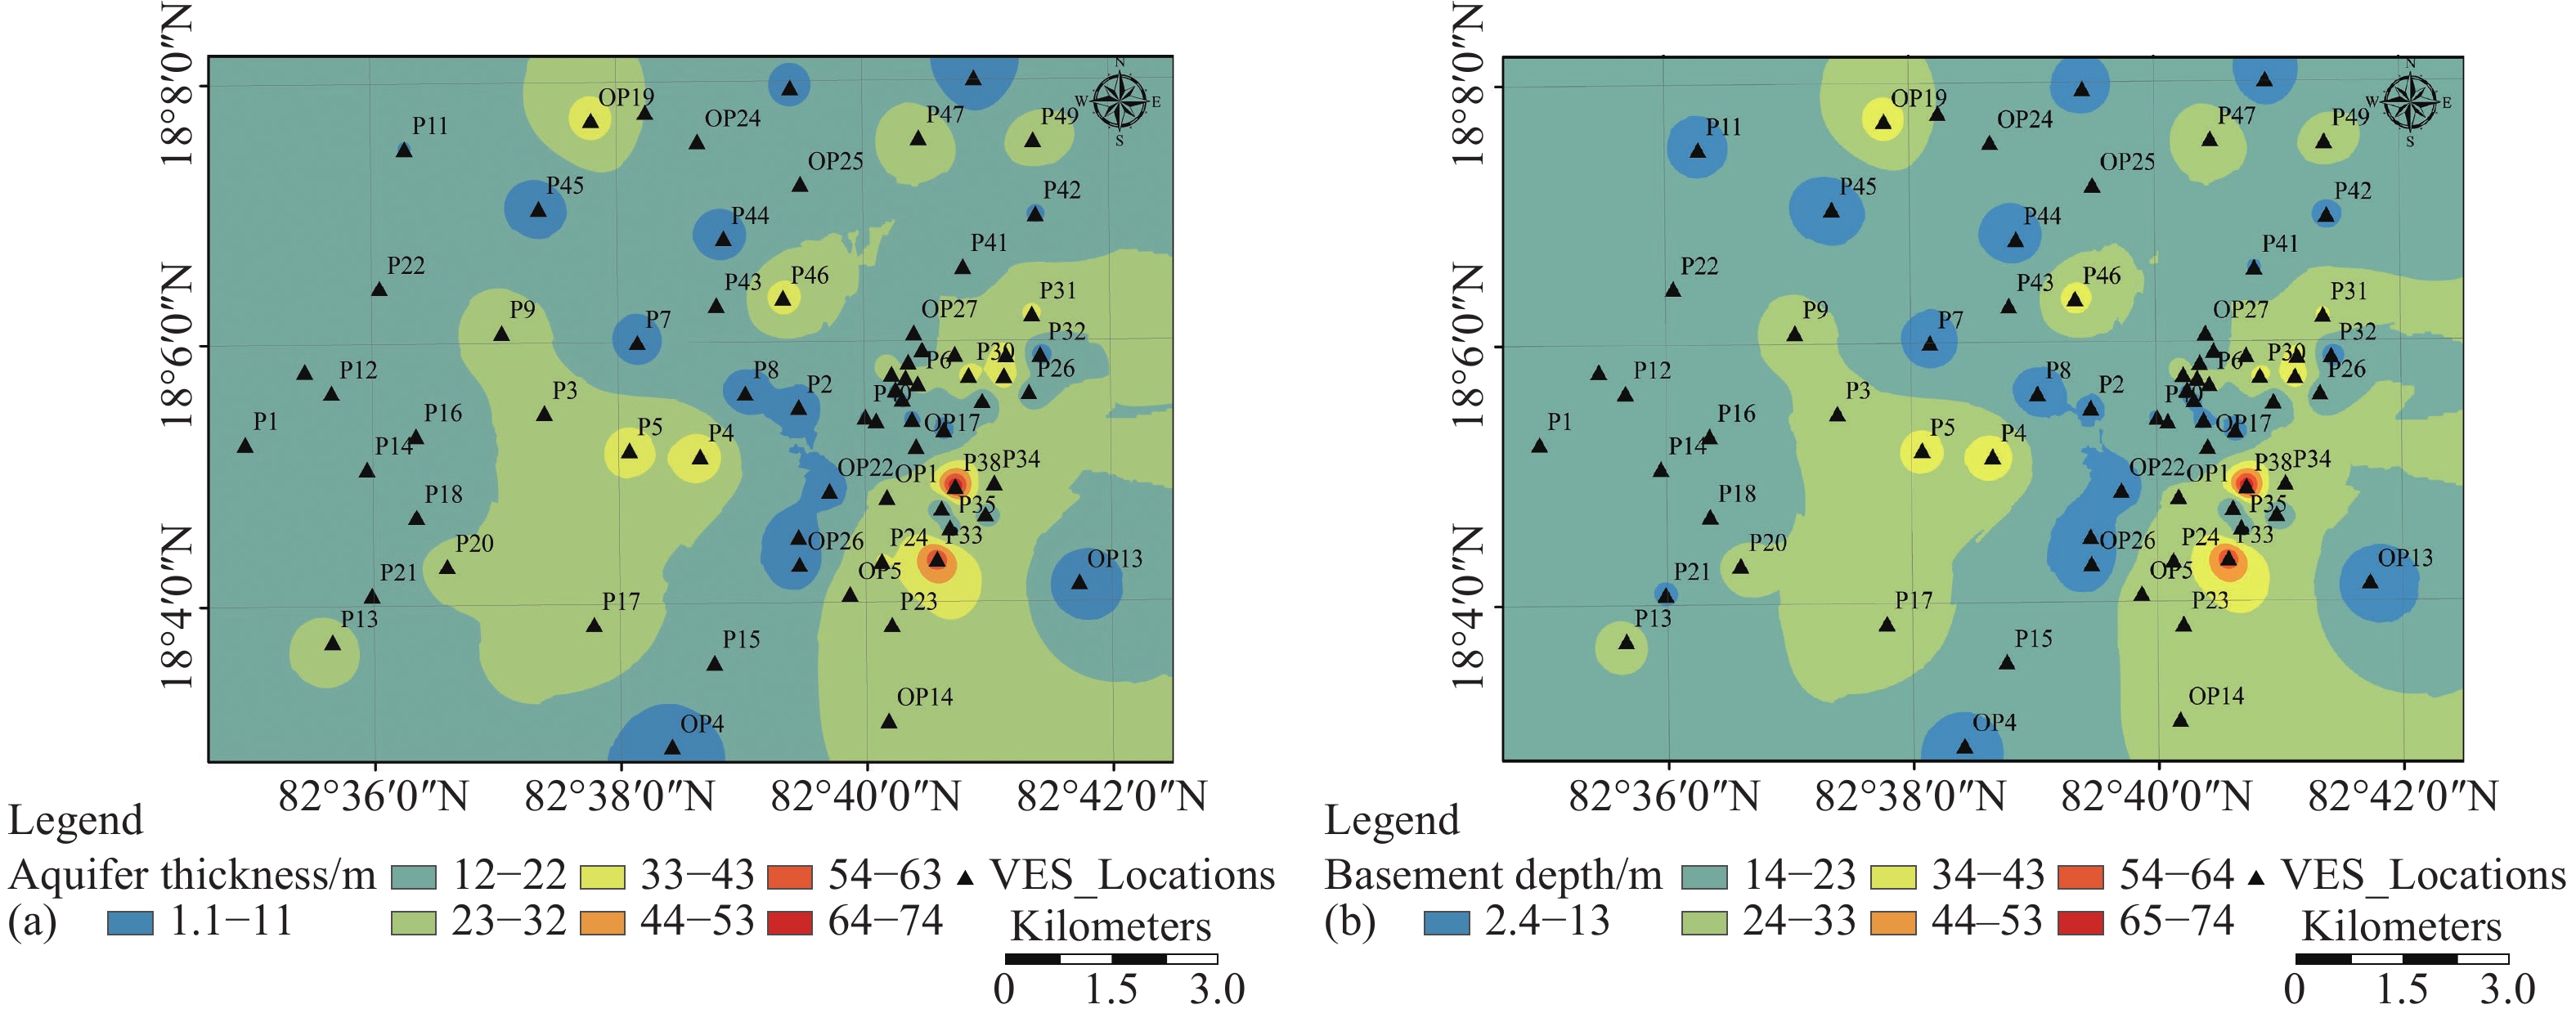
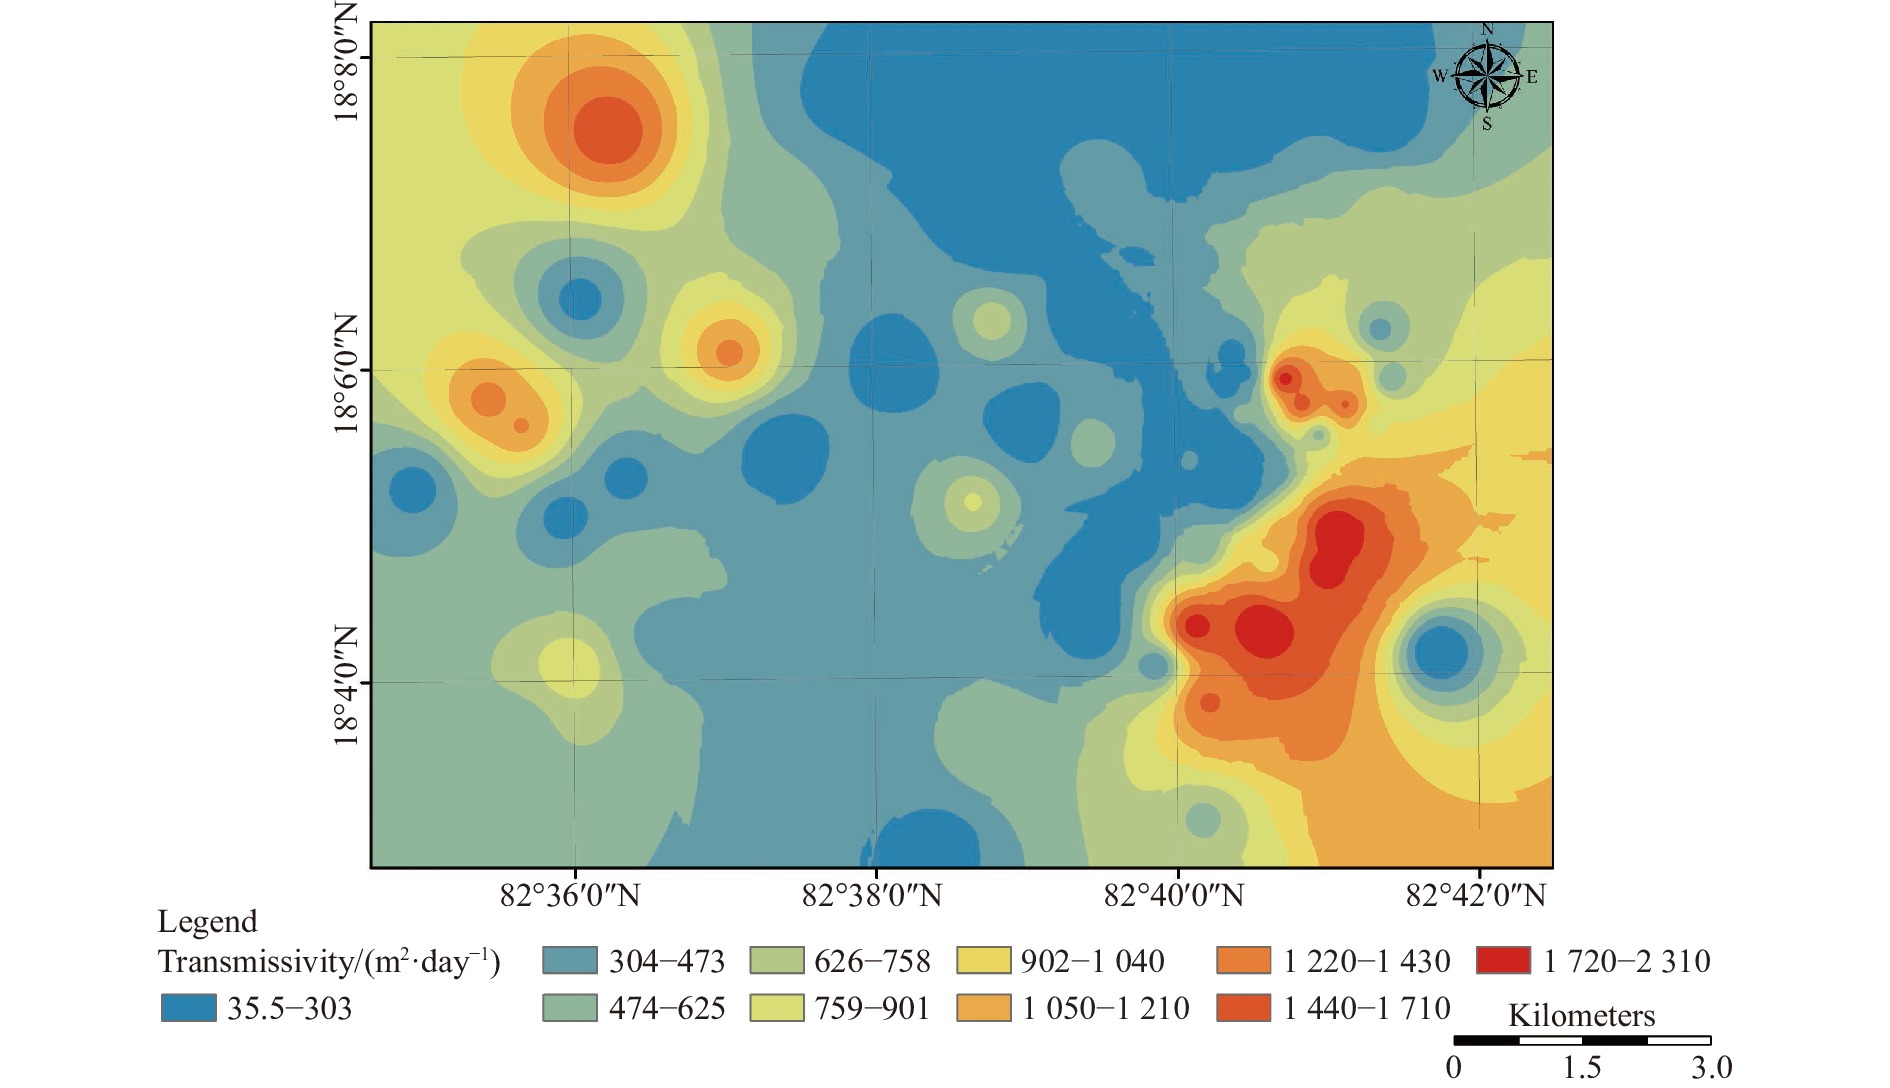
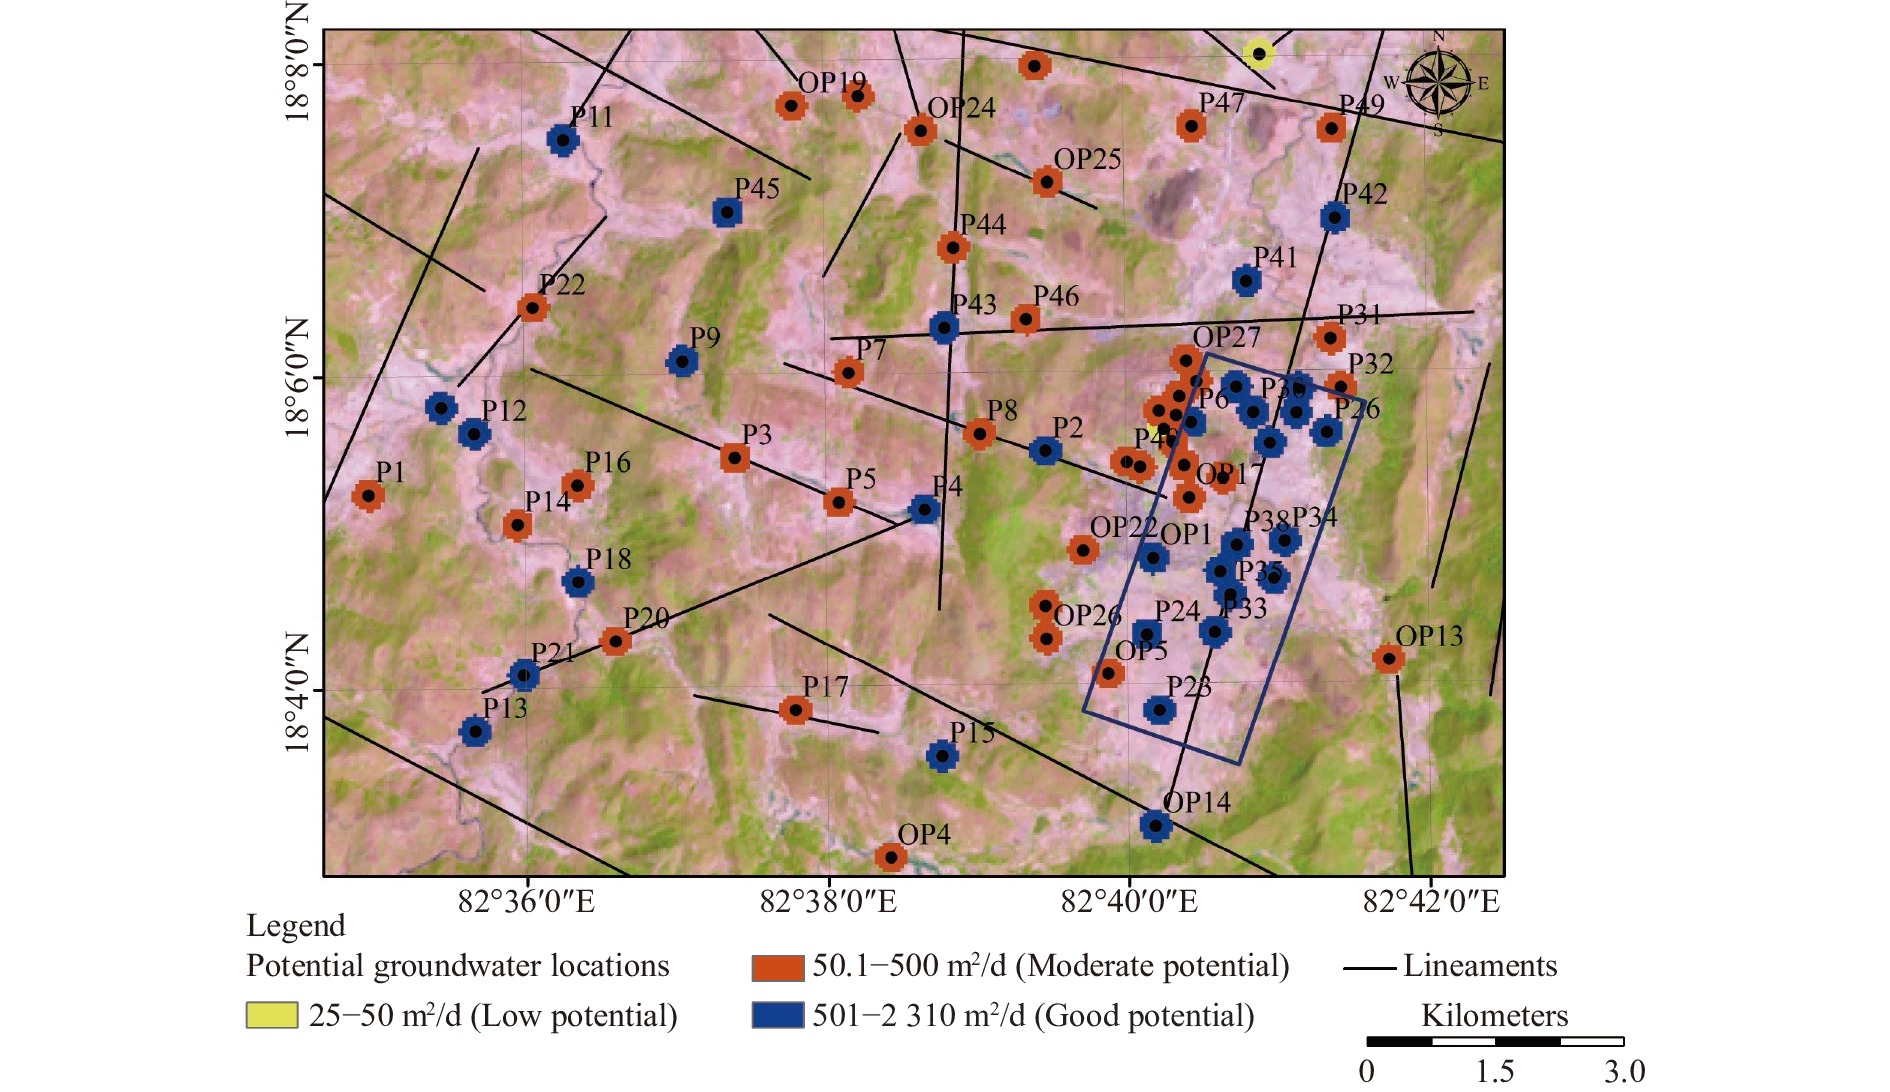
This study aimed to explore groundwater potential zones in the EGMB of Alluri Seetharama Raju district, Andhra Pradesh, India, for drinking and agriculture purposes. To achieve this goal, 72 Vertical Electrical Soundings (VES) were conducted using the Schlumberger electrode configuration. The resistivity sounding data were analyzed to determine the aquifer thickness, basement depth, Dar-Zarrouk parameters, and aquifer transmissivity. Spatial distribution maps were generated for these parameters to understand the subsurface formation. The analysis revealed a linear groundwater potential zone (8.46 km2) in the eastern part of the study area, extending in the NNE-SSW direction for 9.6 km. Six VES locations (P24, P27, P29, P30, P33, and P38) in this zone exhibit good potential (>30 m aquifer thickness), while the three VES locations (OP19, P5, and P46) in the central region are recommended for drilling bore wells. Additionally, moderate aquifer thickness (20–30 m) are identified in other VES locations (OP14, OP20, P4, P10, P12, P13, P15, P17, P18, P31, P46, and P50) along streams in the western and central part of the area, which can yield reasonable quantities of water. This information is useful for groundwater exploration and watershed management to meet the demands of tribal population in the study area.
-

-
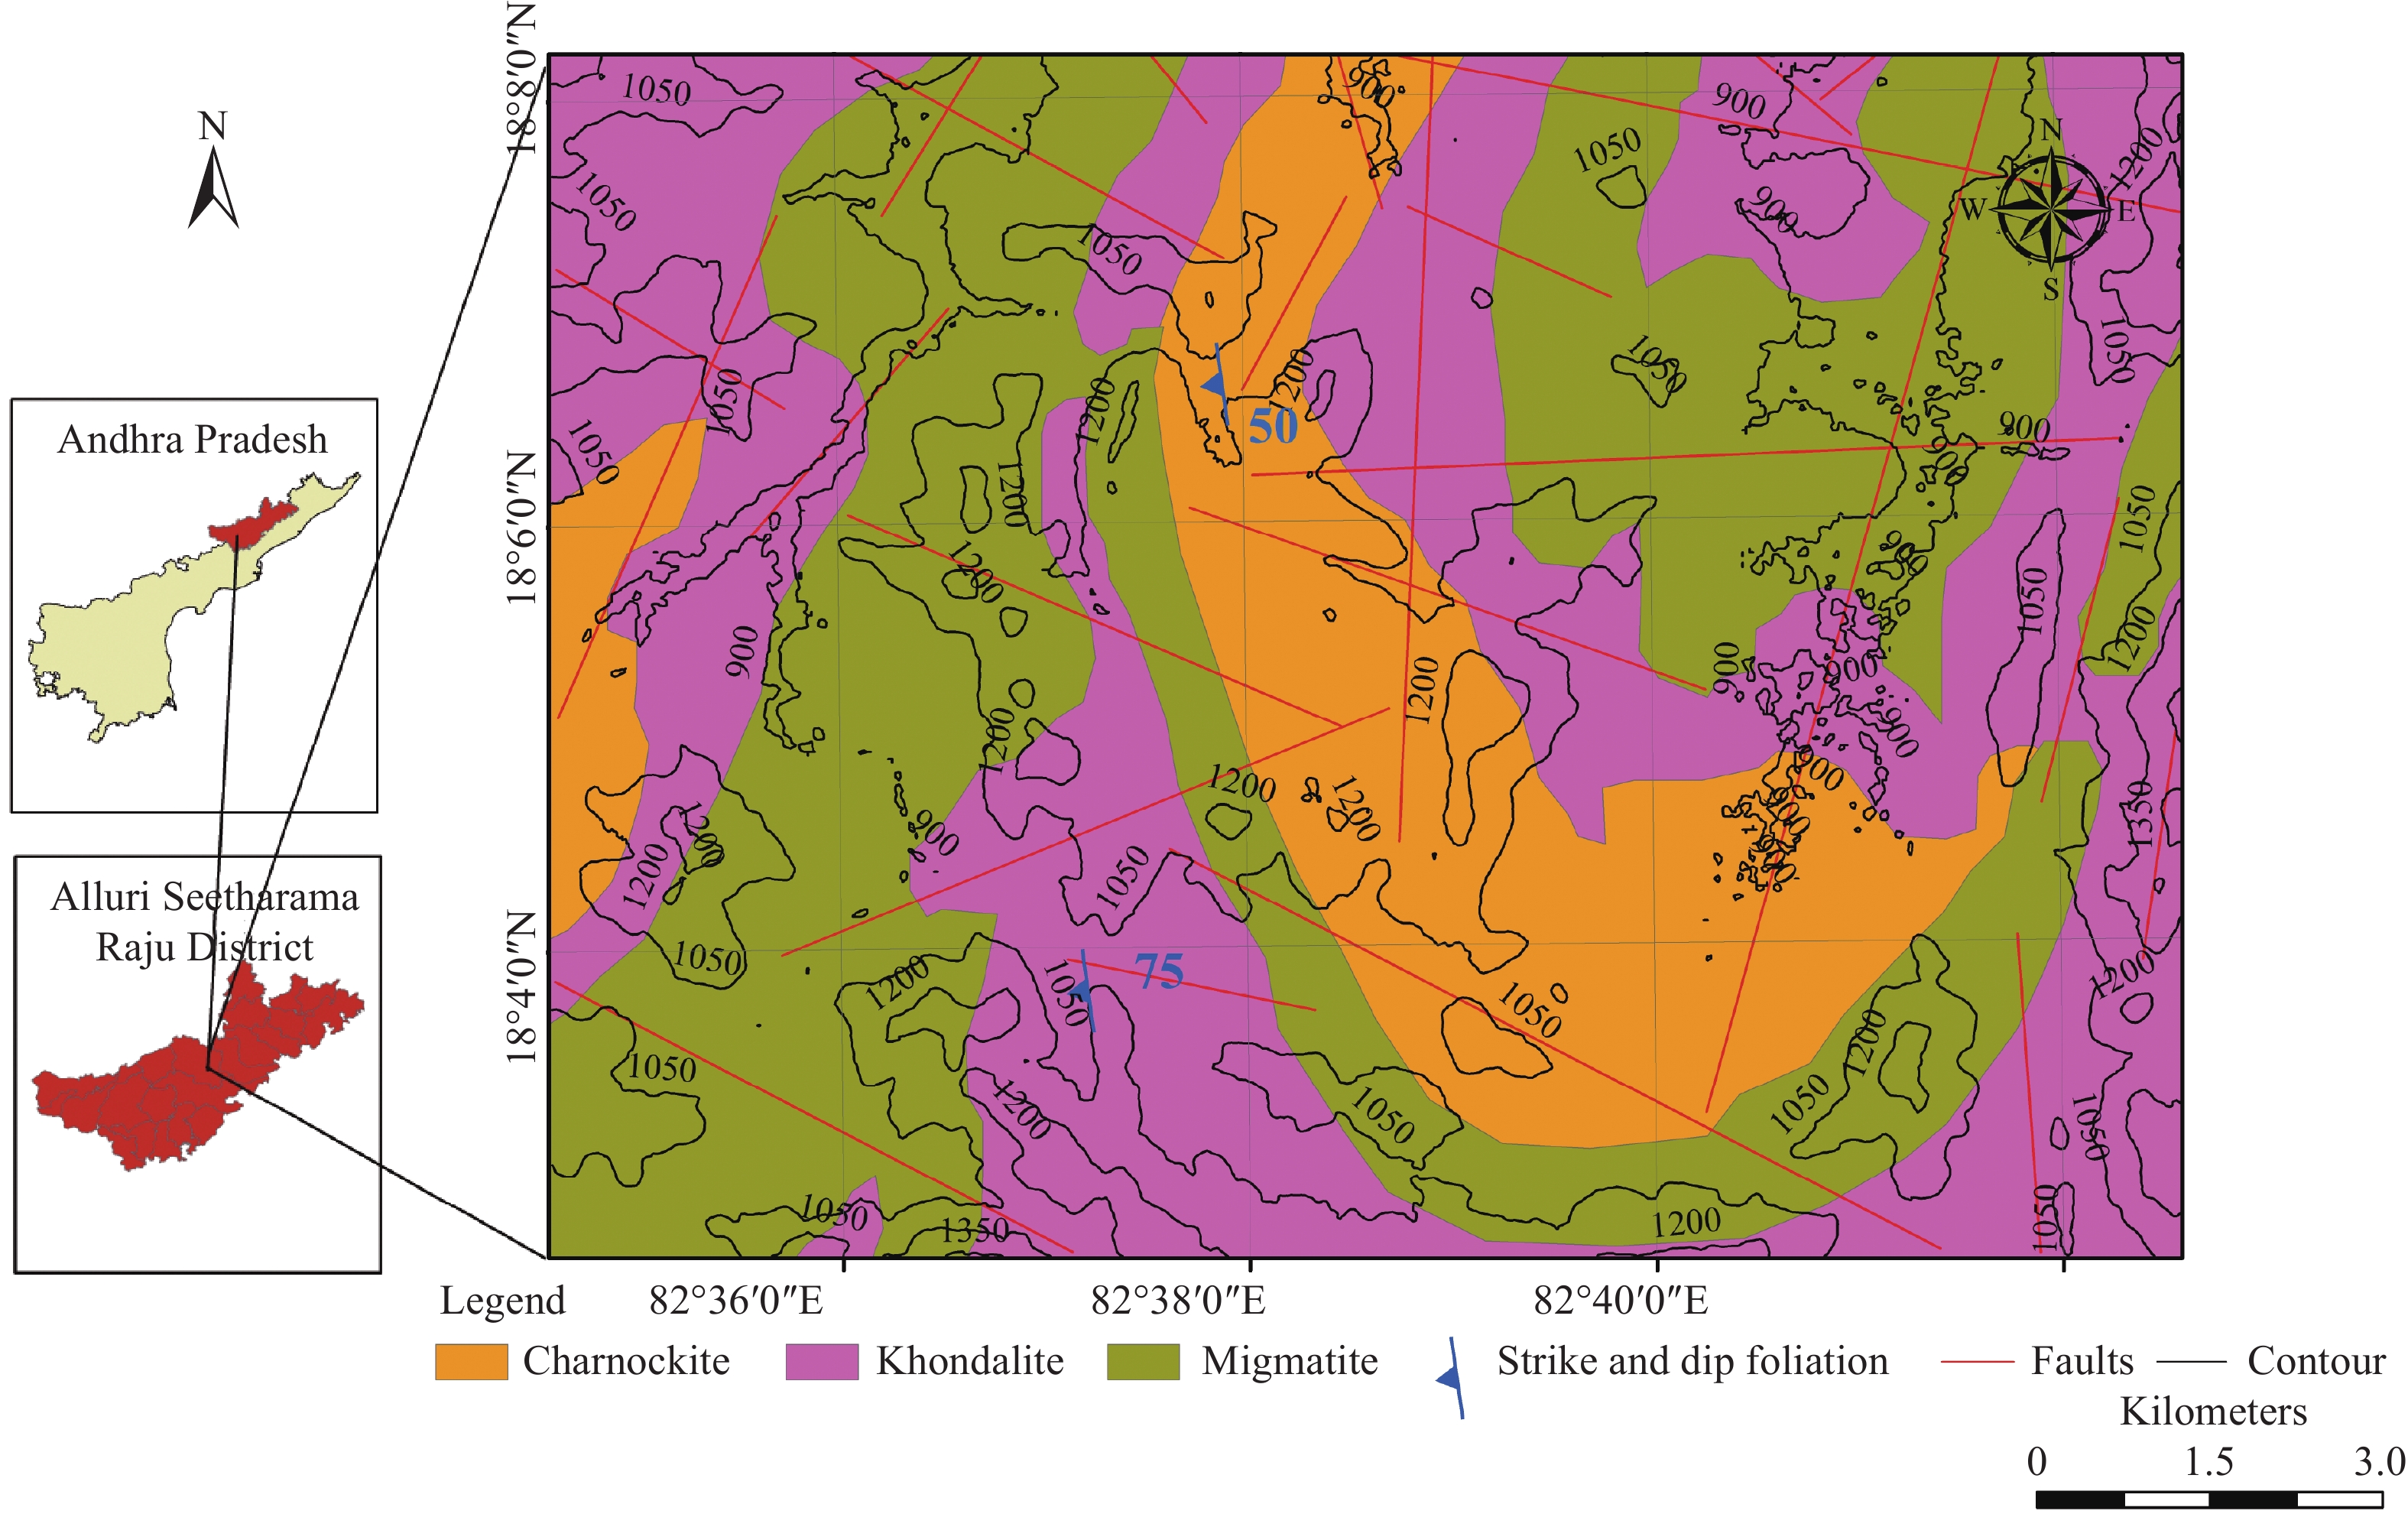
Table 1. Stratigraphic succession of geological formations in the study area
Geological formation Characteristics Migmatites Hard, Foliated rocks Charnockites (Basic, Acid, and intermediate) Hard, Massive rocks Khondalites Hard, Foliated rocks  下载: 导出CSV
Table 2. Classification of lineaments (Sitharam et al. 2006; Venkateswara et al. 2021)
No. Type of the lineament Length of the lineament No. Lineaments identified in the area 1 Medium 10–100 km - 2 Minor 2–10 km 16 3 Micro <2 km 06
下载: 导出CSV
Table 3. Rating of the protective capacity of aquifers (After Oladapo and Akintorinwa, 2007)
Total longitudinal conductance (Siemens) Protective capacity rating > 10 Excellent 5–10 Very good 0.7–4.9 Good 0.2–0.69 Moderate 0.1–0.19 Weak <0.1 Poor
下载: 导出CSV
Table 4. Interpreted layer parameters from VES data in the study area
VES code Latitude degrees Longitude degrees True resistivity Thickness Total
thickness
/mRMS
error
/%ρ 1
/Ω·mρ 2
/Ω·mρ 3
/Ω·mρ 4
/Ω·mρ 5
/Ω·mh 1
/mh 2
/mh 3
/m
h 4
/mOP1 18.08010 82.66956 34.0 22.9 194 2.60 21.30 23.90 0.539 OP4 18.03600 82.70123 81.8 350.0 495 1.06 6.39 7.45 0.485 OP5 18.06773 82.66445 18.8 39.3 308 3.18 25.30 28.48 0.789 OP7 18.09249 82.67175 11.8 38.1 307 1.59 6.16 7.75 0.951 OP8 18.09381 82.67082 178.0 134.0 636 0.75 5.41 6.16 0.432 OP9 18.18840 82.69879 176.0 402.0 1 075 1.19 5.87 7.06 0.759 OP10 18.08856 82.67734 10.3 67.8 6.90 6.90 0.436 OP13 18.06907 82.69553 19.0 44.0 2.34 2.34 0.831 OP14 18.04630 82.69276 148.0 25.5 125 1.40 23.10 24.50 0.921 OP16 18.09164 82.67108 49.9 9.83 1 818 5.57 3.52 9.09 1.060 OP17 18.09029 82.67393 109.0 425.0 18.50 18.50 0.971 OP18 18.12948 82.63722 229.0 361.0 148 0.89 7.03 7.92 0.535 OP19 18.12851 82.62985 365.0 121.0 89.2 188 0.75 4.69 31.00 36.44 0.719 OP20 18.09574 82.67031 154.0 42.8 392 0.75 30.70 31.45 1.180 OP21 18.09642 82.67066 82.1 47.7 183 0.90 17.00 17.9 0.938 OP22 18.08095 82.66179 15.3 40.0 1 423 1.36 6.66 8.02 1.540 OP23 18.07507 82.65756 18.7 41.3 180 1.35 6.98 8.33 0.909 OP24 18.12571 82.64424 74.2 30.6 64.4 2.38 10.20 12.58 0.581 OP25 18.12466 82.64470 70.1 35.9 150 4.81 16.00 20.81 0.741 OP26 18.07412 82.65808 20.6 133.0 2.43 2.43 1.020 OP27 18.10106 82.67337 357.0 55.9 478 1.28 15.70 16.98 1.990 OP28 18.10011 82.67347 329.0 55.9 473 1.24 18.80 20.04 0.728 P1 18.08917 82.58722 165.0 63.79 934 5.41 13.50 18.91 1.460 P2 18.09028 82.65444 177.0 25.6 14 755 3.59 8.12 11.71 4.340 P3 18.09056 82.63889 70.4 145.3 209 3.16 23.10 26.26 0.522 P4 18.09110 82.64111 122.0 39.5 313 10.80 28.90 39.70 1.220 P5 18.09110 82.63944 91.7 49.6 4051 10.90 25.10 36.00 0.635 P6 18.09389 82.67363 102.0 38.0 1 558 11.40 16.50 27.90 0.711 P7 18.09911 82.64000 89.2 45.3 214 1.97 5.08 7.05 0.752 P8 18.09389 82.65410 36.3 199.0 6.37 6.37 1.870 P9 18.09667 82.60694 9.76 3000 27.40 27.40 1.220 P10 18.09667 82.59083 30.0 8.20 276 1.30 19.00 20.30 2.050 P11 18.09306 82.59472 143.0 9.00 450 1.40 10.00 11.40 1.590 P12 18.09389 82.59444 14.2 41.0 9.11 2 000 1.50 2.58 11.10 15.18 0.869 P13 18.06806 82.59970 12.7 6.55 17.7 3 201 1.54 3.87 19.50 24.91 1.600 P14 18.08417 82.59917 13.4 30.8 101 10.80 7.78 18.58 0.894 P15 18.08000 82.60722 94.7 21.3 132 1.75 18.00 19.75 1.780 P16 18.08028 82.60639 6.23 16.3 1591 9.52 4.25 13.77 1.910 P17 18.07833 82.60389 14.5 39.4 109 9.91 21.10 31.01 0.631 P18 18.07972 82.60361 11.8 8787 16.10 16.10 1.040 P19 18.06806 82.59972 123.0 24.5 3 000 1.20 16.20 17.40 2.240 P20 18.06917 82.60694 17.7 31.4 432 3.21 22.20 25.41 1.030 P21 18.06806 82.59972 5.63 3000 11.50 11.50 1.900 P22 18.09639 82.59667 5.59 20.6 3 480 7.36 7.55 14.91 3.630 P23 18.07056 82.67139 19.2 8.33 581 1.69 23.50 25.19 1.440 P24 18.07111 82.67194 18.8 8.25 2390 1.81 30.90 32.71 1.450 P25 18.09361 82.68692 68.7 14.2 761 1.50 10.50 12.00 1.430 P26 18.09333 82.68889 82.0 15.4 17.2 19.2 885 1.56 1.79 3.06 10.80 17.21 0.616 P27 18.09667 82.68611 5.58 13.0 593 3.61 40.00 43.61 0.545 P28 18.09778 82.68556 6.87 14.7 6.8 1 284 3.28 2.01 21.20 26.49 1.460 P29 18.09806 82.68583 6.74 13.0 1 284 5.93 29.80 35.73 1.000 P30 18.09778 82.68639 6.36 10.3 3 232 6.97 30.70 37.67 1.070 P31 18.10056 82.69083 5.19 37.2 131 5.18 29.10 34.28 0.532 P32 18.09972 82.69111 5.02 84.8 5.60 5.60 2.220 P33 18.07612 82.67821 9.31 12.0 652 1.78 59.40 61.18 2.160 P34 18.08182 82.68410 6.26 27.2 7.09 3161 2.80 4.27 17.20 24.27 2.020 P35 18.07611 82.67806 6.18 62.9 17.50 17.50 1.560 P36 18.07861 82.67694 5.89 60.0 12.50 12.50 1.450 P37 18.07722 82.67861 5.36 18.3 890 15.20 2.66 17.86 2.620 P38 18.07722 82.67822 5.34 25.6 890 14.70 59.20 73.90 2.440 P39 18.09056 82.66750 178.0 43.3 13 105 2.14 22.00 24.14 3.000 P40 18.09028 82.66670 44.9 21.9 161 1.50 8.55 10.05 1.870 P41 18.10944 82.68010 7.14 124.0 11.80 11.80 1.440 P42 18.11083 82.68018 6.91 129.0 10.70 10.70 2.200 P43 18.10472 82.64667 190.0 19.5 6 000 1.20 18.00 19.20 2.190 P44 18.10500 82.64778 93.6 34.3 203 1.50 5.39 6.89 2.230 P45 18.10472 82.61220 152.0 13.8 1 278 1.00 6.70 7.70 2.120 P46 18.10500 82.65222 54.4 82.8 9 659 4.13 32.90 37.03 0.721 P47 18.14111 82.69000 59.4 103.0 714 3.10 26.20 29.30 0.617 P48 18.14440 82.69000 87.5 31.0 97.3 1.50 8.57 10.07 0.350 P49 18.14111 82.69000 107.0 46.6 96.5 665 1.50 2.55 22.20 26.25 1.110 P50 18.09528 82.67220 94.7 50.0 3 144 1.92 29.10 31.02 1.360
下载: 导出CSV
Table 5. Resistivity range of subsurface layers (After Venkateswara et al. 2019b)
No Resistivity (Ω·m) Formation 1 <10 Clayey sand/highly weathered/highly saturated formation 2 10–60 Weathered formations 3 61–150 Semi-weathered/fractured formation 4 > 150 Hard rock
下载: 导出CSV
Table 6. Secondary geoelectrical parameters and transmissivity values
VES
codeLatitude degrees Longitude degrees Longitudinal
conductance
(S)/siemensTransverse
resistance (T)/Ωm2Anisotropy
(λ)Longitudinal
resistivity
(ρl)/Ω·mTransverse
resistivity
(ρt)/Ω·mAquifer transmissivity
(Tr)/m2/dOP1 18.08010 82.66956 1.01 576.17 1.01 23.74 24.11 523.91 OP4 18.03600 82.70123 0.03 2323.21 1.14 238.66 311.84 180.34 OP5 18.06773 82.66445 0.81 1054.07 1.03 35.03 37.01 337.46 OP7 18.09249 82.67175 0.30 253.46 1.12 26.14 32.70 86.16 OP8 18.09381 82.67082 0.04 858.44 1.00 138.16 139.36 35.50 OP9 18.18840 82.69879 0.02 2569.18 1.05 330.47 363.91 45.36 OP10 18.08856 82.67734 0.67 71.07 1.00 10.30 10.30 302.75 OP13 18.06907 82.69553 0.12 44.46 1.00 19.00 19.00 58.00 OP14 18.04630 82.69276 0.92 796.25 1.10 26.77 32.50 588.14 OP16 18.09164 82.67108 0.47 312.54 1.33 19.35 34.38 63.07 OP17 18.09029 82.67393 0.17 2016.50 1.00 109.00 109.00 89.87 OP18 18.12948 82.63722 0.02 2741.64 1.01 339.04 346.17 67.66 OP19 18.12851 82.62985 0.39 3606.44 1.03 93.83 98.97 236.81 OP20 18.09574 82.67031 0.72 1429.46 1.02 43.55 45.45 388.07 OP21 18.09642 82.67066 0.37 884.79 1.01 48.73 49.43 194.80 OP22 18.08095 82.66179 0.26 287.21 1.07 31.40 35.81 88.86 OP23 18.07507 82.65756 0.24 313.52 1.04 34.54 37.64 91.19 OP24 18.12571 82.64424 0.37 488.72 1.06 34.43 38.85 253.77 OP25 18.12466 82.64470 0.51 911.58 1.04 40.46 43.80 347.62 OP26 18.07412 82.65808 0.12 50.06 1.00 20.60 20.60 55.85 OP27 18.10106 82.67337 0.28 1334.59 1.15 59.70 78.60 216.24 OP28 18.10011 82.67347 0.34 1458.88 1.11 58.93 72.80 236.38 P1 18.08917 82.58722 0.24 1753.82 1.09 77.37 92.75 220.16 P2 18.09028 82.65444 0.34 843.30 1.44 34.70 72.02 618.20 P3 18.09056 82.63889 0.20 3578.89 1.03 128.81 136.29 91.52 P4 18.09110 82.64111 0.82 2459.15 1.13 48.40 61.94 779.60 P5 18.09110 82.63944 0.62 2244.49 1.04 57.61 62.35 458.22 P6 18.09389 82.67363 0.55 1789.80 1.12 51.10 64.15 611.49 P7 18.09911 82.64000 0.13 405.85 1.05 52.52 57.57 98.73 P8 18.09389 82.65410 0.18 231.23 1.00 36.30 36.30 86.31 P9 18.09667 82.60694 2.81 267.42 1.00 9.76 9.76 1264.15 P10 18.09667 82.59083 2.36 194.80 1.06 8.60 9.60 1289.37 P11 18.09306 82.59472 1.12 290.20 1.58 10.17 25.46 1604.52 P12 18.09389 82.59444 1.39 228.20 1.17 10.94 15.03 1232.45 P13 18.06806 82.59970 1.81 390.06 1.07 13.73 15.66 583.50 P14 18.08417 82.59917 1.06 384.34 1.09 17.55 20.69 197.08 P15 18.08000 82.60722 0.86 549.13 1.10 22.87 27.80 574.35 P16 18.08028 82.60639 1.79 128.58 1.10 7.70 9.34 225.57 P17 18.07833 82.60389 1.22 975.04 1.11 25.44 31.44 310.62 P18 18.07972 82.60361 1.36 189.98 1.00 11.80 11.80 622.27 P19 18.06806 82.59972 0.67 544.50 1.10 25.93 31.29 434.52 P20 18.06917 82.60694 0.89 753.90 1.02 28.60 29.67 372.42 P21 18.06806 82.59972 2.04 64.75 1.00 5.63 5.63 886.42 P22 18.09639 82.59667 1.68 196.67 1.22 8.86 13.19 219.43 P23 18.07056 82.67139 2.91 228.20 1.02 8.66 9.06 1465.24 P24 18.07111 82.67194 3.84 288.95 1.02 8.51 8.83 1890.23 P25 18.09361 82.68692 0.76 252.15 1.15 15.76 21.01 577.46 P26 18.09333 82.68889 0.73 674.97 1.29 23.65 39.22 862.81 P27 18.09667 82.68611 3.72 540.14 1.03 11.71 12.39 1467.18 P28 18.09778 82.68556 3.73 196.24 1.02 7.10 7.41 1865.21 P29 18.09806 82.68583 3.17 427.37 1.03 11.26 11.96 1160.85 P30 18.09778 82.68639 4.08 360.54 1.02 9.24 9.57 1535.85 P31 18.10056 82.69083 1.78 1109.40 1.30 19.25 32.36 394.94 P32 18.09972 82.69111 1.12 28.11 1.00 5.02 5.02 480.38 P33 18.07612 82.67821 5.14 729.37 1.00 11.90 11.92 2312.66 P34 18.08182 82.68410 3.03 255.62 1.15 8.01 10.53 2241.18 P35 18.07611 82.67806 2.83 108.15 1.00 6.18 6.18 1236.57 P36 18.07861 82.67694 2.12 73.63 1.00 5.89 5.89 923.76 P37 18.07722 82.67861 2.98 130.15 1.10 5.99 7.29 1959.43 P38 18.07722 82.67822 5.07 1594.02 1.22 14.59 21.57 1168.54 P39 18.09056 82.66750 0.52 1333.52 1.09 46.41 55.24 353.98 P40 18.09028 82.66670 0.42 254.60 1.03 23.71 25.33 252.37 P41 18.10944 82.68010 1.65 84.25 1.00 7.14 7.14 728.73 P42 18.11083 82.68018 1.55 73.94 1.00 6.91 6.91 681.29 P43 18.10472 82.64667 0.93 579.00 1.21 20.66 30.16 718.29 P44 18.10500 82.64778 0.17 325.28 1.09 39.79 47.21 135.47 P45 18.10472 82.61220 0.49 244.46 1.42 15.65 31.75 591.63 P46 18.10500 82.65222 0.47 2948.79 1.01 78.24 79.63 223.59 P47 18.14111 82.69000 0.31 2882.74 1.01 95.58 98.39 143.34 P48 18.14440 82.69000 0.29 396.92 1.07 34.30 39.42 201.00 P49 18.14111 82.69000 0.30 2421.63 1.02 87.85 92.25 136.58 P50 18.09528 82.67220 0.60 1636.82 1.01 51.50 52.77 329.02
下载: 导出CSV
Table 7. Aquifer classification based on the transmissivity values (Offodile, 1983; Venkateswara et al. 2022)
Transmissivity (Tr)
/m2/dClassification of aquifers No of sounding points based on Tr value >500 Good potential 31 50–500 Moderate potential 39 5–50 Low potential 02 0.5–5 Very low potential - <0.5 Negligible potential -
下载: 导出CSV
-
Ammar AI, Kruse SE. 2016. Resistivity soundings and VLF profiles for siting groundwater wells in a fractured basement aquifer in the Arabian shield, Saudi Arabia. Journal of African Earth Sciences, 116: 5667. DOI:10.1016/j.jafrearsci.2015.12.020.
Anandagajapathi RB, Venkateswara RP, Subrahmanyam M. 2020. Integration of GIS and remote sensing in groundwater investigations: A case study from Visakhapatnam District, India. Journal of India Geophysics Union, 24(5): 50−63.
Ankidawa B, Ishaku J, Hassan A. 2019. Estimation of aquifer transmissivity using Dar-Zarrouk parameters derived from resistivity soundings on the floodplain of river Dadin kowa, Gombe state, Northeastern Nigeria. Computer Engineering Physics Model, 1(4): 36−52. DOI:10.22115/cepm.2018.129584.1024.
Anudu GK, Onuba LN, Ufondu LS. 2011. Geo-electric sounding for groundwater exploration in the crystalline basement terrain around onipe and adjoining areas, Southwestern Nigeria. Journal of Applied Technology in Environmental Sanitation, 1: 343−354.
Atakpo EA. 2013. Aquifer vulnerability investigation using geo-electric method in parts of sapele local government area of delta state, Nigeria. Nigerian Journal of Basic Application Science, 21(1): 11−19. DOI:10.4314/njbas.v21i1.2.
Awni T, Batayneh. 2013. The estimation and significance of Dar-Zarrouk parameters in the exploration of quality affecting the Gulf of Aqaba coastal aquifer systems. Journal of Coast Conservation, 17: 623−635. DOI:10.1007/S11852-013-02614.
Ayolabi EA, Folorunso AF, Oloruntola MO. 2010. Constraining causes of structural failure using electrical resistivity tomography (ERT): A case study of Lagos, Southwestern, Nigeria. Mineral Wealth, 156(4): 7−18. DOI:10.3997/2214-4609-pdb.175.SAGEEP109.
Bobachev A. 2003. Resistivity sounding interpretation IPI2WIN: Version 3.0. 1, A7. 01. 03. Moscow State University.
CGWB. 2019. Groundwater brochure Visakhapatnam district, Andhra Pradesh, central ground water board, Ministry of water resources, government of India.
Danso SY, Ma Y. 2023. Geospatial techniques for groundwater potential zones delineation in a coastal municipality, Ghana. The Egyptian Journal of Remote Sensing and Space Science, 26(1): 75−84. DOI:https://doi.org/10.1016/j.ejrs.2022.12.004.
Deng QJ, Wei LI, Zhu QJ, et al. 2020. An analysis of the characteristics of water storage structure and the practice of groundwater exploration in the basalt area of Zhangbei County, Bashang, Hebei Province. Geological Bulletin of China, 39(12): 1899−1907.
Dor N, Syafalni S, Abustan I, et al. 2011. Verification of surface-groundwater connectivity in an irrigation canal using geophysical, water balance and stable isotope approaches. Water Resource Manage, 25: 2837–2853.
Elango L. 2014. Hydraulic conductivity issues, determinations and application. Croatia Environmental Processes, 1: 613−616. DOI:10.1007/s40710-000337.
Fashae OA, Tijani MN, Talabi AO, et al. 2014. Delineation of groundwater potential zones in the crystalline basement terrain of SW-Nigeria: An integrated GIS and remote sensing approach. Journal of Applied Water Science, 4: 19–38.
GSI. 2001. District resource map, geological survey of India. Visakhapatnam district, Andhra Pradesh, India.
Gumilar UN, Andi AN, Pulung AP, et al. 2023. Analysis of groundwater potential zones using Dar-Zarrouk parameters in Pangkalpinang city, Indonesia. Environment, Development and Sustainability, 25: 1876−1898. DOI:10.1007/s10668-021-02103-7.
Gupta G, Patil SN, Padmane ST, et al. 2015. Geoelectric investigation to delineate groundwater potential and recharge zones in Suki river basin, north Maharashtra. Journal of Earth System Science, 124(7): 1487−1501. DOI:10.1007/s12040-015-0615-4.
Gupta G, Vinit CE, Saumen M. 2012. Geo-electrical investigation for potential groundwater zones in parts of Ratnagiri and Kolhapur districts, Maharashtra. Journal of India Geophysics Union, 9(1): 27−38.
Hamzah U, Samudin AR, Malim EP. 2007. Groundwater investigation in Kuala Selang or using vertical electric sounding (VES) surveys. Environmental Geology, 51: 1349–1359.
Heigold PC, Gilkeson RH, Cartwright K, et al. 1979. Aquifer transmissivity from surficial electrical methods. Ground Water, 17(4): 338−345. DOI:10.1111/J.1745-6584.1979.Tb03326.X.
Kang X, Shi X, Deng Y, et al. 2018. Coupled hydro-geophysical inversion of DNAPL source zone architecture and permeability field in a 3D heterogeneous sandbox by assimilation time-lapse cross-borehole electrical resistivity data via ensemble kalman filtering. Journal of Hydrology, 567: 149−164. DOI:10.1016/J.JhydrOl.2018.10.019.
Kumar TJR, Balasubramanian A, Kumar RS, et al. 2016. Assessment of groundwater potential based on aquifer properties of hard rock terrain in the Chittar–Uppodai watershed, Tamil Nadu, India. Applied Water Science, 6: 179−186. DOI:10.1007/s13201-014-0216-4.
Loke MH, Chambers JE, Rucker DF, et al. 2013. Recent developments in the direct-current geo-electrical imaging method. Journal of Applied Geophysics, 95: 135−156. DOI:10.1016/J.Japp.geo.2013.02.017.
Maillet R. 1947. The fundamental equations of electrical prospecting. Geophysics, 12(4): 529−556. DOI:10.1190/1.1437342.
Maja B, Andrej S, Ivan KC, et al. 2020. Characterization of aquifers in metamorphic rocks by combined use of electrical resistivity tomography and monitoring of spring hydrodynamics. Geosciences, 10: 137. DOI:10.3390/Geosciences10040137.
Obiora DN, Ibuot JC, George JN. 2016. Evaluation of aquifer potential, geo-electric and hydraulic parameters in Ezza north, southeastern Nigeria, using geo-electric sounding. International Journal of Environmental Science and Technology, 13: 435−444. DOI:10.1007/S13762-015-0886-Y.
Offodile MI. 1983. The occurrence and exploitation of groundwater in Nigeria basement complex. Journal of Mining Geology, 20(3): 131−146.
Oladapo MI, Akintorinwa OJ. 2007. Hydrogeophysical study of Ogbese southwestern Nigeria. Global Journal of Pure Applied Science, 13(1): 55–61.
Olasehinde, PI, Bayewu OO. 2011. Evaluation of electrical resistivity anisotropy in Geological mapping: A case study of Odo area, west central Nigeria. African Journal of Environmental Science and Technology, 5(7): 553−566. DOI:10.4314/ajest.v5i7.72045.
Orellana E, Mooney HM. 1966. Master curves for Schlumberger arrangement. Madrid, P. 34.
Oteri AU. 1981. Geo-electric investigation of saline contamination of chalk aquifer by mine drainage water at Tilmanstone, England. Geoexploration, 19(3): 179–192.
Rustadi, Darmawan IGB, Haerudin N, et al. 2022. Groundwater exploration using integrated geophysics method in hard rock terrains in Mount Betung Western Bandar Lampung, Indonesia. Journal of Groundwater Science and Engineering, 10(1): 10−18. DOI:10.19637/j.cnki.2305-7068.2022.01.002.
Sathiyamoorthy M, Madhavi G. 2018. Delineation of groundwater potential and recharge zone using electrical resistivity method around Veeranam Tank, Tamil Nadu, India. Journal of the Institution of Engineers (India), Series A 99.4 (2018): 637-645.
Seker UE, Efe S. 2023. Comparative economic analysis of air conditioning system with groundwater source heat pump in general-purpose buildings: A case study for kayseri. Renewable Energy, 204: 372−381.
Shailaja G, Gupta G, Suneetha N, et al. 2019. Assessment of aquifer zones and its protection via second-order geo-electric indices in parts of drought-prone region of deccan volcanic province, Maharashtra, India. Journal of Earth System Science, 128: 78.
Singh S, Gautam PK, Kumar P, et al. 2021. Delineating the characteristics of saline water intrusion in the coastal aquifers of Tamil Nadu, India by analyzing the Dar-Zarrouk parameters. Contributions to Geophysics and Geodesy, 51(2): 141-163.
Singh CL, Singh SN. 1970. Some geo-electrical investigations for potential groundwater in part of Azamgrah area of UP. Pure and Applied Geophysics, 82: 270–85.
Sitharam TG, Anbazhagan P, Ganesha Raj K. 2006. Use of remote sensing and seismotectonic parameters for seismic hazard analysis of Bangalore. Natural Hazards and Earth System Science, 6: 927–939.
Sitharam TG, Anbazhagan P. 2007. Seismic hazard analysis for the Bangalore region. Natural Hazards, 40: 261−278.
Sri N, Singhal DC. 1981. Estimation of aquifer transmissivity from Dar-Zarrouk parameters in porous media. Journal of Hydrology, 50: 393−399. DOI:10.1016/0022-1694(81)90082-2.
Subramanian TS, Marykutty A. 2019. Computation of aquifer parameters using geo-electrical techniques for the north Chennai coastal aquifer. Indian Journal of Geo Marine Sciences, 48: 1298-1306. https://doi.org/10.1007/s10668-021-02103-7
Subrahmanyam M, Venkateswara Rao P. 2017a. A note on the advantages of converting schlumberger VES data into radial dipole VES data. Journal of Geophysics, 28(4): 248−257.
Subrahmanyam M, Venkateswara RP. 2017b. Delineation of groundwater potential zones using geo-electrical surveys in SSW part of Yeleru river basin, East Godavari District, Andhra Pradesh. Journal of Indian Geophysics Union, 21(6): 465−473.
Suneetha NG, Gupta G, Shailaja G, et al. 2021. Spatial behavior of the Dar-Zarrouk parameters for exploration and differentiation of water bodies aquifers in parts of konkan coast of Maharashtra, India. Journal of Coastal Conservation, 25: 11. DOI:10.1007/S11852-021-00807-6.
Todd KD. 1980. Groundwater Hydrology, Third Ed. New York, John Wiley and Sons: 636.
Venkateswara RP, Subrahmanyam M, Ratnakar D. 2019a. Performance evaluation of different interpretation techniques of vertical electrical sounding data. Journal of Indian Geophysics Union, 23(1): 55−68.
Venkateswara RP, Subrahmanyam M, Ramdas P. 2019b. Delineation of groundwater potential zones in hard rock basement terrains of EastGodavari District, Andhra Pradesh, India. Journal of Indian Geophysics Union, 23(5): 408−419.
Venkateswara RP, Mangalampalli S, Bakuru AR. 2021. Groundwater exploration in hard rock terrains of East Godavari District, Andhra Pradesh, India using AHP and WIO analyses together with geoelectrical surveys. AIMS Geosciences, 7(2): 243−266. DOI:10.3934/geosci.2021015.
Venkateswara RP, Mangalampalli S, Bakuru AR. 2022. Investigation of groundwater potential zones in hard rock terrains along EGMB, India, using remote sensing, geoelectrical and hydrological parameters. Acta Geophysica,
Zohdy AAR. 1965. The auxiliary point method of electrical sounding interpretation and its relationship to the Dar-Zarrouk parameters. Geophysics, 30: 644−660. DOI:10.1190/1.1439636.
Zohdy AAR, Eaton GP, Mabey DR. 1974. Application of surface geophysics to groundwater investigations, US Geology Survey. Technology Water Resource Investigation: 116.
Zohdy AAR. 1989. A new method for the automatic interpretation of Schlumberger and Wenner sounding curves. Geophysics, 54: 245−253. DOI:10.1190/1.1442648.
-

图(7)
表(7)
计量
- 文章访问数: 1887
- PDF下载数: 118
- 施引文献: 0