

Automatic recognition method of urban underground silt based on remote sensing image—a case of Anqing City
-
摘要:
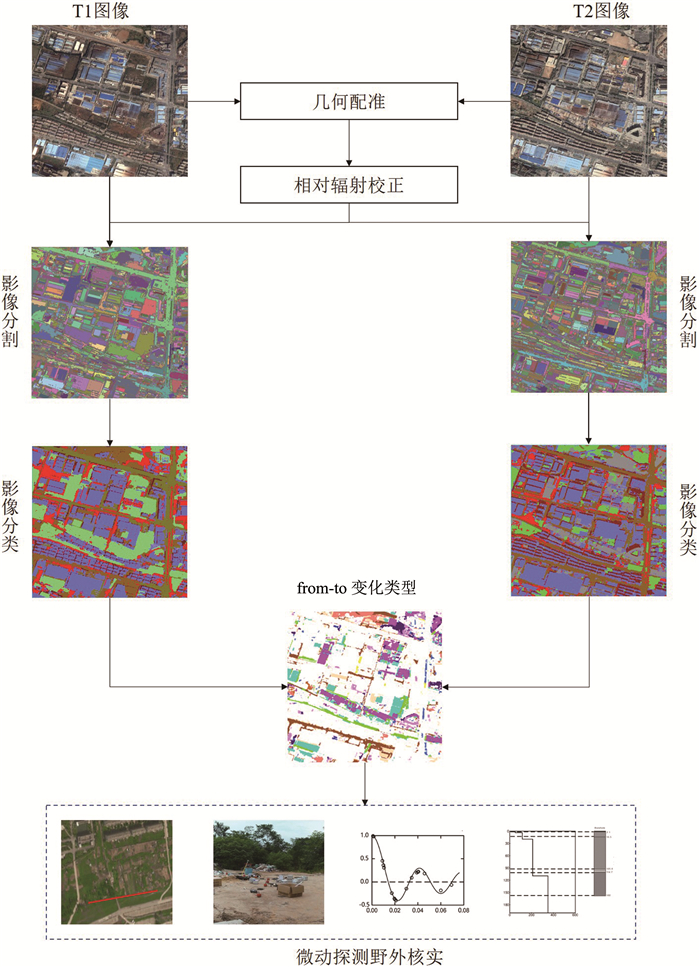
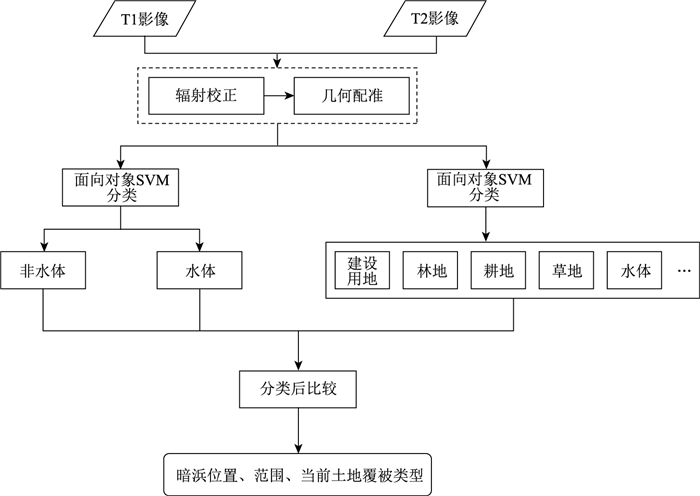
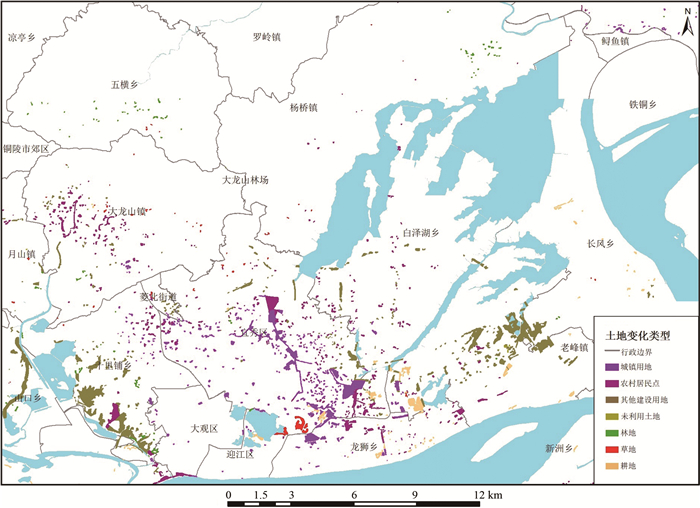
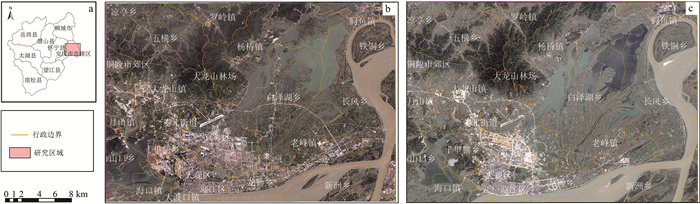
沟塘河渠可能由于各种原因被填埋而形成暗浜,对城市的工程建设造成质量隐患。相比于传统的探测暗浜的方法,如物探、微动探测技术,遥感监测具有监测范围广、效率高、可重复观测等优势。利用遥感图像变化检测方法提取安庆市城区暗浜空间位置与范围,基于面向对象的图像分析方法,分别对多时相影像进行先分割,进而利用SVM算法进行监督分类,得到研究区的多时相影像土地覆盖分类结果。基于2期图像分类结果,进行变化检测分析,提取暗浜的空间分布与范围,并选择典型区域利用微动探测进行实地验证。提出的城区暗浜提取方法能够为城市工程建设与城市规划提供决策支持,并且为实施物探划定出靶区或重点区域,提高物探工作效率。
Abstract:Underground silt, due to complex and loose compound, is a potential threat in urban infrastructure.Compared with the traditional methods of detecting underground silt, such as geophysical and micro-motion detection technology, remote sensing monitoring has the advantages of wide monitoring range, high efficiency and repeatability. The detection method of remote sensing image change was used to extract the spatial location and area of underground silt in urban area of Anqing. The method was mainly based on the object-oriented image analysis method, first splitting the multi-temporal images separately, and then using the SVM algorithm to classify the land cover. Based on the classification results, the spatial distribution of underground silt was extracted by change detection analysis, which could be defined as the target area or key area for the implementation of physical exploration, so as to detect the depth of the underground silt. Based on the results of two phases of image classification, change detection analysis was carried out to extract the spatial distribution and range of underground silt, and select typical areas for field verification using microtremor detection. The proposed method can provide decision support for urban engineering construction and urban planning. It can delineate the target area or key area for geophysical exploration, and improve the efficiency of geophysical exploration.
-

-
表 1 分类精度
Table 1. Accuracy of classification
影像类型 总体精度 Kappa系数 T2影像 90.49% 0.8506 T1影像 96.12% 0.94  下载: 导出CSV
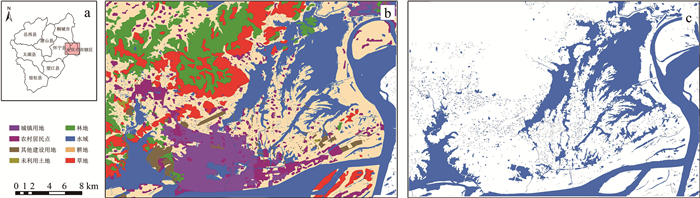
表 2 暗浜空间范围分布面积
Table 2. Area statistics of underground silt
km2 名称 建设用地 耕地 林地 草地 未利用土地 暗浜总计 宜秀区 2.3368 0.0486 0.0053 0.1844 — 2.5751 十里铺 2.0097 0.0064 0.0510 0.0008 — 2.0679 老峰镇 1.6146 0.3560 0.0010 0.0050 0.0093 1.9859 白泽湖 0.5841 0.0622 — — — 0.6463 山口乡 0.5852 — 0.0186 0.0010 — 0.6048 长风乡 0.5028 0.0607 0.0016 0.0067 — 0.5718 龙狮乡 0.5120 0.0496 — — — 0.5616 大龙山 0.3972 0.0021 0.0055 0.0159 — 0.4207 大观区 0.0932 — 0.0007 0.0000 — 0.0939 月山镇 0.0716 — 0.0072 0.0035 0.0007 0.0830 海口镇 0.0003 0.0659 0.0000 0.0000 — 0.0662 迎江区 0.0184 0.0268 0.0045 0.0138 — 0.0635 菱北街 0.0306 — — 0.0010 — 0.0316 杨桥镇 0.0049 — 0.0180 0.0024 — 0.0253 鲟鱼镇 0.0225 — 0.0009 0.0000 — 0.0234 五横乡 — — 0.0202 0.0015 — 0.0217 新洲乡 0.0090 0.0091 — 0.0018 — 0.0199 总计 8.7929 0.6874 0.1345 0.2378 0.0100 9.8626
下载: 导出CSV
-
[1] 翟法智, 徐佩芬, 潘丽娜, 等. 宁波轨道交通暗浜勘察物探方法研究[J]. 地球物理学进展, 2017, 32(4): 1856-1861. https://www.cnki.com.cn/Article/CJFDTOTAL-DQWJ201704061.htm
[2] 刘军强, 翟法智, 黄明. 微动探测法在城市轨道交通暗浜勘察中的应用[J]. 铁道勘察, 2017, 43(6): 57-60. doi: 10.3969/j.issn.1672-7479.2017.06.017
[3] Singh A. Review article digital change detection techniques using remotely-sensed data[J]. International Journal of Remote Sensing, 1989, 10(6): 989-1003. doi: 10.1080/01431168908903939
[4] Hussain M, Chen D, Cheng A, et al. Change detection from remotely sensed images: From pixel-based to object-based approaches[J]. ISPRS Journal of Photogrammetry and Remote Sensing, 2013, 80(2): 91-106.
[5] 李德仁. 利用遥感影像进行变化检测[J]. 武汉大学学报(信息科学版), 2003, 28(S1): 7-12. https://www.cnki.com.cn/Article/CJFDTOTAL-WHCH2003S1003.htm
[6] 肖化超, 周诠, 张建华. 遥感卫星在轨机场变化检测方法[J]. 测绘通报, 2015, (1): 22-25. https://www.cnki.com.cn/Article/CJFDTOTAL-CHTB201501006.htm
[7] 眭海刚, 冯文卿, 李文卓, 等. 多时相遥感影像变化检测方法综述[J]. 武汉大学学报(信息科学版), 2018, 43(12): 1885-1898. https://www.cnki.com.cn/Article/CJFDTOTAL-WHCH201812015.htm
[8] Liu H, Yang M, Chen J, et al. Line-constrained shape feature for building change detection in VHR remote sensing imagery[J]. ISPRS International Journal of Geo-Information, 2018, 7(10): 410. doi: 10.3390/ijgi7100410
[9] Wen D, Huang X, Zhang L, et al. A novel automatic change detection method for urban high-resolution remotely sensed imagery based on multiindex scene representation[J]. IEEE Transactions on Geoscience and Remote Sensing, 2016, 54(1): 609-625. doi: 10.1109/TGRS.2015.2463075
[10] 杜培军, 白旭宇, 罗洁琼, 等. 城市遥感研究进展[J]. 南京大学学报(自然科学版), 2018, 10(1): 11-29. https://www.cnki.com.cn/Article/CJFDTOTAL-NJXZ201801004.htm
[11] 龙玄耀, 李培军. 基于图像分割的城市变化检测[J]. 地球信息科学, 2008, 10(1): 121-127. doi: 10.3969/j.issn.1560-8999.2008.01.020
[12] 侯恩科, 张杰, 谢晓深, 等. 无人机遥感与卫星遥感在采煤地表裂缝识别中的对比[J]. 地质通报, 2019, 38(2/3): 443-448. http://dzhtb.cgs.cn/gbc/ch/reader/view_abstract.aspx?file_no=2019020325&flag=1
[13] Desclee B, Bogaert P, Defourny P. Forest change detection by statistical object-based method[J]. Remote Sensing of Environment, 2006, 102(1): 1-11.
[14] Conchedda G, Durieux L, Mayaux P. An object-based method for mapping and change analysis in mangrove ecosystems[J]. ISPRS Journal of Photogrammetry and Remote Sensing, 2008, 63(5): 578-589. doi: 10.1016/j.isprsjprs.2008.04.002
[15] Duveiller G, Defourny P, Desclee B, et al. Deforestation in Central Africa: Estimates at regional, national and landscape levels by advanced processing of systematically-distributed Landsat extracts[J]. Remote Sensing of Environment, 2008, 112(5): 1969-1981. doi: 10.1016/j.rse.2007.07.026
[16] Stow D. Geographic object-based image change analysis. handbook of applied spatial analysis: software tools, methods and applications[M]. Berlin: Springer, 2010: 565-582.
[17] Wang Z, Liu Y, Ren Y, et al. Object-Level double constrained method for land cover change detection[J]. Sensors, 2018, 19(1): 79. doi: 10.3390/s19010079
[18] Hansen M C, Loveland T R. A review of large area monitoring of land cover change using Landsat data[J]. Remote Sensing of Environment, 2012, 122: 66-74. doi: 10.1016/j.rse.2011.08.024
[19] Hantson S, Chuvieco E. Evaluation of different topographic correction methods for Landsat imagery[J]. International Journal of Applied Earth Observation and Geoinformation, 2011, 13(5): 691-700. doi: 10.1016/j.jag.2011.05.001
[20] Xian G, Homer C G. Updating the 2001 National Land Cover Database Impervious Surface Products to 2006 using Landsat imagery change detection methods[J]. Remote Sensing of Environment, 2010, 114(8): 1676-1686. doi: 10.1016/j.rse.2010.02.018
[21] Okada H. Theory of efficient array observations of microtremors with special reference to the SPAC method[J]. Australian Society of Exploration Geophysicists (ASEG), 2006, 37(1): 73-85. doi: 10.1071/EG06073
[22] Apostolidis P, Raptakis D, Roumelioti Z, et al. Determination of S-wave velocity structure using microtremors and spac method applied in Thessaloniki (Greece)[J]. Soil Dynamics & Earthquake Engineering, 2004, 24(1): 49-67.
[23] Satoh T, Kawase H, Matsushima S. Estimation of S-Wave Velocity Structures in and around the Sendai Basin, Japan, Using Array Records of Microtremors[J]. Bulletin of the Seismological Society of America, 2001, 91(2): 206-218. doi: 10.1785/0119990148
[24] 刘铁华. 综合微动技术在昆明地铁勘探中适用性的量化研究[J]. 工程地球物理学报, 2019, 16(5): 572-579. doi: 10.3969/j.issn.1672-7940.2019.05.003
[25] 王娜. 面向对象的高分辨率遥感影像土地覆盖信息提取技术研究[D]. 昆明理工大学硕士学位论文, 2016.
[26] 刘建华. 高空间分辨率遥感影像自适应分割方法研究[D]. 福州大学博士学位论文, 2011.
[27] Kavzoglu T, Colkesen I. A kernel functions analysis for support vector machines for land cover classification[J]. International Journal of Applied Earth Observation & Geoinformation, 2009, 11(5): 352-359.
-

图(8)
表(2)
计量
- 文章访问数: 1409
- PDF下载数: 5
- 施引文献: 0