Dataset of Field Testing of the Groundwater in the Fangchenggang Area of the Guangxi Zhuang Autonomous Region
-
摘要:
广西防城港是我国华南沿海酸性地下水发育的典型地区,2013—2015年在该地区开展了地下水调查,获取了一批地下水现场测试数据。广西防城港地下水现场测试数据集包含丰水期和枯水期现场测试数据2个Excel数据表格。每个Excel数据表格包含调查点位置、地下水埋深、地下水类型、地下水物理和化学特征等地下水现场测试数据。本数据集共采集水点323组,分析结果表明防城港地区地下水以pH为5.50~6.50的偏酸性地下水为主,此结果不仅能为防城港地下水资源评价和开发提供资料支撑, 还可为华南沿海酸性地下水的研究提供典型范例。
Abstract:The Fangchenggang area of the Guangxi Zhuang Autonomous Region is a typical coastal area in South China where acidic groundwater is well developed. A groundwater survey was carried out in this area during 2013—2015. As a result, a batch of field-testing data of the groundwater was obtained and a dataset was developed (also referred to as the Dataset). The Dataset consists of 2 Excel data tables that respectively contain the field-testing data of the groundwater during the wet and dry seasons. Each of the data tables is comprised of data items such as survey point locations, burial depth of groundwater, groundwater type and the physical and chemical characteristics of the groundwater. It can be shown from the Dataset that the groundwater in Fangchenggang is weakly acidic with a pH value ranging from 5.50–6.50. The Dataset will provide data for the assessment and development of groundwater resources in the Fangchenggang area and also offer a typical demonstration for research on acidic groundwater in the coastal areas of South China.
-
Key words:
- groundwater hydrochemical analysis /
- pH value /
- field testing /
- dataset /
- hydrogeological survey engineering /
- Fangchenggang /
- Guangxi
-
1. 引言
现场测试是获取地下水物理化学信息的重要手段,水文地质调查和监测现场测试指标有地下水温度(T)、酸碱度(pH)、氧化还原电位(Eh)、电导率(EC)、溶解氧(DO)等。通过现场测试,可以准确测定地下水中的这些不稳定指标,及时掌握地下水水质空间变化规律,为调查和监测等方案的确定提供依据。地下水现场测试是水文地质调查和监测的必要技术方法(自然资源部中国地质调查局, 2019)。地下水现场测试指标中的酸碱度对地下水中矿物质等的溶解有重要影响(Leyden E et al., 2016; Owamah HI 2020), 常应用于海岸带地下水交换和高砷地下水等环境地质问题的调查研究(Kurosawa K et al., 2013, Lee J and Kim G, 2015), 是地下水质量评价的重要依据(Loh YSA et al., 2019; Thockchom L and Kshetrimayum KS , 2019; Egbueri JC, 2020)。
酸性地下水广泛分布于我国华南沿海地区,对于区域地下水资源开发、工程建设活动等具有重要的影响(李锐等,2006;张玉玺等,2011;程新伟和孙继朝,2017)。2013—2015年,笔者依托中国地质调查局项目“防城港地区水文地质工程地质调查评价”(编号:12120113004100)在广西防城港地区开展了地下水水化学调查,现场测试数据较好地展现了区域地下水低pH值的特征。作为我国华南沿海典型酸性地下水分布区,本数据集不仅能为防城港地下水资源评价和开发提供资料支撑,还可为华南沿海酸性地下水的研究提供典型范例。
2. 地质与水文地质背景
2.1 地质特征
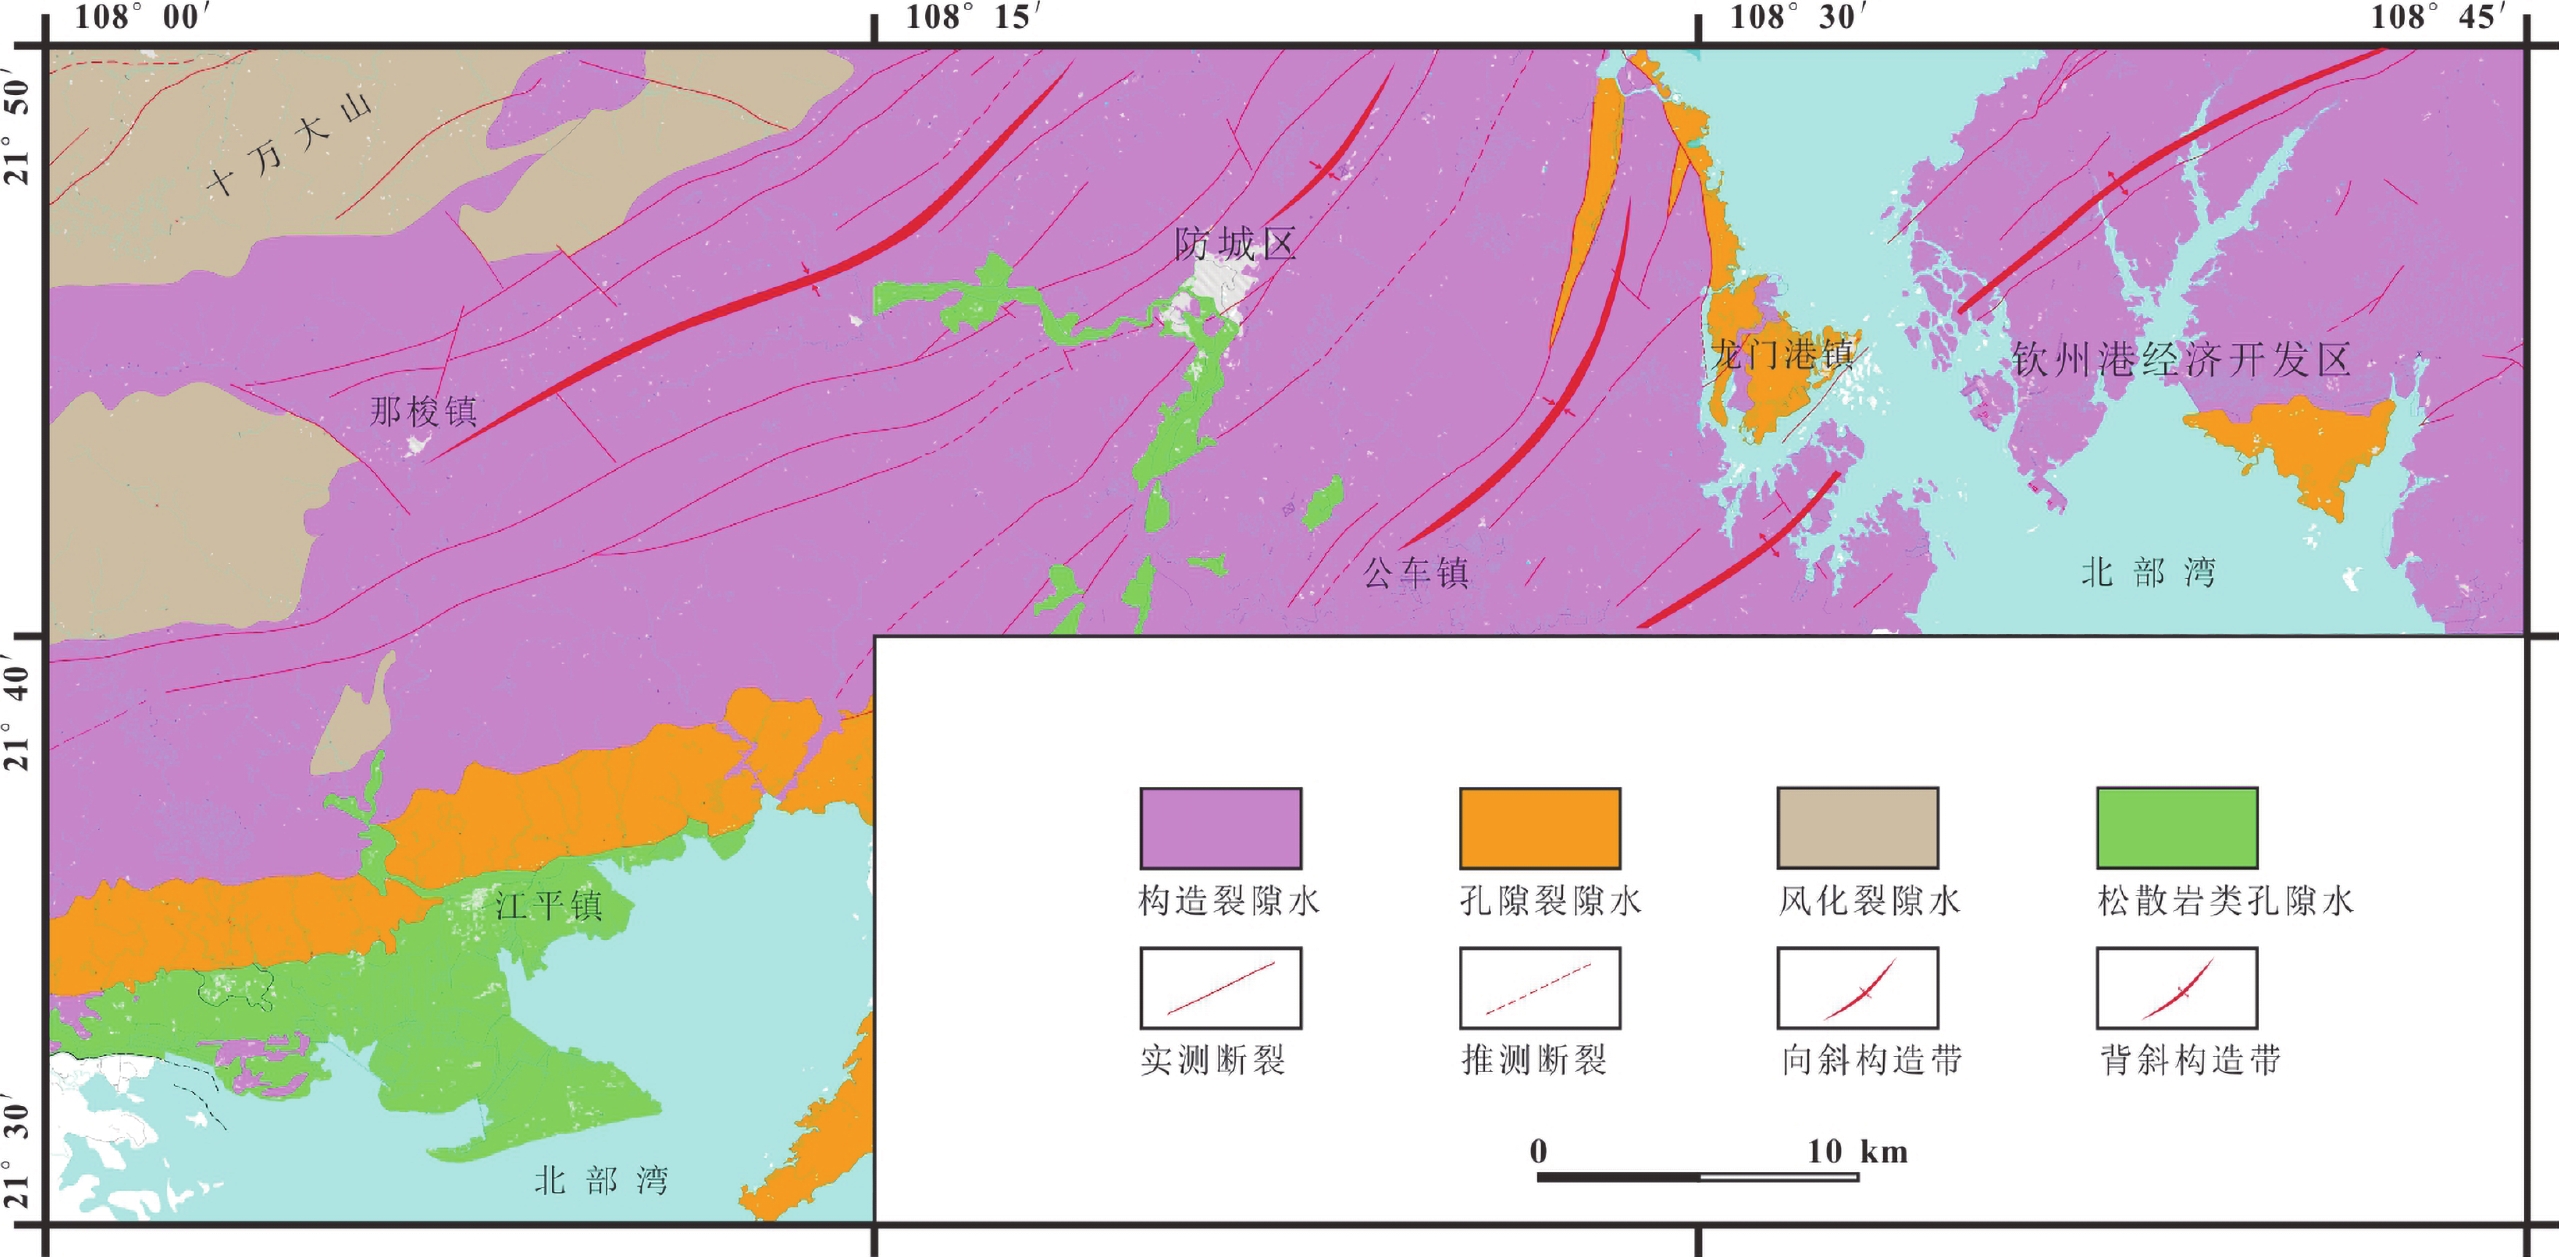
防城港地区位于广西十万大山南东侧,南华准地台钦州残余地槽中的三级构造单元钦州凹陷和十万大山断陷盆地区。区内褶皱和断裂构造均较发育,主要集中于那梭镇至钦州港地区,以北东向为主,伴有少量北西向断裂(图1)。地势北西高,南东低,以丘陵地貌为主,低山地貌仅小范围分布于那梭以北的十万大山边缘,海积地貌仅分布在江平镇一带。出露志留系至第四系,岩性以砂岩、粉砂岩、泥岩为主。小范围出露花岗岩、玢岩及第四系松散层。
2.2 水文地质特征
防城港地区位于亚热带季风湿润气候区,年均降雨量在2 200~3 200 mm,降雨量由北西向南东递减。该地区主要发育构造裂隙水、孔隙裂隙水、风化裂隙水和松散岩类孔隙水。其中,构造裂隙水、孔隙裂隙水、风化裂隙水主要赋存于低山丘陵区,松散岩类孔隙水则主要发育于河谷和海积平原区(图 1)。防城港地区尽管降雨量丰富,但是由于存在酸性地下水等环境地质问题,地下水资源仍较匮乏。
3. 数据集简介
本数据集覆盖了那梭圩幅、江平圩幅、防城幅和龙门幅4个1∶50 000图幅,陆域总面积约1 620 km2。调查区位于广西壮族自治区南部,包括防城港市辖区的港口区、防城区、东兴市和钦州市辖区的钦州港区,地理坐标为东经108°00′~108°45′,北纬21°30′~21°50′。本数据集给出了调查点位置,地下水埋深和类型,以及水温、pH等地下水现场测试物理和化学数据。数据集元数据简介见表 1。
表 1. 数据库(集)元数据简表条目 描述 数据库(集)名称 广西防城港地区地下水现场测试数据集 数据库(集)作者 陈 雯,中国地质调查局武汉地质调查中心
刘怀庆,中国地质调查局武汉地质调查中心
黎清华,中国地质调查局武汉地质调查中心
余绍文,中国地质调查局武汉地质调查中心
陈双喜,中国地质调查局武汉地质调查中心
王 清,中国地质调查局武汉地质调查中心
张宏鑫,中国地质调查局武汉地质调查中心数据时间范围 2013—2015年 地理区域 广西壮族自治区南部,包括防城港市辖区的港口区、防城区、东兴市和钦州市辖区的钦州港区,地理坐标为东经108°00′~108°45′,北纬21°30′~21°50′ 数据格式 *.xls 数据量 48 KB 数据服务系统网址 http://dcc.cgs.gov.cn 基金项目 中国地质调查局地质调查项目“海口江东新区综合地质调查”(DD20190304)、“北海海岸带陆海统筹综合地质调查”(DD20189502)、“防城港地区水文地质工程地质调查评价”(12120113004100)项目资助 语种 中文 数据库(集)组成 数据集为Excel表格形式数据,包含丰水期现场测试数据和枯水期现场测试数据两个Excel工作表。每个Excel数据表格中包含野外编号、坐标、井口高程、水位埋深、井深、地下水类型、取水层位、水温、味、色度、气味、透明度、pH、溶解氧、电导率、氧化还原电位等17项信息 4. 数据采集与描述
4.1 数据采集
2013—2015年,对研究区地下水进行了系统调查,现场采用美国哈希HQ40D便携式水质分析仪对地下水物理和化学指标进行测试,包括T、pH、EC、DO、Eh等,此外还通过人工对地下水味、色度、气味和透明度等进行了定性测定。美国哈希HQ40D便携式水质分析仪测试精度和误差分别为:pH分辨率0.01,误差为±0.02;水温分辨率0.1℃,误差为±0.3℃;DO分辨率0.1 mg/L,误差为±0.2 mg/L;EC分辨率0.01 μs/cm,误差为±0.5%;Eh分辨率0.1 mV,误差为±0.1 mV。地下水露头(机民井)坐标采用GPS测定。本次调查共获得地下水现场测试有效数据323组,其中丰水期(5月—9月)数据193组,枯水期(11月—2月)数据130组。
4.2 数据样本
防城港地区地下水水化学现场测试数据集采用Excel表格形式,包括丰水期数据和枯水期数据2个文件。每个数据表格中包含调查点位置(野外编号和坐标)、井口高程、地下水位埋深、井深、取水层位、水温、味、色度、气味、透明度、pH、DO、EC、Eh等17项水文地球化学信息(参数)。
样品野外编号按照调查图幅和组别编排,坐标统一采用北京54大地坐标系;水位埋深和井深数据测量精确为0.01 m;地下水类型参照《地质矿产术语分类代码水文地质学》(GB/T 9649.20−2001)确定。pH精确到0.01,DO、EC、Eh和水温分别精确到0.01 mg/L、0.1 μs/cm、0.1 mV和0.1 ℃;味分为咸味、涩味、苦味、甜味、墨水味、沼泽味、酸味和无味8种,色度分为蓝色、灰色、锈色、绿色、红色、暗红色、黄色和无色8种,气味分极强、强、显著、弱、极微弱和无6个等级,透明度分为透明、微浊、浑浊和极浊4个等级(表2)。
表 2. 防城港地区现场测试数据表序号 数据项名称 数据类型 单位 实例 1 野外编号 字符型 − NS2-176 2 X坐标 字符型 − 2416182 3 Y坐标 字符型 − 19203890 4 水位埋深 浮点型 m 0.20 5 井口高程 浮点型 m 9.00 6 井深 浮点型 m 1.00 7 地下水类型 字符型 − 风化裂隙水 8 取水层位 字符型 − 潜水 9 水温 浮点型 ℃ 25.0 10 味 字符型 − 无味 11 色度 字符型 − 无色 12 气味 字符型 − 无 13 透明度 字符型 − 透明 14 pH 浮点型 − 5.12 15 DO 浮点型 mg/L 7.76 16 EC 浮点型 μs/cm 31.0 17 Eh 浮点型 mV 194.2 调查显示(表3),广西防城港地区地下水pH呈现明显偏低的酸性特征,丰水期地下水pH平均为6.21,最小值为4.29,最大值为7.91,46.11%的样品pH为5.50~6.50,17.10%的样品pH为4.29~5.50,36.79%的样品pH为6.50~7.91。枯水期地下水样品pH平均为5.84,最小值为4.12,最大值为7.97,56.15%的样品pH为5.50~6.50,30.77%的样品pH为4.12~5.50,13.08%的样品pH为6.50~7.97。受降雨、包气带介质、含硫矿物的水解、潮汐作用的影响,防城港地区地下水以pH为5.50~6.50的偏酸性地下水为主。
表 3. 防城港地区地下水样pH分布情况表pH <5.50 5.50~6.50 >6.50 丰水期样品数 33 89 71 枯水期样品数 40 73 17 5. 数据质量控制和评估
为保证现场调查数据精确可靠,出队前对测量工具和仪器进行校正,保证仪器状态良好。此外,对所有参与调查人员进行统一培训,熟练操作测试仪器,规范填写调查内容。在调查过程中,每日出队前和收工后对仪器进行检查,每两周进行仪器校正。对地下水物理性质进行观测时,调查人员不得有感冒鼻塞等影响准确评判的症状和行为。受仪器设备的限制,本数据集除pH和物理指标外,其他一些测试指标存在部分缺失。对照同期取样的实验室测试分析结果,本次调查的现场测试数据准确可靠。
6. 结论
(1)地下水化学现场测试数据较好地展示了地下水中易变组分及水文地球化学特征,防城港地区地下水以pH为5.50~6.50的偏酸性地下水为主,对判断地下水类型、初步评价地下水基本特征具有参考价值。
(2)防城港地区地下水水化学现场测试数据集包含丰水期和枯水期现场测试数据以及与地下水有关的物理化学参数。本数据集不仅能为防城港地下水资源评价和开发提供资料支撑,还可为华南沿海酸性地下水的研究提供典型范例。
致谢:中国地质调查局武汉地质调查中心彭柯教授级高工、广西壮族自治区水文地质工程地质队黄辉院长等在野外调查中给予了大力支持,两位审稿专家及编辑部对稿件提出了建设性修改意见,在此一并致谢!
1. Introduction
Field testing is an important means of obtaining hydrochemical information on groundwater. The field-testing indices of the hydrogeological survey and monitoring include temperature (T), pH, oxidation-reduction potential (Eh), electrical conductivity (EC) and dissolved oxygen (DO) in the groundwater. Field testing allows us to accurately determine these unstable indices in the groundwater and timely grasp the spatial change laws of the groundwater quality, and thus providing a basis for effective determination of the survey and monitoring programs. Hydrochemical field testing of groundwater is a necessary technical method for hydrogeological survey and monitoring (China Geological Survey, 2019). The pH values among the field-testing indices of groundwater pose a significant impact on the dissolution of minerals in it (Leyden E et al., 2016; Owamah HI, 2020). This is usually applied to the survey and research of groundwater exchange and environmental geological problems, such as groundwater with a high concentration of arsenic in coastal areas (Kurosawa K et al., 2013; Lee J and Kim G, 2015), and is an important basis for the assessment of groundwater quality (Loh YSA et al., 2019; Thockchom L and Kshetrimayum KS, 2019; Egbueri JC, 2020).
Acidic groundwater is widely distributed in the coastal areas in South China and has a significant impact on the development of groundwater resources and the construction of projects in these areas (Li R et al., 2006; Zhang YX et al., 2011; Cheng XW and Sun JC, 2017). Relying on a project titled Hydrogeological and Engineering Geological Survey and Assessment of the Fangchenggang Area (project No.: 12120113004100) initiated by China Geological Survey, a hydrochemical survey of groundwater was carried out in the Fangchenggang area of the Guangxi Autonomous Region in 2013—2015. The results from the field-testing data clearly show that the groundwater has a low pH value. Since Fangchenggang is a typical coastal area in South China, where acidic groundwater is distributed, the field-testing data will provide information for the assessment and development of groundwater resources in Fangchenggang. It will also offer a typical demonstration for the research on acidic groundwater in coastal areas of South China.
2. Geological and Hydrogeological Background
2.1 Geological Features
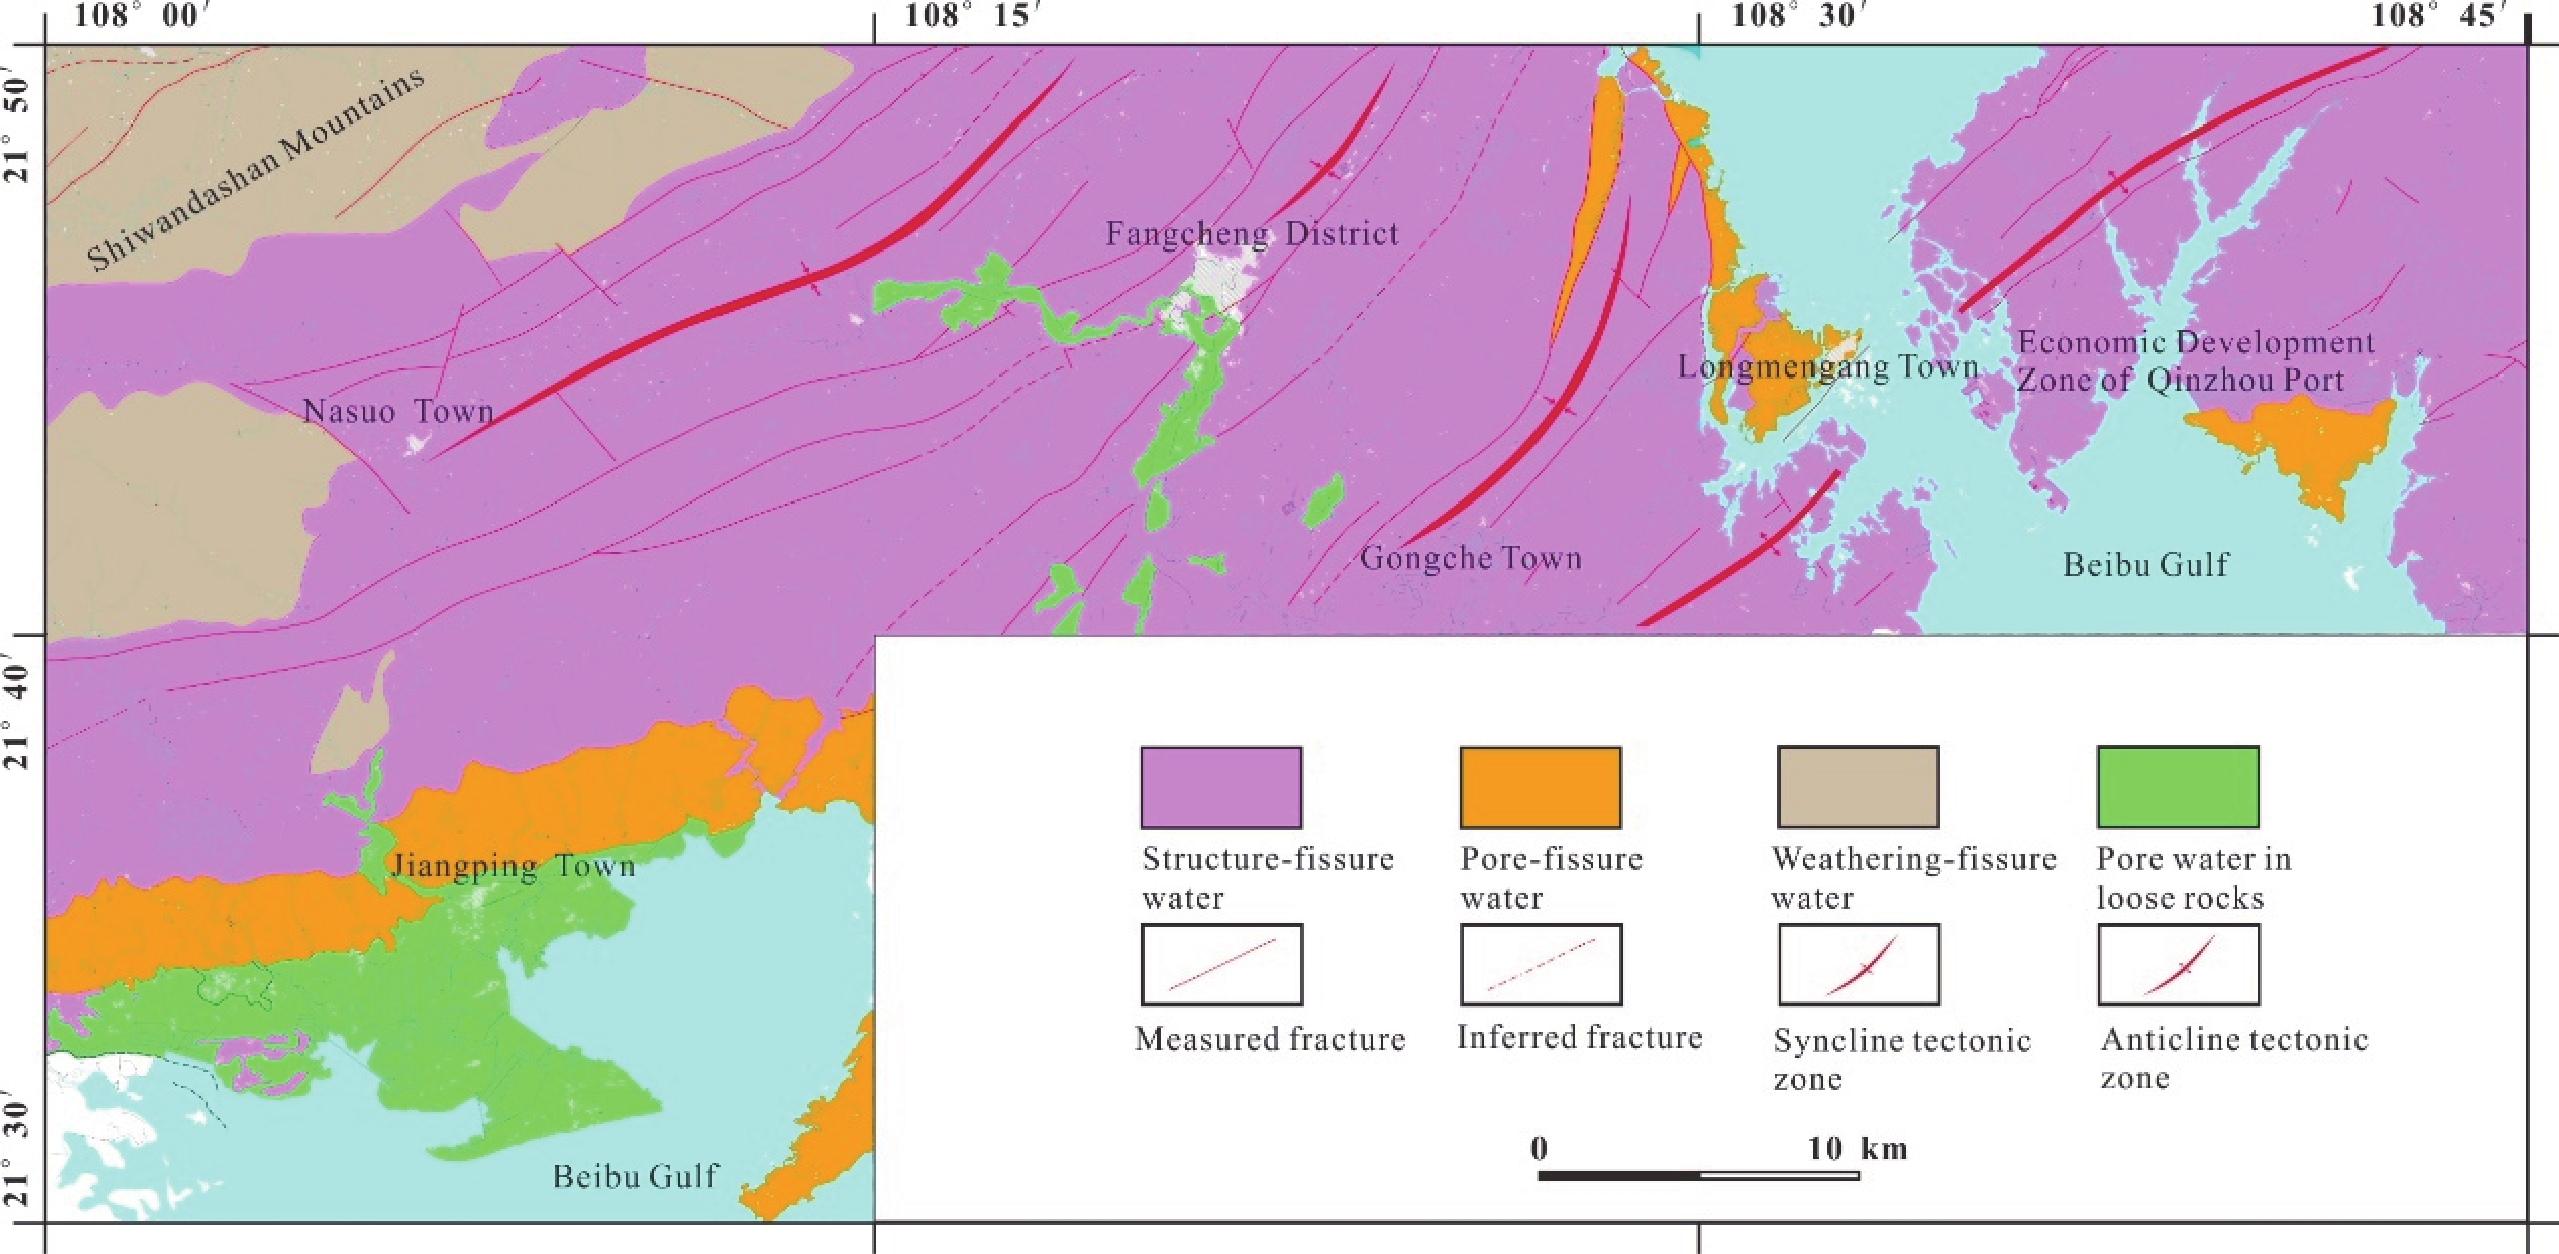
The Fangchenggang area lies in southeast of the Shiwandashan Mountains, Guangxi, and is tectonically located in a three-order tectonic unit: the Qinzhou Sag and the Shiwandashan Fault Basin area in the Qinzhou residual geosyncline of South China Paraplatform. Folds and fractures are relatively developed in the area. They are mainly North-east oriented and concentrated from Nasuo Town to the Port of Qinzhou. Additionally, there are a small number of faults trending northwest (Fig. 1). The overall topography of the area is high in the northwest and low in the southeast. As for the landform in the area, hills are mainly distributed here, with low mountains only distributed in the margin of Shiwandashan Mountains, which is to the north of Nasuo Town and marine sediments are only distributed around Jiangping Town. The outcrops in this area consist of the strata from Silurian to Quaternary, with the lithology mainly characterized by sandstone, siltstone and mudstone. In addition, granite, porphyrite and Quaternary loose bed are exposed in a small range.
2.2 Hydrogeological Features
The Fangchenggang area features a humid subtropical monsoon climate, with an annual rainfall ranging between 2 200–3 200 mm and declining gradually from the northwest to the southeast. Four varieties of groundwater are mainly developed in the area, i.e., structural-fissure water, pore-fissure water, weathering-fissure water and pore water in loose rocks. The first three varieties of groundwater mainly occur in low mountains and hilly areas, while the fourth mainly develops in valleys and alluvial–marine plain areas. In spite of the rich rainfall, the area is still in short supply of groundwater resources due to the environmental geological problems such as acidic groundwater.
3. Introduction of the Dataset
The Dataset involves four map sheets on a scale of 1∶50 000; namely Nasuoyu, Jiangpingyu, Fangcheng and Longmen respectively, covering a land area of about 1 620 km2. The whole area (also referred to as the Area) covered in the Dataset is located in the southern part of the Guangxi Zhuang Autonomous Region, with geological coordinates of E 108°00′–108°45′ and N 21°30′–21°50′. It consists of the areas governed by Fangchenggang City; including Gangkou District, Fangcheng District, Dongxing City and Qinzhou Port; which is governed by Qinzhou City. The Dataset contains the physical and chemical data that were tested in the field such as locations of survey points; and the burial depth, types, temperature and pH values of the groundwater. The brief metadata of the Dataset is shown in Table 1.
Table 1. Metadata Table of Database (Dataset)Items Description Database (dataset) name Dataset of Field Testing of the Groundwater in the Fangchenggang Area of the Guangxi Zhuang Autonomous Region Database (dataset) authors Chen Wen, Wuhan Center, China Geological Survey
Liu Huaiqing, Wuhan Center, China Geological Survey
Li Qinghua, Wuhan Center, China Geological Survey
Yu Shaowen, Wuhan Center, China Geological Survey
Chen Shuangxi, Wuhan Center, China Geological Survey
Wang Qing, Wuhan Center, China Geological Survey
Zhang Hongxin, Wuhan Center, China Geological SurveyData acquisition time 2013—2015 Geographical area Lies in the southern part of the Guangxi Zhuang Autonomous Region, consisting of the areas governed by Fangchenggang City; including Gangkou District, Fangcheng District, Dongxing City and also Qinzhou Port; which is governed by Qinzhou City. The geological coordinates are E 108°00′–108°45′ and N 21°30′–21°50′ Data format *.xls Data size 48 KB Data service system URL http://dcc.cgs.gov.cn Fund project China Geological Survey projects titled “Comprehensive Geological Survey in the Jiangdong New District, Haikou City” (DD20190304), “Overall Comprehensive Geological Survey in Marine Areas and Land Along the Coastal Zone of Beihai City as a Whole” (DD20189502), and “Hydrogeological and Engineering Geological Survey and Assessment in the Fangchenggang Area” (12120113004100) Language Chinese Database (dataset) composition The Dataset consists of two Excel data tables that respectively contain the field-testing data of the groundwater in the wet and dry seasons. Each of the data tables includes 17 data items, which are: field No., coordinates, wellhead elevation, burial depth of water level, well depth, groundwater type, water intaking horizon and the temperature, taste, chroma, odor, transparency, pH value, DO, EC and Eh of water 4. Data Acquisition and Description
4.1 Data Acquisition
Systematical survey of the groundwater in the Area was carried out in 2013—2015. A portable water-quality analyzer, HQ40D, produced by HACH from America was adopted in the field to test the physical and chemical indices of the groundwater such as T, pH, EC, DOand Eh. Additionally, some indices including the taste, chroma, odor and transparency of the groundwater were qualitatively determined manually. The respective resolution (accuracy) and error of HQ40D is 0.01 and ±0.02 for pH, 0.1℃ and ± 0.3℃ for water temperature, 0.1 mg/L and ± 0.2 mg/L for DO, 0.01 μs/cm and ±0.5% for EC and 0.1 mV and ±0.1 mV for Eh. The coordinates of groundwater outcrops (pumping/domestic wells) were measured using GPS. 323 sets of effective data of groundwater field testing were obtained from the survey, including 193 from the wet seasons (from May to September) and 130 from the dry seasons (from November to February).
4.2 Data Samples
The Dataset consists of 2 Excel data tables that respectively contain the data from the dry and wet seasons. Each data table contains 17 hydrogeochemical data items, include: locations of survey points (including field No. and coordinates), wellhead elevation, burial depth of groundwater level, well depth, groundwater type, water intaking horizon and the temperature, taste, chroma, odor, transparency, pH value, DO, EC and Ehof water.
The field No. of the samples were determined based on the map sheet and formation. The Beijing 54 Geodetic Coordinate System was adopted in a united manner to determine the coordinates of survey points. The burial depth of groundwater level and well depth were accurate to 0.01 m. Groundwater types were identified in accordance with GB/T 9649.20–2001 Terminology Classification and Code for Geology and Mineral Resources – Part 20 Hydrology. The pH, DO, EC, Eh and water temperature value(s) were respectively accurate to 0.01, 0.01 mg/L, 0.1 μs/cm, 0.1 mV and 0.1℃. The taste was divided into salty, astringent, bitter, sweet, ink-taste, marsh-taste, acid, sour and tasteless; the chroma was divided into blue, gray, rusty, green, red, dark red, yellow and colorless; the odor was divided into very strong, strong, obvious, weak, very weak and odorless; the transparency was divided into transparent, slightly turbid, turbid and very turbid (Table 2).
Table 2. Field Testing Data of Groundwater in the Fangchenggang Area, GuangxiNo. Name of data item Data type Unit Example 1 Field No. char − NS2-176 2 X coordinate char − 2416182 3 Y Coordinate char − 19203890 4 Burial depth of groundwater level float m 0.20 5 Wellhead elevation float m 9.00 6 Well depth float m 1.00 7 Groundwater type char − Weathering-fissure water 8 Water intaking horizon char − Phreatic water 9 Water temperature float ℃ 25.0 10 Taste char − Tasteless 11 Chroma char − Colorless 12 Odor char − Odorless 13 Transparency char − Transparent 14 pH value float − 5.12 15 DO float mg/L 7.76 16 EC float μs/cm 31.0 17 Eh float mV 194.2 It is shown from the groundwater survey that the groundwater in the Area is obviously slightly acidic with a low pH value (Table 3). The average, minimal and maximum pH values of the groundwater in the wet seasons are 6.21, 4.29 and 7.91 respectively. Moreover, the pH values of 46.11%, 17.10% and 36.79% of the groundwater samples are 5.50–6.50, 4.29–5.50 and 6.50–7.91 respectively. The average, minimal and maximum pH values of the groundwater in the dry seasons are 5.84, 4.12 and 7.97 respectively. Additionally, the pH values of 56.15%, 30.77% and 13.08% of the groundwater samples are 5.50–6.50, 4.12–5.50 and 6.50–7.97 respectively. The groundwater in the Area is mainly slightly acidic with a pH value ranging from 5.50 to 6.50 as it is affected by rainfall, media in the aeration zone, hydrolysis of sulfur-bearing minerals and tidal effects.
Table 3. The pH Distribution of the Groundwater Samples in the Fangchenggang AreapH value <5.50 5.50–6.50 >6.50 Number of samples from the wet season(s) 33 89 71 Number of samples from the dry season(s) 40 73 17 5. Data Quality Control and Assessment
To ensure that the data obtained from field testing are accurate and credible, measuring devices and instruments were calibrated, before they were taken out to the field, to ensure that they were in good condition. Furthermore, all staff participating in the groundwater survey were trained in the skillful manipulation of measuring instruments and adopted a standardized method of recording survey data. During the survey, the instruments were checked before departure and upon return from the field every day. They were also recalibrated once every two weeks. Any staff who showed symptoms or behaviors that may affect their judgment, such as a cold or nasal obstruction, were forbidden to observe the physical properties of the groundwater. Some indices in the Dataset, except pH values and physical indices, are not available due to the limitations imposed by the measuring instruments and devices. However, the field-testing data obtained from this survey are accurate and credible according to the comparison with the results of laboratory testing and analysis of the samples taken during the same period.
6. Conclusion
(1) The changeable components and hydrogeochemical features of the groundwater are clearly presented from the hydrochemical data obtained from the field testing of the groundwater. It can be concluded that the groundwater in the Area is mainly slightly acidic with a pH value ranging from 5.50–6.50. This will provide references for the determination of groundwater types and initial assessment of the basic features of groundwater.
(2) The Dataset contains the field-testing data of both dry and wet seasons and also the physical and chemical parameters of the groundwater. Not only will it provide data for the assessment and development of groundwater resources in the Fangchenggang area but will also offer a typical demonstration for research on acidic groundwater in the coastal areas of South China.
Acknowledgments: The authors would like to extend our sincere appreciation to professorate senior engineer Peng Ke from the Wuhan Center, China Geological Survey and President Huanghui from the Hydrogeological & Engineering Geological Team of Guangxi Zhuang Autonomous Region for their strong support during the field survey. Our thanks also goes to two peer reviewers and the editors for their constructive opinions on the revision of this paper.
-
表 1 数据库(集)元数据简表
条目 描述 数据库(集)名称 广西防城港地区地下水现场测试数据集 数据库(集)作者 陈 雯,中国地质调查局武汉地质调查中心
刘怀庆,中国地质调查局武汉地质调查中心
黎清华,中国地质调查局武汉地质调查中心
余绍文,中国地质调查局武汉地质调查中心
陈双喜,中国地质调查局武汉地质调查中心
王 清,中国地质调查局武汉地质调查中心
张宏鑫,中国地质调查局武汉地质调查中心数据时间范围 2013—2015年 地理区域 广西壮族自治区南部,包括防城港市辖区的港口区、防城区、东兴市和钦州市辖区的钦州港区,地理坐标为东经108°00′~108°45′,北纬21°30′~21°50′ 数据格式 *.xls 数据量 48 KB 数据服务系统网址 http://dcc.cgs.gov.cn 基金项目 中国地质调查局地质调查项目“海口江东新区综合地质调查”(DD20190304)、“北海海岸带陆海统筹综合地质调查”(DD20189502)、“防城港地区水文地质工程地质调查评价”(12120113004100)项目资助 语种 中文 数据库(集)组成 数据集为Excel表格形式数据,包含丰水期现场测试数据和枯水期现场测试数据两个Excel工作表。每个Excel数据表格中包含野外编号、坐标、井口高程、水位埋深、井深、地下水类型、取水层位、水温、味、色度、气味、透明度、pH、溶解氧、电导率、氧化还原电位等17项信息 表 2 防城港地区现场测试数据表
序号 数据项名称 数据类型 单位 实例 1 野外编号 字符型 − NS2-176 2 X坐标 字符型 − 2416182 3 Y坐标 字符型 − 19203890 4 水位埋深 浮点型 m 0.20 5 井口高程 浮点型 m 9.00 6 井深 浮点型 m 1.00 7 地下水类型 字符型 − 风化裂隙水 8 取水层位 字符型 − 潜水 9 水温 浮点型 ℃ 25.0 10 味 字符型 − 无味 11 色度 字符型 − 无色 12 气味 字符型 − 无 13 透明度 字符型 − 透明 14 pH 浮点型 − 5.12 15 DO 浮点型 mg/L 7.76 16 EC 浮点型 μs/cm 31.0 17 Eh 浮点型 mV 194.2 表 3 防城港地区地下水样pH分布情况表
pH <5.50 5.50~6.50 >6.50 丰水期样品数 33 89 71 枯水期样品数 40 73 17 Table 1. Metadata Table of Database (Dataset)
Items Description Database (dataset) name Dataset of Field Testing of the Groundwater in the Fangchenggang Area of the Guangxi Zhuang Autonomous Region Database (dataset) authors Chen Wen, Wuhan Center, China Geological Survey
Liu Huaiqing, Wuhan Center, China Geological Survey
Li Qinghua, Wuhan Center, China Geological Survey
Yu Shaowen, Wuhan Center, China Geological Survey
Chen Shuangxi, Wuhan Center, China Geological Survey
Wang Qing, Wuhan Center, China Geological Survey
Zhang Hongxin, Wuhan Center, China Geological SurveyData acquisition time 2013—2015 Geographical area Lies in the southern part of the Guangxi Zhuang Autonomous Region, consisting of the areas governed by Fangchenggang City; including Gangkou District, Fangcheng District, Dongxing City and also Qinzhou Port; which is governed by Qinzhou City. The geological coordinates are E 108°00′–108°45′ and N 21°30′–21°50′ Data format *.xls Data size 48 KB Data service system URL http://dcc.cgs.gov.cn Fund project China Geological Survey projects titled “Comprehensive Geological Survey in the Jiangdong New District, Haikou City” (DD20190304), “Overall Comprehensive Geological Survey in Marine Areas and Land Along the Coastal Zone of Beihai City as a Whole” (DD20189502), and “Hydrogeological and Engineering Geological Survey and Assessment in the Fangchenggang Area” (12120113004100) Language Chinese Database (dataset) composition The Dataset consists of two Excel data tables that respectively contain the field-testing data of the groundwater in the wet and dry seasons. Each of the data tables includes 17 data items, which are: field No., coordinates, wellhead elevation, burial depth of water level, well depth, groundwater type, water intaking horizon and the temperature, taste, chroma, odor, transparency, pH value, DO, EC and Eh of water Table 2. Field Testing Data of Groundwater in the Fangchenggang Area, Guangxi
No. Name of data item Data type Unit Example 1 Field No. char − NS2-176 2 X coordinate char − 2416182 3 Y Coordinate char − 19203890 4 Burial depth of groundwater level float m 0.20 5 Wellhead elevation float m 9.00 6 Well depth float m 1.00 7 Groundwater type char − Weathering-fissure water 8 Water intaking horizon char − Phreatic water 9 Water temperature float ℃ 25.0 10 Taste char − Tasteless 11 Chroma char − Colorless 12 Odor char − Odorless 13 Transparency char − Transparent 14 pH value float − 5.12 15 DO float mg/L 7.76 16 EC float μs/cm 31.0 17 Eh float mV 194.2 Table 3. The pH Distribution of the Groundwater Samples in the Fangchenggang Area
pH value <5.50 5.50–6.50 >6.50 Number of samples from the wet season(s) 33 89 71 Number of samples from the dry season(s) 40 73 17 -
[1] Egbueri JC. 2020. Groundwater quality assessment using pollution index of groundwater (PIG), ecological risk index (ERI) and hierarchical cluster analysis (HCA): A case study[J]. Groundwater for Sustainable Development, 10, 100292.https://doi.org/10.1016/j.gsd.2019.100292.
[2] Kurosawa K, Egashira K, Tani M. 2013. Relationship of arsenic concentration with ammonium-nitrogen concentration, oxidation reduction potential and pH of groundwater in arsenic-contaminated areas in Asia[J]. Physics and Chemistry of the Earth, Parts A/B/C, 58-60: 85−88. doi: 10.1016/j.pce.2013.04.016
[3] Lee J, Kim G. 2015. Dependence of coastal water pH increases on submarine groundwater discharge off a volcanic island[J]. Estuarine, Coastal and Shelf Science, 163(part B): 15−21. http://www.wanfangdata.com.cn/details/detail.do?_type=perio&id=13edd5f8e5b56b3b7d5bac9f0d38197c
[4] Leyden E, Cook F, Hamilton B, Zammit B, Barnett L, Lush AM, Stone D, Mosley L. 2016. Near shore groundwater acidification during and after a hydrological drought in the Lower Lakes, South Australia[J]. Journal of Contaminant Hydrology, 189: 44−57. doi: 10.1016/j.jconhyd.2016.03.008
[5] Loh YSA, Akurugu BA, Manu E, Abdul-Samed A. 2019. Assessment of groundwater quality and the main controls on its hydrochemistry in some Voltaian and basement aquifers, northern Ghana[J]. Groundwater for Sustainable Development, 100296, in press, available online.
[6] Owamah HI. 2020. A comprehensive assessment of groundwater quality for drinking purpose in a Nigerian rural Niger delta community[J]. Groundwater for Sustainable Development, 10, 100286. https://doi.org/10.1016/j.gsd.2019.100286.
[7] Thockchom L, Kshetrimayum KS. 2019. Assessment of quality contributing parameters using hydrochemistry and hydrogeology for irrigation in intermontane Manipur valley in northeast India[J]. Groundwater for Sustainable Development, 8: 667−679. doi: 10.1016/j.gsd.2018.08.003
[8] 程新伟, 孙继朝. 2017. 珠江三角洲地区酸性地下水分布特征及其影响因素研究[J]. 地下水, 39(5): 25−27, 87. doi: 10.3969/j.issn.1004-1184.2017.05.008
[9] 李锐, 周训, 张理, 欧业成, 黄喜新. 2006. 北海市偏酸性地下水pH值的特点及其影响因素简析[J]. 勘察科学技术, (5): 46−50. doi: 10.3969/j.issn.1001-3946.2006.06.012
[10] 张玉玺, 孙继朝, 陈玺, 黄冠星, 荆继红, 刘景涛, 向小平, 王金翠, 支兵发. 2011. 珠江三角洲浅层地下水pH值的分布及成因浅析[J]. 水文地质工程地质, 38(1): 16−21. doi: 10.3969/j.issn.1000-3665.2011.01.004
[11] 自然资源部中国地质调查局. 2019. 水文地质调查技术要求(1∶50 000)[S]. 1−32.
[1] China Geological Survey, Ministry of Natural Resources of the People’s Republic of China. 2019. Technical requirement for hydrogeological survey (1: 50 000)[S]. 1–32 (in Chinese).
[2] Cheng Xinwei, Sun Jichao. 2017. Study on distribution characteristics of acid groundwater and its influencing factors in the Pearl River Delta[J]. Ground water, 39(5): 25−27,87 (in Chinese with English abstract). http://www.wanfangdata.com.cn/details/detail.do?_type=perio&id=dixs201705008
[3] Egbueri JC. 2020. Groundwater quality assessment using pollution index of groundwater (PIG), ecological risk index (ERI) and hierarchical cluster analysis (HCA): A case study[J]. Groundwater for Sustainable Development, 10: 100292. doi: 10.1016/j.gsd.2019.100292
[4] Kurosawa K, Egashira K, Tani M. 2013. Relationship of arsenic concentration with ammonium–nitrogen concentration, oxidation reduction potential and pH of groundwater in arsenic-contaminated areas in Asia[J]. Physics and Chemistry of the Earth, Parts A/B/C, 58–60: 85−88. http://www.wanfangdata.com.cn/details/detail.do?_type=perio&id=2b78ebdcfa5d115ace7cbcc033668e03
[5] Lee J, Kim G. 2015. Dependence of coastal water pH increases on submarine groundwater discharge off a volcanic island[J]. Estuarine, Coastal and Shelf Science, 163(part B): 15−21. http://www.wanfangdata.com.cn/details/detail.do?_type=perio&id=13edd5f8e5b56b3b7d5bac9f0d38197c
[6] Leyden E, Cook F, Hamilton B, Zammit B, Barnett L, Lush AM, Stone D, Mosley L. 2016. Near shore groundwater acidification during and after a hydrological drought in the Lower Lakes, South Australia[J]. Journal of Contaminant Hydrology, 189: 44−57. doi: 10.1016/j.jconhyd.2016.03.008
[7] Li Rui, Zhou Xun, Zhang Li, Ou Yecheng, Huang Xixin. 2006. Characteristics of the pH in weak acidic groundwater near Beihai and preliminary analyses of its affecting factors[J]. Site Investigation Science and Technology, (5): 46−50 (in Chinese with English abstract). http://www.wanfangdata.com.cn/details/detail.do?_type=perio&id=kckxjs200605013
[8] Loh YSA, Akurugu BA, Manu E, Abdul-Samed A. 2019. Assessment of groundwater quality and the main controls on its hydrochemistry in some Voltaian and basement aquifers, northern Ghana[J]. Groundwater for Sustainable Development, 100296, in press, available online.
[9] Owamah HI. 2020. A comprehensive assessment of groundwater quality for drinking purpose in a Nigerian rural Niger delta community[J]. Groundwater for Sustainable Development, 10: 100286. doi: 10.1016/j.gsd.2019.100286
[10] Thockchom L, Kshetrimayum KS. 2019. Assessment of quality contributing parameters using hydrochemistry and hydrogeology for irrigation in intermontane Manipur valley in northeast India[J]. Groundwater for Sustainable Development, (8): 667−679. doi: 10.1016/j.gsd.2018.08.003
[11] Zhang Yuxi, Sun Jichao, Chen Xi, Huang Guanxing, Jing Jihong, Liu Jingtao, Xiang Xiaoping, Wang Jincui, Zhi Bingfa. 2011. Characteristics and preliminary analyses of the formation of pH in shallow groundwater in the Pearl River delta[J]. Hydrogeology & Engineering Geology, 38(1): 16−21 (in Chinese with English abstract). http://www.wanfangdata.com.cn/details/detail.do?_type=perio&id=swdzgcdz201101004
期刊类型引用(3)
1. 陈雯,吴亚,张宏鑫,刘怀庆. 合浦盆地西部地区地下水水化学特征及形成机制. 环境科学. 2024(01): 194-206 . 百度学术
2. 陈雯,余绍文,张宏鑫,刘怀庆. 北海市铁山港东部地区地下水水化学特征及形成机制. 华南地质. 2023(01): 95-107 . 百度学术
3. 张宏鑫,余绍文,张彦鹏,陈雯,黎清华,刘怀庆,张庆玉. 广西防城港地区浅层地下水pH值时空分布、成因及对生态环境的影响. 中国地质. 2022(03): 822-833 . 本站查看
其他类型引用(0)
-