

Mobilization Mechanisms of High Fluorine and Iodine Groundwater in the Northwest Shandong Plain
-
摘要:
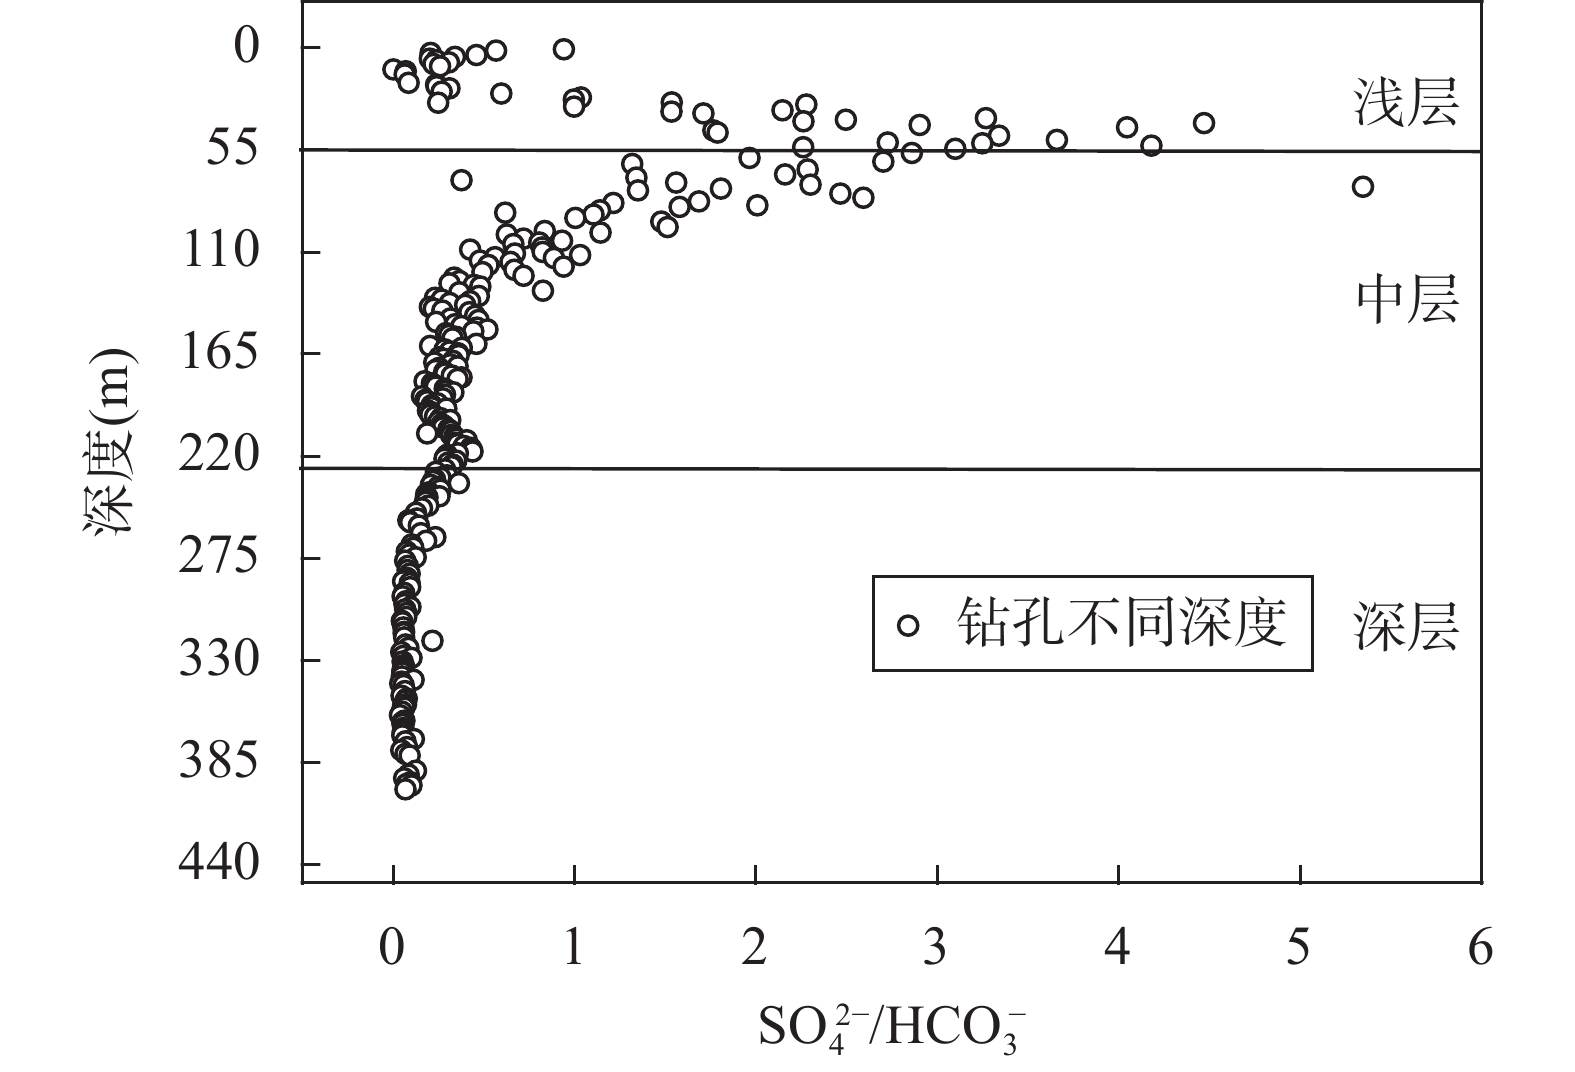
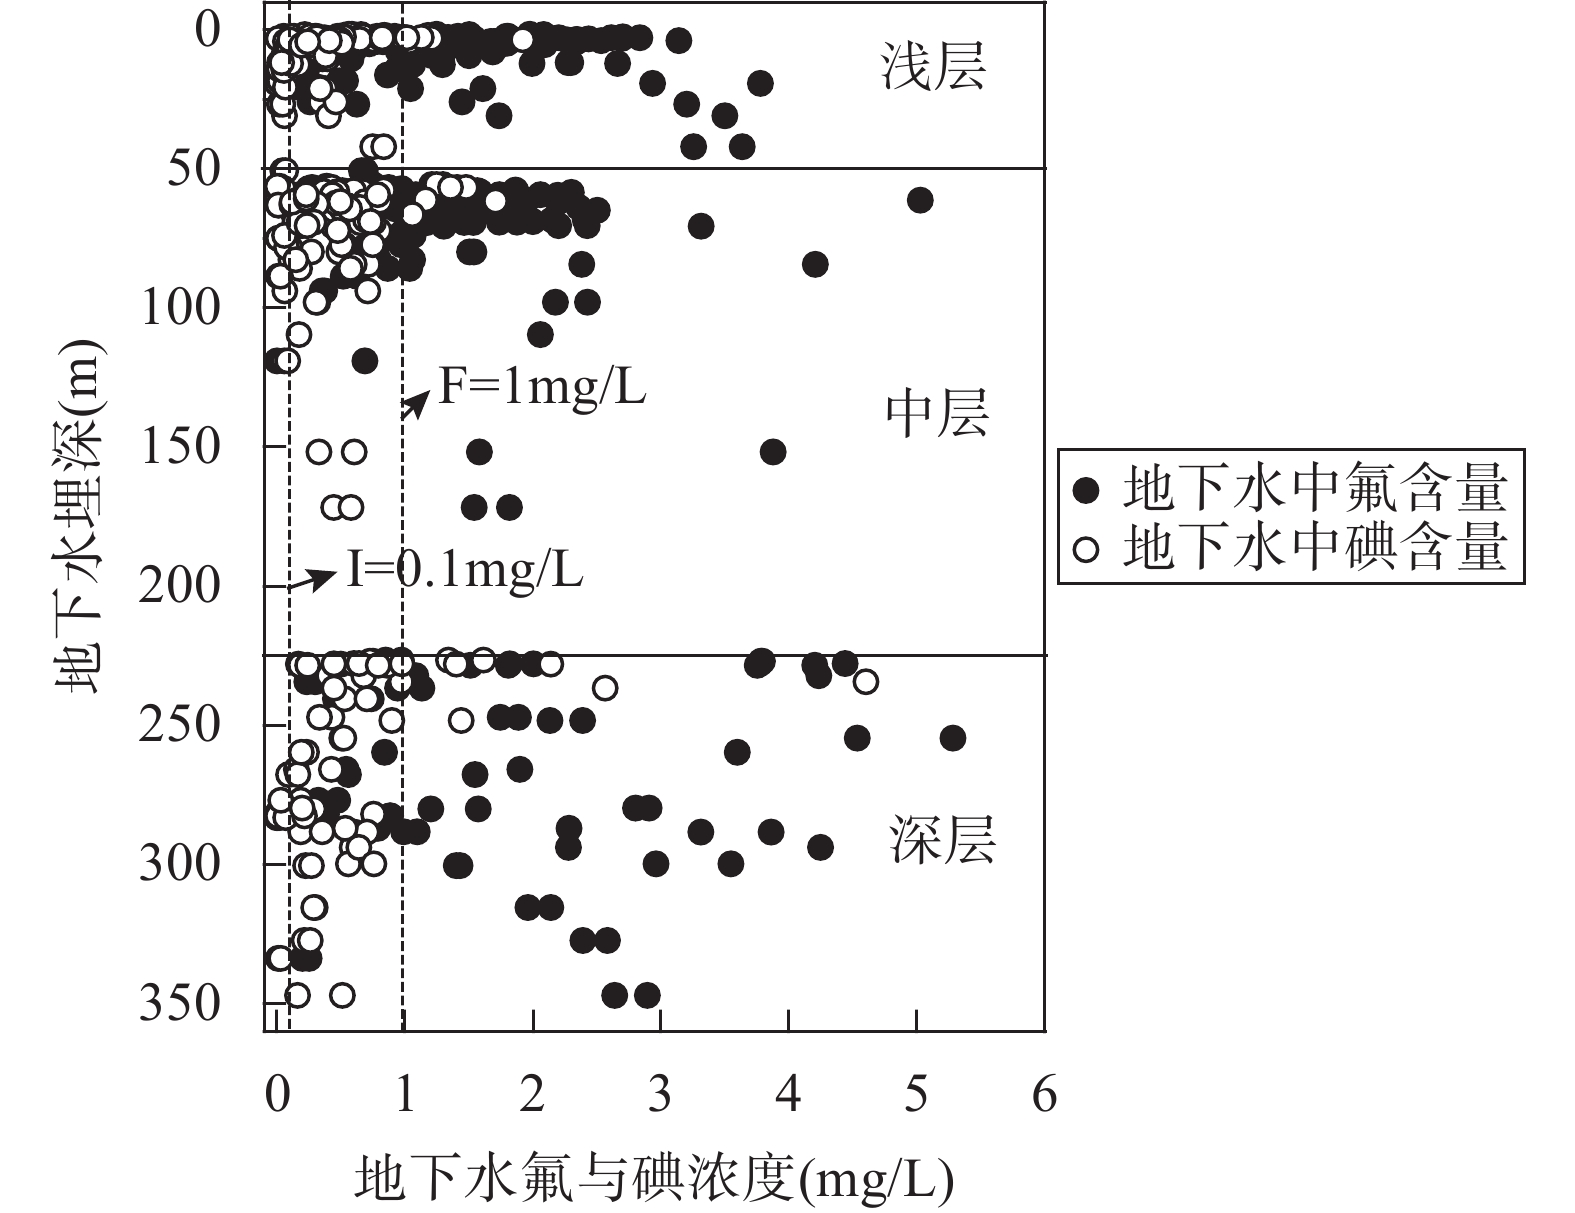
地下水作为鲁西北平原的主要水源,查明高氟、高碘地下水的成因和联系十分必要,可为当地的饮用水安全及解决地方病的研究提供借鉴。目前中国对鲁西北地区浅层高氟地下水的研究较多,但对深层高氟地下水的成因、高氟地下水和高碘地下水的联系有待加强。本文旨在揭示鲁西北平原地下水中氟与碘的空间分布特征,推测高氟地下水的形成机制,查清碘在地下水系统中富集的关键水文地球化学过程,探讨地下水中高氟与高碘的关系。采集浅层(0~55m)、中层(55~225m)、深层(>225m)地下水样品326件,并对18个水化学参数进行层次聚类分析,将地下水样品划分为高氟地下水、高碘地下水和高氟高碘地下水。再结合常规水化学指标和沉积物组分特征进行相关性分析,探讨高氟、高碘地下水的成因及联系。结果表明:高氟地下水与高碘地下水通常伴生出现,且高氟地下水和高碘地下水分布区水化学环境类似,高氟地下水主要集中在地面以下0~40m、50~110m以及225~305m深度内,其最大值(13.71mg/L)出现在地面以下110m深度处;高碘地下水主要集中在地面以下0~10m、55~65m以及225~285m深度内,其最大值(4.601mg/L)出现在234m深度处。含氟矿物萤石(CaF2)的溶解、强烈的蒸发浓缩作用、离子交换可能是高氟地下水的主要形成机制;地下水中的碘主要来自鲁西北平原沉积物中海洋生物和有机质,地下水受强烈的蒸发作用,水走盐留,水中碘浓度不断增加,沉积物淋溶以及氨氮和硫化物的还原溶解可能是导致地下水高碘的主要过程,弱碱性的水环境、还原条件和有机质的存在都是高碘水形成的重要因素。研究区强烈的蒸发浓缩作用、弱碱性的还原条件同时促进了氟和碘的富集。
Abstract:BACKGROUND Groundwater is the main water source in the Northwest Shandong Plain Province. It is necessary to find out the causes and connections of high fluorine and high iodine groundwater, which can provide reference for local drinking water safety and solving endemic diseases. At present, there is a lot of research on shallow high fluorine ground water in northwest Shandong, but little research focuses on the cause of deep high fluorine ground water, and the relationship between high fluorine groundwater and high iodine groundwater.
OBJECTIVES (1) To reveal the spatial distribution characteristics of fluorine and iodine in groundwater in the Northwest Shandong Plain; (2) To speculate the formation mechanism of high fluorine groundwater; (3) To identify the key hydrogeochemical processes of iodine enrichment in the groundwater system; (4) To explore the relationship between high fluorine and high iodine in groundwater.
METHODS Sediment samples were collected to investigate the lithology, mineral composition and elementary composition of the Northwest Shandong Plain. A total of 326 shallow (0-55m), middle (55-225m) and deep (>225m) groundwater samples were also collected. Hierarchical clustering analysis was applied to classify groundwater based on 18 water chemical parameters (pH, dissolved total solids, sulfate, chlorine, iron, volatile phenols, iodine, fluorine, arsenic, lead, calcium, magnesium, potassium, bicarbonate). The correlation analysis of water chemical parameters and sediment compositions was executed to investigate the causes of high fluorine and iodine groundwater. Furthermore, the calculation of the saturation index of fluorite further helped to determine the main formation mechanism of high fluorine groundwater. The water chemistry type of groundwater was obtained by drawing the piper three-line diagram, and combined with pH and other indicators, the main mechanism of the enrichment of deep high fluorine groundwater was studied. The piper three-line diagram and TDS relationship diagram were drawn to confirm the evaporation concentration mechanism of shallow high iodine groundwater. In addition, the hydrogeological conditions of the study area were analyzed, and the strong reducing environment of deep groundwater in the study area was judged by combining redox environmental sensitive factors, and the main reason for iodine enrichment in deep groundwater was obtained.
RESULTS The groundwater samples are divided into high fluorine groundwater, high iodine groundwater, and high fluorine and high iodine groundwater by hierarchical clustering analysis. High fluorine groundwater and high iodine groundwater have great similarities, and they are primarily the largest cluster. The high fluorine groundwater is mainly distributed at a depth of 0-40m, 50-110m and 225-305m below the ground surface, with the maximum value (13.7mg/L) occurring at a depth of 110m underground. The high iodine groundwater enriches at 0-10m, 55-65m and 225-285m deep, with the maximum value (4.6mg/L) appearing at 234m underground. Fluorine and iodine in groundwater are often associated, i.e., high fluorine groundwater also has higher iodine content. This is because the enrichment environmental conditions conducive to the two are similar. Strong evaporation concentration and leaching are the main processes leading to high fluorine and high iodine groundwater in the Northwest Shandong Plain. The fluorine-containing minerals and iodine-containing sediments in the shallow groundwater were continuously dissolved, which increased the content of fluorine and iodine in the groundwater. When rainfall occurs, fluorine and iodine in the soil dissolve or leach into the groundwater, resulting in its enrichment. In addition, the alkaline groundwater environment and high HCO3 − content can promote the dissolution of fluorine-containing minerals and the enrichment of iodine. The strong reducing groundwater environment and slow flow rate of deep groundwater can be conducive to fluorine enrichment. High fluorine groundwater and high iodine groundwater have similar chemical types, with the main anions of HCO3 and Cl, and the main cation of Na. In a weakly alkaline environment (pH=7-10), high fluorine and high iodine groundwater is formed through leaching and ion exchange.
CONCLUSIONS The dissolution of fluorine-rich minerals such as fluorite (CaF2), evaporation and ion exchange might be the dominant processes controlling fluorine mobilization in groundwater. The iodine in groundwater mainly comes from marine organisms and organic matter in sediments in the Northwest Shandong Plain. Evaporation, leaching and the reduction dissolution of ammonia nitrogen and sulfide are likely the primary processes leading to iodine enrichment. The weakly alkaline and reducing groundwater environment and the presence of organic matter are all important factors in the formation of high iodine groundwater. Generally, high fluorine groundwater also has high iodine content due to the similar formation mechanisms.
-

-

图 2 浅层地下水样本的树状图。聚类分析时使用平均连接(组间),红色与绿色虚线为同型种线,对应Y分别为7.5和1.5。浅层地下水可分为高TDS区和低TDS区,具有高氟高碘特征的簇数目最多,其中S2、S3、S4、S6、S8、S13、S17、S18为低TDS组中的高氟高碘簇
Figure 2.
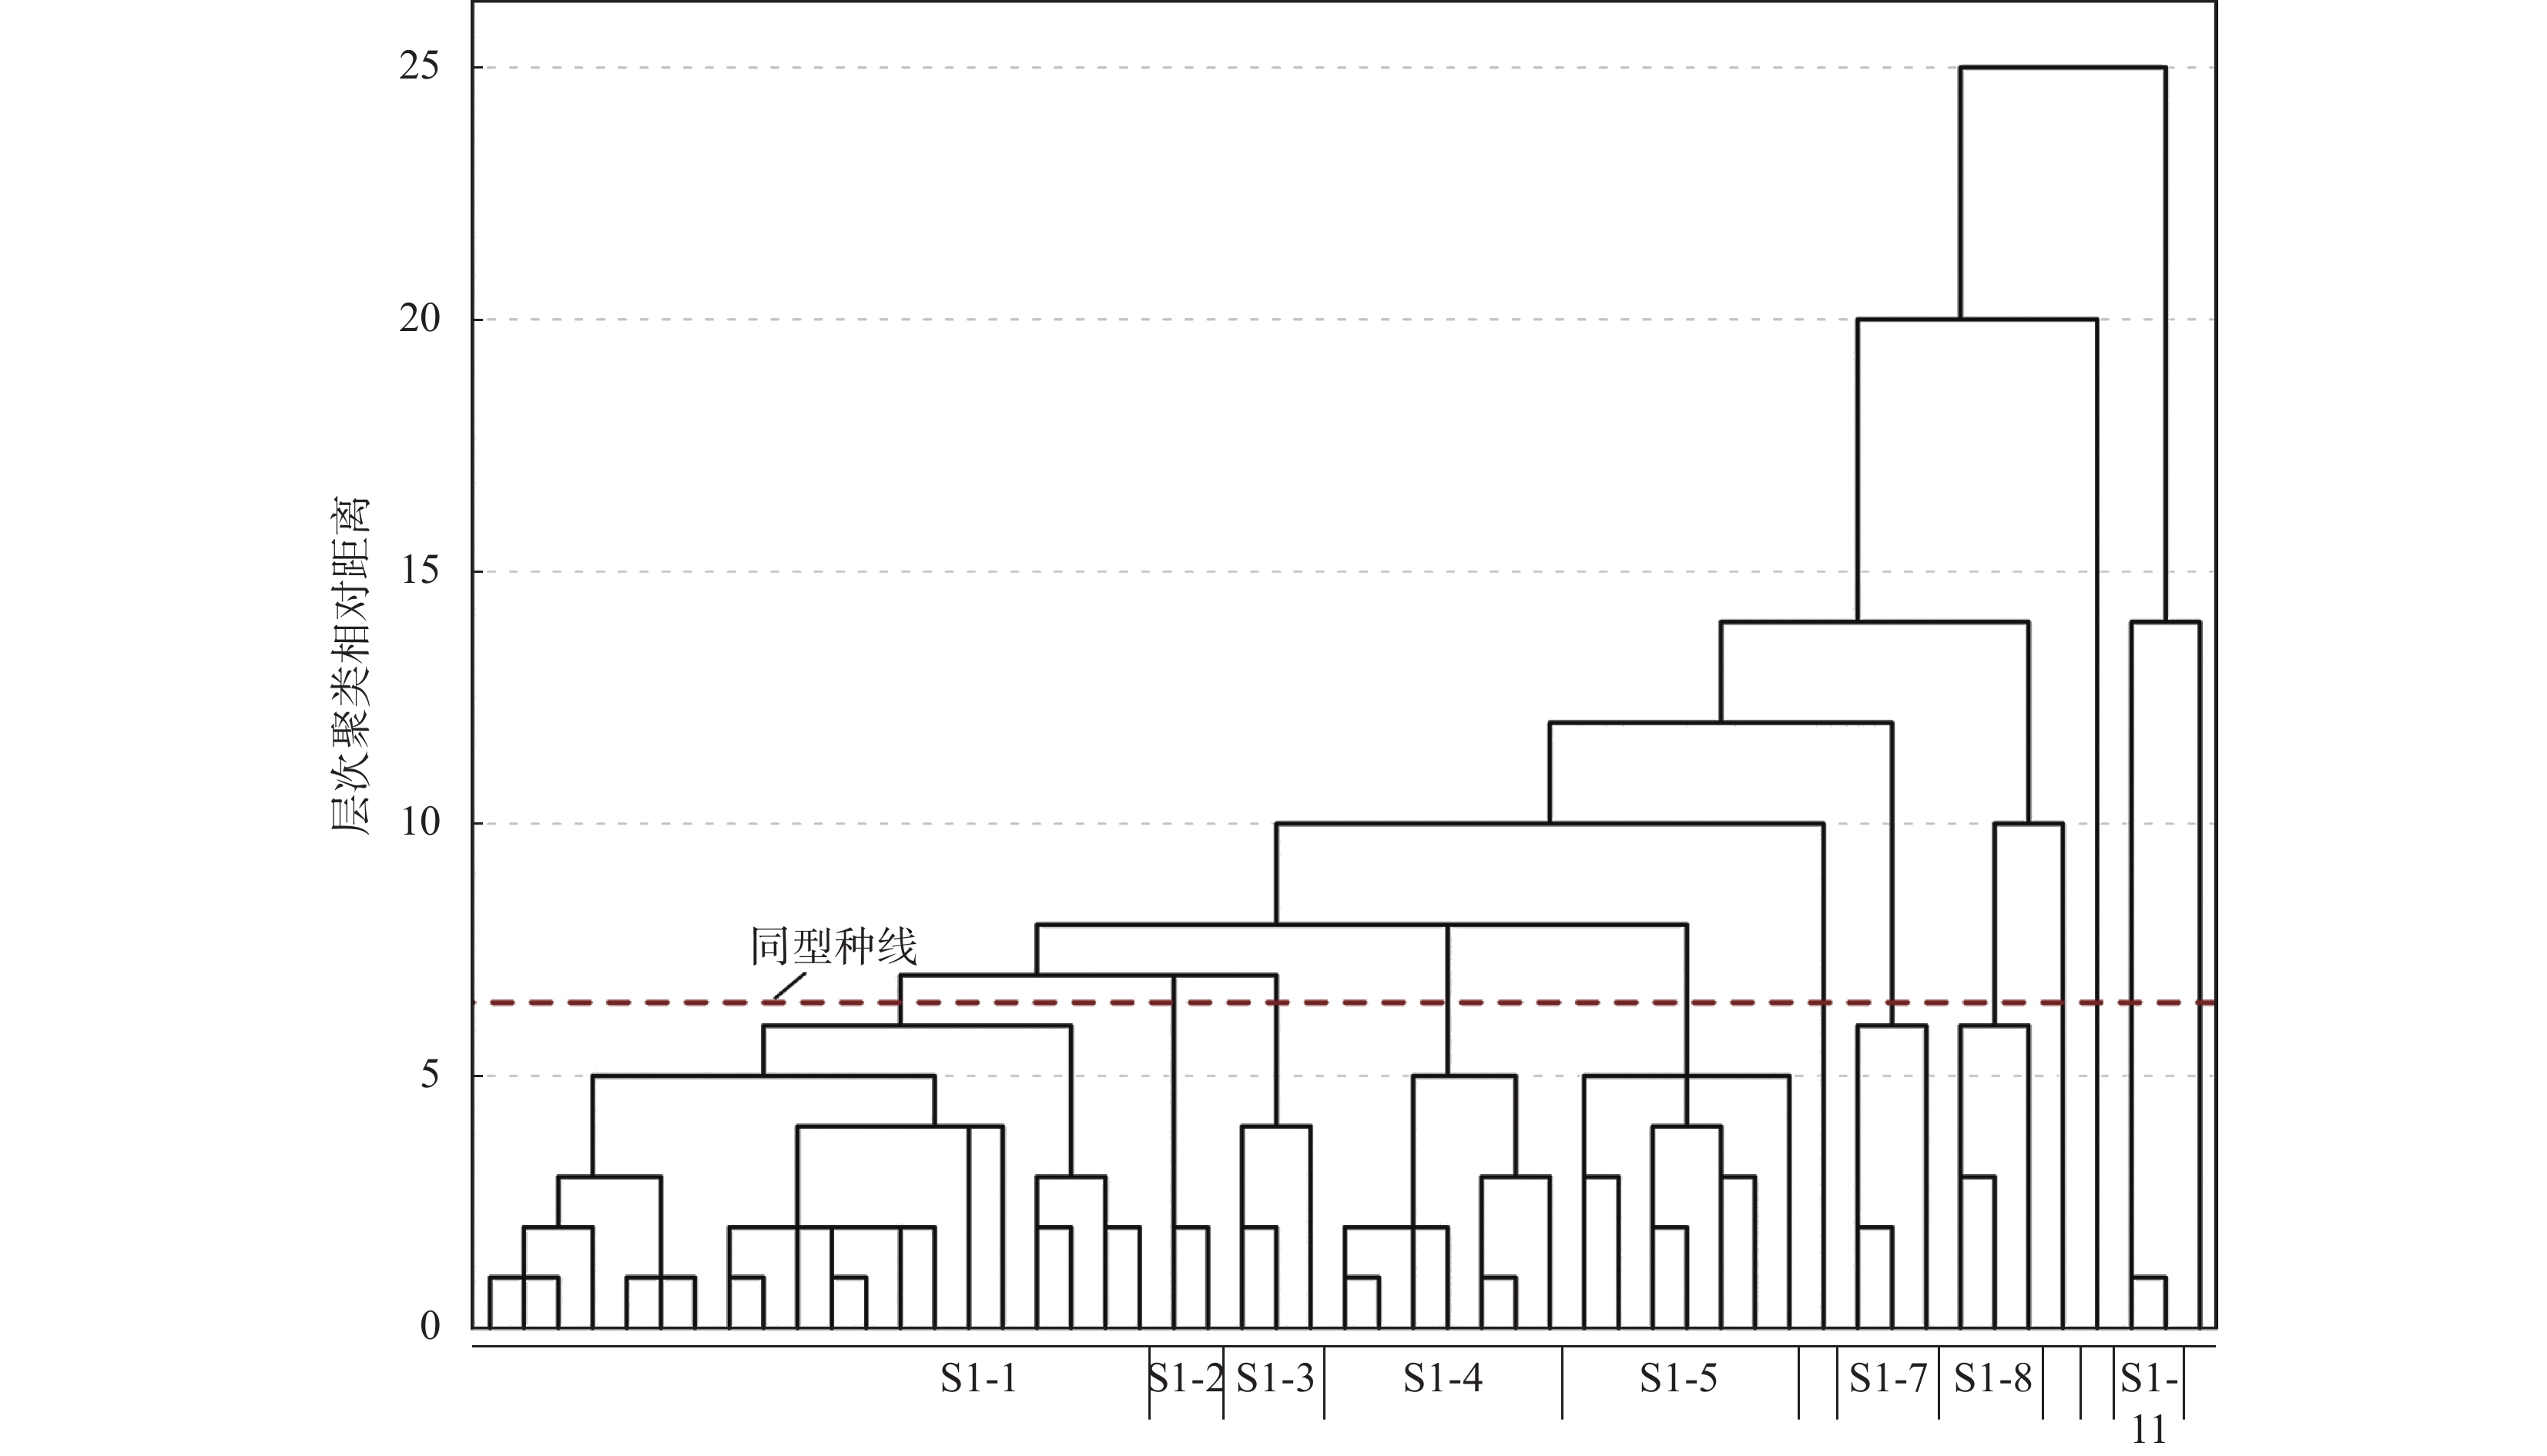
图 3 S1聚类树状图(红色虚线为同型种线,对应Y为5.5),浅层地下水最大聚类S1聚类结果显示S1-2、S1-3、S1-8、S1-10和S1-12为高氟高碘簇
Figure 3.
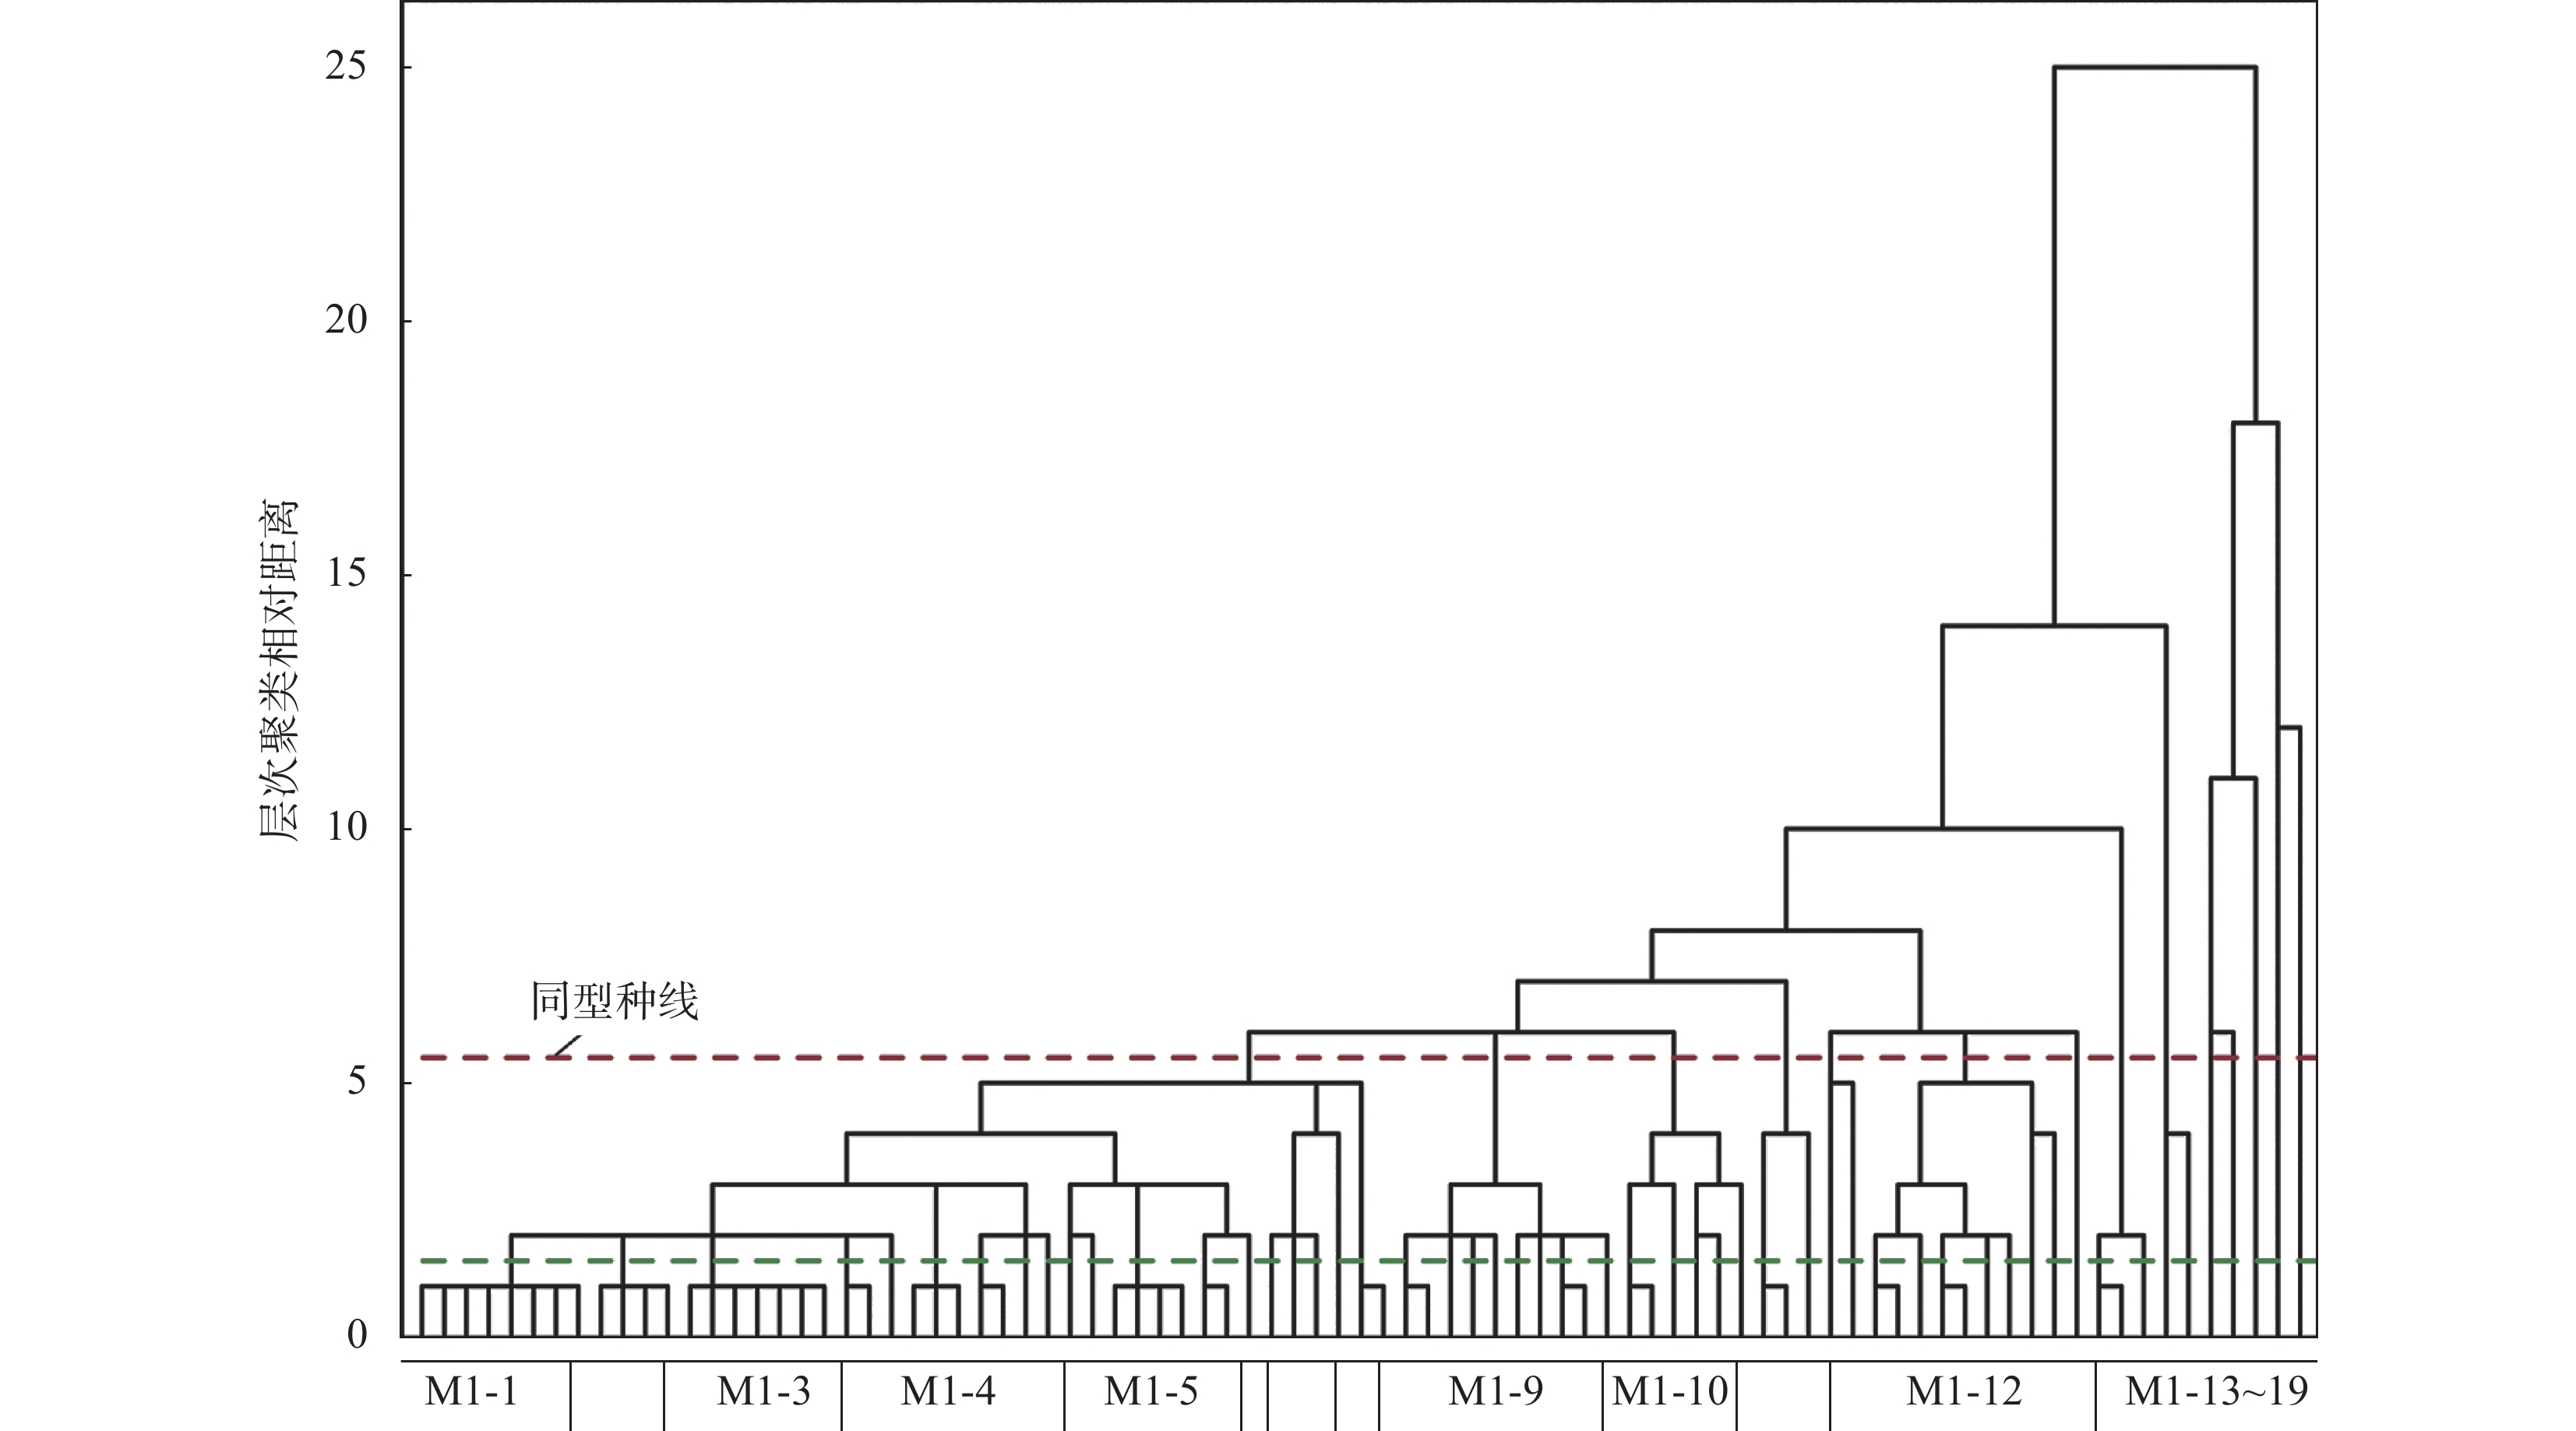
图 4 M1聚类树状图(红色与绿色虚线为同型种线,对应Y分别为5.5和1.5),中层地下水最大聚类M1中高氟高碘簇数目最多(M1-2、M1-3、M1-4、M1-5、M1-6、M1-7、M1-8、M1-9、M1-10、M1-12、M1-14、M1-15、M1-16、M1-17)
Figure 4.
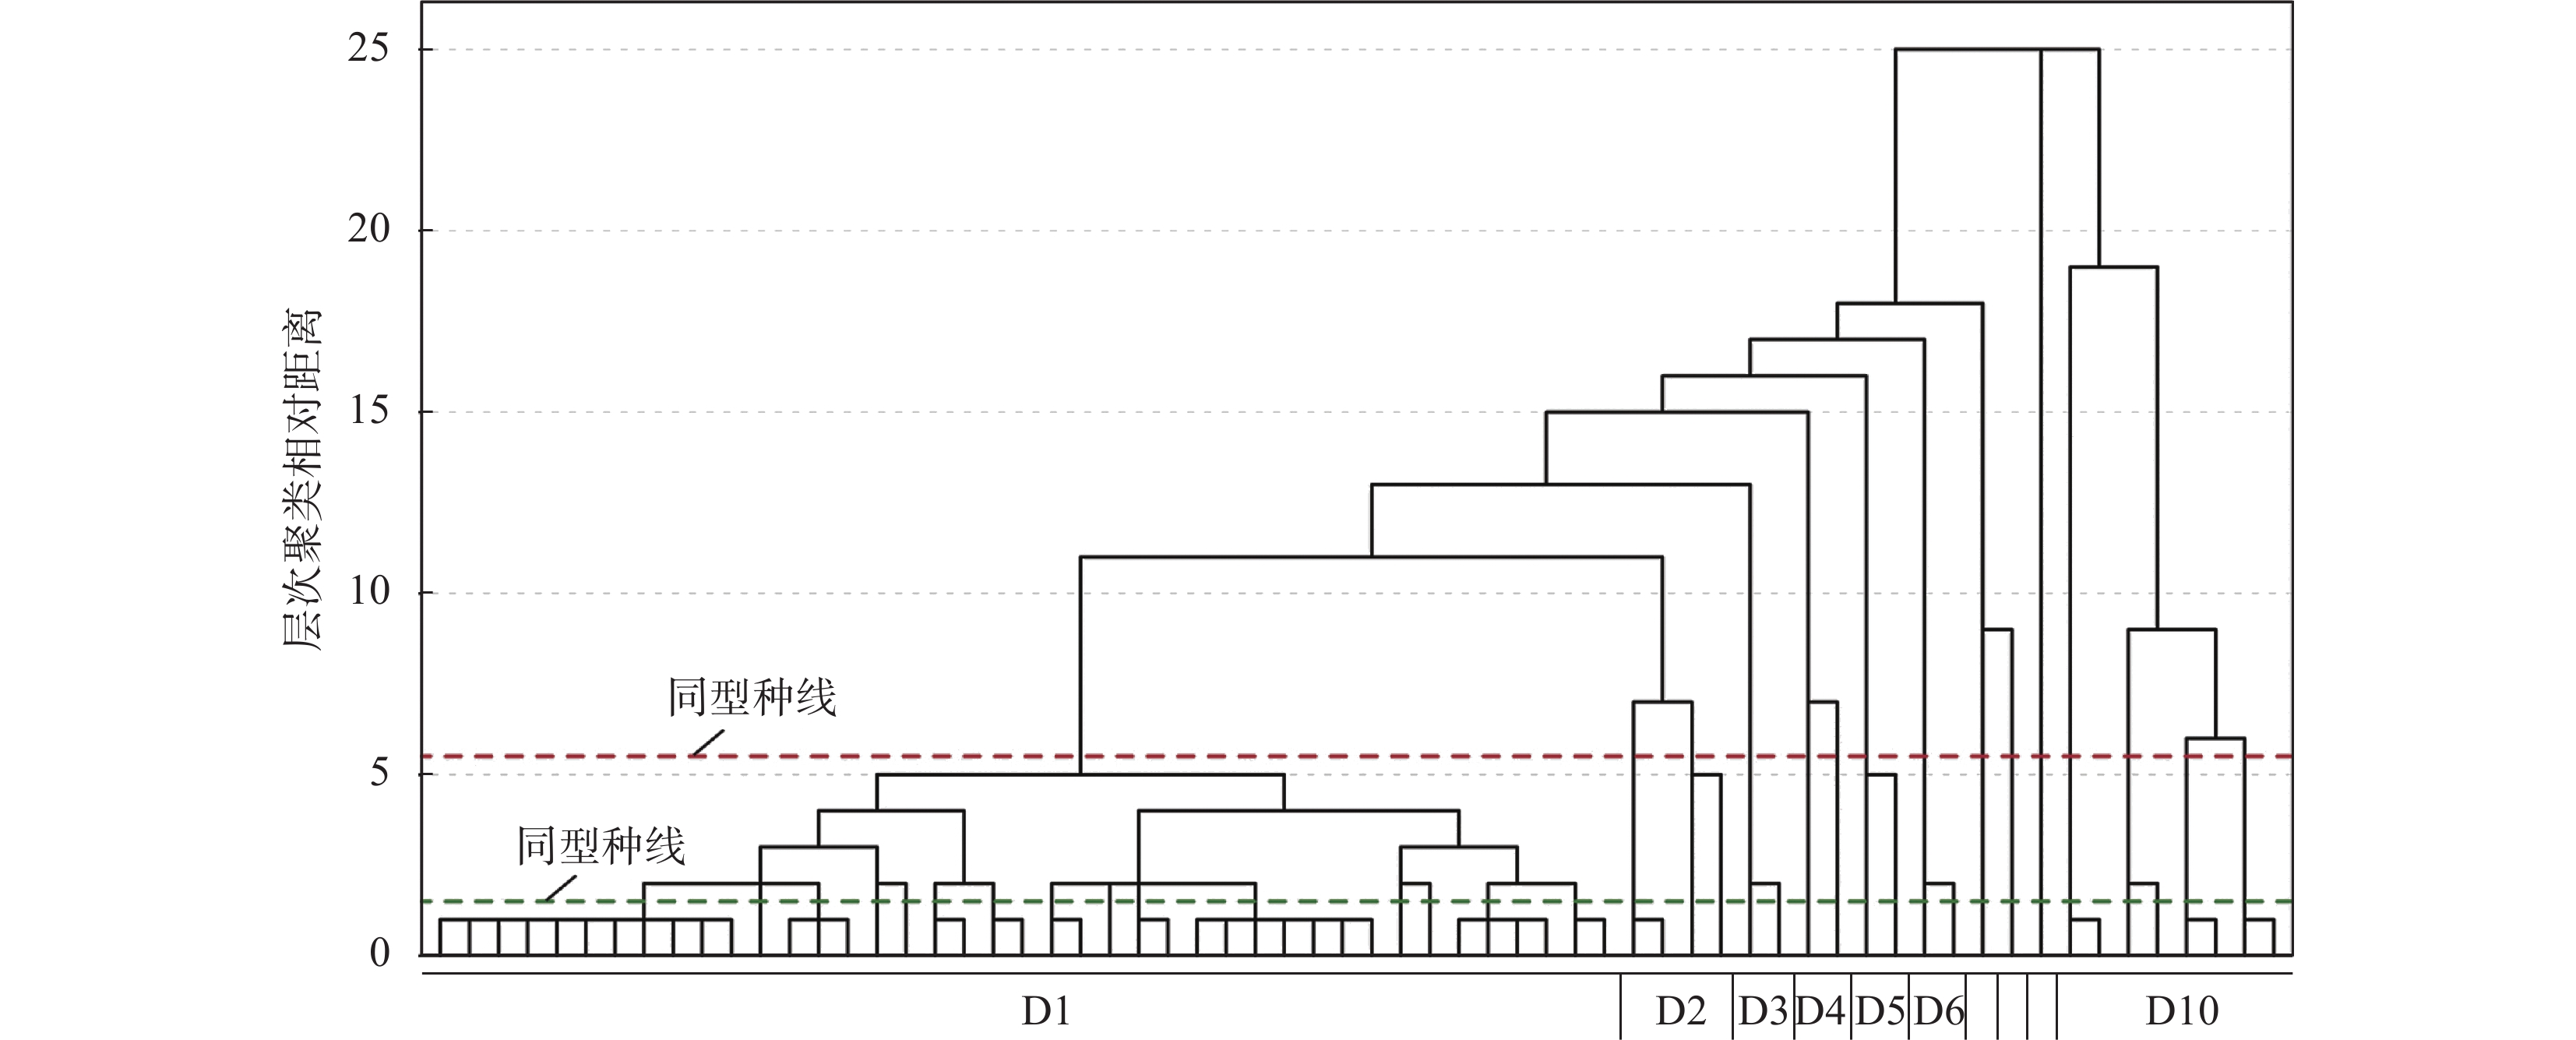
图 5 深层地下水样本树状图(红色与绿色虚线为同型种线,对应Y分别为5.5和1.5),深层地下水高氟高碘簇数目最多(D1、D2、D4、D5、D6、D7、D10),最大氟浓度5.3mg/L(D7),最大碘浓度4.6mg/L(D1)
Figure 5.

图 7 高氟、高碘地下水piper三线图,浅层、中层、深层高氟地下水的水化学类型分别为HCO3·SO4·Cl-Na·Mg 型、SO4·Cl-Na·Mg型和HCO3-Na型,高碘地下水中主要阳离子为Na+和Ca2+,主要阴离子为Cl−和HCO3 −
Figure 7.
表 1 样品分析指标的测定方法、仪器、检出限和精密度
Table 1. Measurement method, instrument, detection limit and precision of analysis indicators for samples.
分析指标 测定方法和仪器 方法检出限 方法精密度(RSD) pH 现场测定(雷磁DZB-712型,上海仪电科学仪器股份有限公司) 0.01 1.0% HS−、NH4 +-N 现场测定(DR2010型,美国HACA公司) 0.0001mg/L 1.0% 钠 电感耦合等离子体发射光谱法
(Optima 8300型,美国PerkinElmer公司)0.001mg/L 0.5% 铁、锰、铜、锌、铝、铅 电感耦合等离子体发射光谱法
(Optima 8300型,美国PerkinElmer公司)0.00001mg/L 0.5% 砷、镉 电感耦合等离子体质谱法
(NexION 300X型,美国PerkinElmer公司)0.00001mg/L 1.0% 碘化物 电感耦合等离子体质谱法
(NexION 300X型,美国PerkinElmer公司)0.001mg/L 1.0% 氟化物、氨氮 离子色谱法(ICS-900型,美国ThermoFisher公司) 0.01mg/L 1.0% 挥发性酚 分光光度法(722G型可见分光光度计,上海仪电分析仪器有限公司) 0.0003mg/L 0.5%  下载: 导出CSV
表 2 地下水水化学组分特征
Table 2. Hydrochemistry indicators in groundwater at different depths.
水样 参数 pH 总硬度
(mg/L)TDS
(mg/L)铁
(mg/L)锰
(mg/L)铜
(mg/L)锌
(mg/L)铝
(mg/L)挥发性酚类
(mg/L)浅层 最大值 9.55 25414 91017 0.20272 3.84536 0.34050 0.37555 32.94465 0.0146 最小值 6.83 60 333 - 0.00069 - - - - 平均值 7.66 2537 8746 0.00243 0.89456 0.00832 0.02864 1.87106 0.0018 中层 最大值 9.91 25324 106387 0.01386 6.08105 21.49463 1.19925 18.97229 0.0626 最小值 6.25 18 417 - 0.00293 - - - - 平均值 8.04 2219 8112 0.00103 0.65594 0.18282 0.06215 1.47228 0.0032 深层 最大值 10.42 9359 39360 2.41837 7.38455 0.23792 0.93538 7.20163 0.0278 最小值 7.25 5 372 - 0.01223 - - - - 平均值 8.75 1300 5080 0.05886 0.70026 0.00834 0.06693 0.60395 0.0038 水样 参数 氨氮
(mg/L)氟化物
(mg/L)碘化物
(mg/L)汞
(mg/L)砷
(mg/L)铅
(mg/L)钙离子
(mg/L)镁离子
(mg/L)钾离子
(mg/L)浅层 最大值 8.10 3.78 1.920 0.07320 0.03789 0.04437 1078.67 5872.91 969.98 最小值 - 0.13 - - - - 2.75 12.21 0.32 平均值 0.29 1.25 0.332 0.00146 0.00140 0.00260 204.95 488.41 23.84 中层 最大值 9.14 13.71 1.708 0.09990 0.01193 0.67751 1117.98 5628.00 771.97 最小值 - - - - - - 1.40 3.31 0.24 平均值 0.25 1.35 0.396 0.00127 0.00060 0.00779 188.22 421.61 20.49 深层 最大值 14.26 5.28 4.601 0.29170 0.01309 0.07461 1679.83 1830.37 50.69 最小值 - - - - - - - 0.16 0.57 平均值 0.44 1.92 0.581 0.00464 0.00107 0.00248 159.83 217.25 6.71 水样 参数 类型 硫酸根
(mg/L)硝酸根
(mg/L)重碳酸根
(mg/L)类型 硫酸根
(mg/L)硝酸根
(mg/L)重碳酸根
(mg/L)浅层 平均值 正常 1342.48 12.94 598.50 高碘 2055.44 1.42 670.43 平均值 中层 正常 - - - 高碘 1513.44 1.25 381.24 平均值 深层 正常 543.98 4.57 229.15 高碘 780.41 1.65 351.70
下载: 导出CSV
表 3 钻孔沉积物组分特征
Table 3. The content of each component in sediments at different depths in the two holes.
钻孔编号 深度 参数 pH 氨氮
(mg/L)氟
(mg/L)氯
(mg/L)硫酸根
(mg/L)钾
(mg/L)镁
(mg/L)钠
(mg/L)碳酸根
(mg/L)重碳酸根
(mg/L)G09 浅层 最大值 8.07 0.00272 0.02896 2.02 1.65 0.03649 0.20337 1.84 0.12 0.51 最小值 7.40 - 0.00078 0.01 0.01 0.00417 0.00471 0.02 - 0.33 平均值 7.62 0.00095 0.00599 0.80 0.57 0.01428 0.08170 0.73 - 0.42 ZK02 浅层 最大值 9.00 0.00077 0.01616 1.04 1.26 0.07529 0.07982 1.03 0.29 0.92 最小值 7.60 - 0.00280 0.09 - 0.00159 0.00457 0.20 - 0.21 平均值 8.19 0.00043 0.00745 0.46 0.56 0.00857 0.02838 0.57 0.09 0.41 中层 最大值 9.44 0.00042 0.0226 0.96 0.96 0.02731 0.04673 1.06 0.32 0.67 最小值 7.40 - 0.00187 0.11 0.10 0.00007 0.00427 0.21 - 0.15 平均值 8.49 0.00028 0.01033 0.39 0.26 0.00563 0.01391 0.47 0.13 0.40 深层 最大值 8.83 0.0006 0.02946 0.29 0.21 0.03516 0.03258 0.43 0.21 0.90 最小值 7.23 - 0.00122 0.01 0.02 0.00181 0.00239 0.07 - 0.19 平均值 7.89 0.00037 0.01099 0.09 0.07 0.00928 0.01271 0.27 0.06 0.60 注:最小值标注“-”表示低于检出限,相应的平均值也标注为“-”。
下载: 导出CSV
-
[1] 黄金明, 马玉琴, 任颖, 等. 2019年山东省饮水型地方性氟中毒病区监测结果分析[J]. 中华地方病学杂志, 2021, 40(2): 114−117.
Huang J M, Ma Y Q, Ren Y, et al. Analysis of surveillance results of drinking water-type endemic fluorosis in Shandong Province in 2019[J]. Chinese Journal of Endemiology, 2021, 40(2): 114−117.
[2] 梁娜, 王晓明, 张曼, 等. 2017年山东省水源性高碘地区碘营养状况分析[J]. 中华地方病学杂志, 2019(3): 203−206.
Liang N, Wang X M, Zhang M, et al. Analysis of iodine nutrition status in water-borne high iodine area of Shandong Province in 2017[J]. Chinese Journal of Endemic Diseases, 2019(3): 203−206.
[3] 高红旭, 张本政, 尹玉岩, 等. 基于空间地理加权回归分析的山东省居民饮用水水碘的影响因素分析[J]. 中华地方病学杂志, 2018, 37(12): 948−953.
Gao H X, Zhang B Z, Yin Y Y, et al. Analysis of influencing factors of iodine in drinking water of residents in Shandong Province based on spatial geographic weighted regression analysis[J]. Chinese Journal of Endemic Diseases, 2018, 37(12): 948−953.
[4] Azevedo F M, Machamba A A, Candido A C, et al. Correlation between drinking water and iodine status: A systematic review and meta-analysis[J]. Biological Trace Element Research, 2023, 201(1): 129−138. doi: 10.1007/s12011-022-03127-4
[5] 梁娜, 崔茹, 马冬梅, 等. 2018年山东省水源性高碘地区重点人群碘营养水平调查结果分析[J]. 中华地方病学杂志, 2020, 39(2): 108−111.
Liang N, Cui R, Ma D M, et al. Analysis of iodine nutrition level of key population in waterborne high iodine area of Shandong Province in 2018[J]. Chinese Journal of Endemiology, 2020, 39(2): 108−111.
[6] 钞虹, 李喜春, 刘军, 等. 水源性高碘、高氟及高砷环境的学龄儿童尿中碘、氟、砷水平及甲状腺肿患病情况[J]. 环境与职业医学, 2020, 37(7): 685−689.
Chao H, Li X C, Liu J, et al. Levels of iodine, fluorine and arsenic in the urine of school-age children in waterborne high-iodine, high-fluoride and arsenic environments and the prevalence of goiter[J]. Journal of Environmental & Occupational Medicine, 2020, 37(7): 685−689.
[7] Wang Y, Shvartsev S, Su C L. Genesis of arsenic/fluoride-enriched soda water: A case study at Datong, Northern China[J]. Applied Geochemistry, 2009, 24(4): 641−649.
[8] 邰苏日嘎拉, 李永春, 周文辉, 等. 宁夏固原市原州区高氟地区氟对人体健康的影响[J]. 岩矿测试, 2021, 40(6): 919−929.
Tai Surigala, Li Y C, Zhou W H, et al. Effects of fluorine on human health in high-fluorine areas of Yuanzhou District, Guyuan City, Ningxia[J]. Rock and Mineral Analysis, 2021, 40(6): 919−929.
[9] 郝启勇, 徐晓天, 张心彬, 等. 鲁西北阳谷地区浅层高氟地下水化学特征及成因[J]. 地球科学与环境学报, 2020, 42(5): 668−677.
Hao Q Y, Xu X T, Zhang X B, et al. Chemical characteristics and genesis of shallow high-fluorine groundwater in Yanggu area of Northwest Lubei[J]. Journal of Earth Sciences and Environment, 2020, 42(5): 668−677.
[10] 李清彩, 赵庆令, 安茂国, 等. 山东单县浅层高氟高碘地下水的水化学特征及成因分析[J]. 中国环境监测, 2022, 38(5): 134−143.
Li Q C, Zhao Q L, An M G, et al. Hydrochemical characteristics and genesis analysis of shallow high fluoride and high iodine groundwater in Shandong County[J]. China Environmental Monitoring, 2022, 38(5): 134−143.
[11] 董维红, 孟莹, 王雨山, 等. 三江平原富锦地区浅层地下水水化学特征及其形成作用[J]. 吉林大学学报(地球科学版), 2017, 47(2): 542−553.
Dong W H, Meng Y, Wang Y S, et al. Chemical characteristics and formation of shallow groundwater in Fujin area of Sanjiang Plain[J]. Journal of Jilin University (Earth Science Edition), 2017, 47(2): 542−553.
[12] 李凤嫣, 蒋天宇, 余涛, 等. 环境中氟的来源及健康风险评估研究进展[J]. 岩矿测试, 2021, 40(6): 793−807.
Li F Y, Jiang T Y, Yu T, et al. Research progress on source and health risk assessment of fluorine in the environment[J]. Rock and Mineral Analysis, 2021, 40(6): 793−807.
[13] 栾风娇, 周金龙, 曾妍妍, 等. 新疆南部典型地区地下水中氟的分布特征及其富集因素分析[J]. 环境化学, 2016, 35(6): 1203−1211.
Luan F J, Zhou J L, Zeng Y Y, et al. Distribution characteristics of fluorine in groundwater and analysis of enrichment factors in typical areas of Southern Xinjiang[J]. Environmental Chemistry, 2016, 35(6): 1203−1211.
[14] 刘春华, 王威, 杨丽芝, 等. 山东省地下水氟富集规律及其驱动机制[J]. 地质学报, 2021, 95(6): 1962−1972.
Liu C H, Wang W, Yang L Z, et al. Fluorine enrichment law and driving mechanism of groundwater in Shandong Province[J]. Acta Geologica Sinica, 2021, 95(6): 1962−1972.
[15] 吴艳飞, 李和学, 孙丹阳, 等. 华北平原超采区高氟地下水形成机理探究[J]. 安全与环境工程, 2022, 29(3): 127-135.
Wu Y F, Li H X, Sun D Y, et al. Safety and Environmental Engineering, 2022, 29(3): 127-135.
[16] 刘帅, 马雪梅, 刘志涛, 等. 鲁北平原高氟深层地下水的探究[J]. 山东国土资源, 2017, 33(6): 30−37.
Liu S, Ma X M, Liu Z T, et al. Exploration of high fluorine deep groundwater in Lubei Plain[J]. Shandong Land and Resources, 2017, 33(6): 30−37.
[17] 吴飞, 王曾祺, 童秀娟, 等. 我国典型地区浅层高碘地下水分布特征及其赋存环境[J]. 水资源与水工程学报, 2017, 28(2): 99−104.
Wu F, Wang Z Q, Tong X J, et al. Distribution characteristics of shallow high-iodine groundwater and its storage environment in typical areas of China[J]. Journal of Water Resources and Water Engineering, 2017, 28(2): 99−104.
[18] 韩术鑫, 张冲, 栾玲玉, 等. 东营市地下水碘化物的空间分布特征及影响分析[J]. 中国环境监测, 2018, 34(5): 68−74.
Han S X, Zhang C, Luan L Y, et al. Spatial distribution characteristics and impact analysis of iodide in groundwater in Dongying City[J]. China Environmental Monitoring, 2018, 34(5): 68−74.
[19] Li J X, Wang Y X, Xie X J, et al. Hydrogeochemistry of high iodine groundwater: A case study at the Datong Basin, Northern China[J]. Environmental Science-Processes & Impacts, 2013, 15(4): 848−859.
[20] 薛肖斌, 李俊霞, 钱坤, 等. 华北平原原生富碘地下水系统中碘的迁移富集规律: 以石家庄—衡水—沧州剖面为例[J]. 地球科学, 2018, 43(3): 910−921.
Xue X B, Li J X, Qian K, et al. Migration and enrichment of iodine in the primary iodine-rich groundwater system of North China Plain: A case study of Shijiazhuang—Hengshui—Cangzhou profile[J]. Geoscience, 2018, 43(3): 910−921.
[21] 徐芬, 马腾, 石柳, 等. 内蒙古河套平原高碘地下水的水文地球化学特征[J]. 水文地质工程地质, 2012, 39(5): 8−15.
Xu F, Ma T, Shi L, et al. Hydrogeochemical characteristics of high-iodine groundwater in Hetao Plain of Inner Mongolia[J]. Hydrogeology and Engineering Geology, 2012, 39(5): 8−15.
[22] Cloutier V, Lefebvre R, Therrien R, et al. Multivariate statistical analysis of geochemical data as indicative of the hydrogeochemical evolution of groundwater in a sedimentary rock aquifer system[J]. Journal of Hydrology, 2008, 353(3): 294−313.
[23] Güler C, Thyne G, Mccray J, et al. Evaluation of graphical and multivariate statistical methods for classification of water chemistry data[J]. Hydrogeology Journal, 2002, 10: 455−474. doi: 10.1007/s10040-002-0196-6
[24] Yidana S. Groundwater classification using multivariate statistical methods, Southern Ghana[J]. Journal of African Earth Sciences, 2010, 57(5): 455−469. doi: 10.1016/j.jafrearsci.2009.12.002
[25] Yidana S, Yakubo B, Akabzaa T. Analysis of groundwater quality using multivariate and spatial analyses in the Keta Basin, Ghana[J]. Journal of African Earth Sciences, 2010, 58(2): 220−234. doi: 10.1016/j.jafrearsci.2010.03.003
[26] Davis J, Kent D. Surface complexation modeling in aqueous geochemistry[J]. Reviews in Mineralogy and Geochemistry, 1990, 23: 177−260.
[27] Guo H, Wang Y. Hydrogeochemical processes in shallow Quaternary aquifers from the northern part of Datong Basin, China[J]. Applied Geochemistry, 2004, 19(1): 19−27. doi: 10.1016/S0883-2927(03)00128-8
[28] Jacks G, Bhattacharya P, Chaudhary V, et al. Controls on the genesis of some high-fluoride groundwater in India[J]. Applied Geochemistry, 2005, 20: 221−228. doi: 10.1016/j.apgeochem.2004.07.002
[29] 刘圣锋, 高柏, 张海阳, 等. 海拉尔盆地地下水氟的分布特征及富集机理[J]. 干旱区资源与环境, 2021, 35(10): 169−177.
Liu S F, Gao B, Zhang H Y, et al. Distribution characteristics and enrichment mechanism of groundwater fluorine in Hailaer Basin[J]. Journal of Arid Land Resources and Environment, 2021, 35(10): 169−177.
[30] 吕晓力, 刘景涛, 朱亮, 等. 甘肃省秦王川盆地地下水氟富集特征及影响因素[J]. 干旱区资源与环境, 2020, 34(3): 188−195.
Lyu X L, Liu J T, Zhu L, et al. Characteristics and influencing factors of fluorine enrichment in groundwater in Qinwangchuan Basin, Gansu Province[J]. Journal of Arid Areas Resources and Environment, 2020, 34(3): 188−195.
[31] 张茂增. 黄土的活性氟与黄土中地下水含氟量[J]. 第四纪研究, 1986(1): 28−32.
Zhang M Z. Active fluoride in loess and fluoride content in groundwater in loess[J]. Quaternary Sciences, 1986(1): 28−32.
[32] 潘欢迎, 邹常健, 毕俊擘, 等. 新疆阿克苏典型山前洪积扇内高氟地下水的化学特征及氟富集机制[J]. 地质科技通报, 2021, 40(3): 194−203.
Pan H Y, Zou C J, Bi J Q, et al. Chemical characteristics and fluorine enrichment mechanism of high-fluorine groundwater in a typical pre-mountain flood fan in Aksu, Xinjiang[J]. Geological Bulletin of China, 2021, 40(3): 194−203.
[33] Li J X, Wang Y X, Xie X J, et al. Hierarchical cluster analysis of arsenic and fluoride enrichments in groundwater from the Datong Basin, Northern China[J]. Journal of Geochemical Exploration, 2012, 118: 77−89. doi: 10.1016/j.gexplo.2012.05.002
[34] Wang Z, Guo H M, Xing S P, et al. Hydrogeochemical and geothermal controls on the formation of high fluoride groundwater[J]. Journal of Hydrology, 2021, 598: 126372. doi: 10.1016/j.jhydrol.2021.126372
[35] 任宇, 曹文庚, 潘登, 等. 2010—2020年黄河下游河南典型灌区浅层地下水中砷和氟的演化特征及变化机制[J]. 岩矿测试, 2021, 40(6): 846−859.
Ren Y, Cao W G, Pan D, et al. Evolutionary characteristics and change mechanism of arsenic and fluorine in shallow groundwater in typical irrigation areas of Henan in the lower reaches of the Yellow River from 2010 to 2020[J]. Rock and Mineral Analysis, 2021, 40(6): 846−859.
[36] Guo Q, Wang Y, Ma T, et al. Geochemical processes controlling the elevated fluoride concentrations in groundwaters of the Taiyuan Basin, Northern China[J]. Journal of Geochemical Exploration, 2007, 93(1): 1−12. doi: 10.1016/j.gexplo.2006.07.001
[37] 张卓, 柳富田, 陈社明, 等. 滦河三角洲高氟地下水分布特征、形成机理及其开发利用建议[J/OL]. 中国地质(2021-07-14) [2021-11-03]. http://kns.cnki.net/kcms/detail/11.1167.P.20210714.1640.002.html.
Zhang Z, Liu F T, Chen S M, et al. Distribution characteristics, formation mechanism and development and utilization suggestions of high fluoride groundwater in Luanhe River Delta[J/OL]. Geology of China: (2021-07-14) [2021-11-03]. http://kns.cnki.net/kcms/detail/11.1167.P.20210714.1640.002.html.
[38] 张杰, 周金龙, 乃尉华, 等. 叶尔羌河流域平原区高氟地下水成因分析[J]. 干旱区资源与环境, 2020, 34(4): 100−106.
Zhang J, Zhou J L, Nai W H, et al. Analysis of the genesis of high fluoride groundwater in the plain area of Yarkand River Basin[J]. Journal of Arid Land Resources and Environment, 2020, 34(4): 100−106.
[39] Handa B, Geochemistry and genesis of fluoride containing groundwaters in India[J]. Ground Water, 1975, 13: 275-281.
[40] 郭晓尉, 黄居梅, 翟丽屏, 等. 鲁西北平原高碘地区分布特征及碘盐覆盖率现状[J]. 中国地方病学杂志, 2005, 24(5): 543−543.
Guo X W, Huang J M, Zhai L P, et al. Distribution characteristics and iodized salt coverage in the northwestern plain of Lubei[J]. Chinese Journal of Endemiology, 2005, 24(5): 543−543.
[41] 王焰新, 李俊霞, 谢先军. 高碘地下水成因与分布规律研究[J]. 地学前缘, 2022, 29(3): 1−10.
Wang Y X, Li J X, Xie X J. Study on the origin and distribution of high iodine groundwater[J]. Earth Science Frontiers, 2022, 29(3): 1−10.
[42] Schlegel M L, Reiller P, Mercier-Bion F, et al. Molecular environment of iodine in naturally iodinated humic substances: Insight from X-ray absorption spectroscopy[J]. Geochemica et Cosmochimica Acta, 2006, 70(22): 5536−5551. doi: 10.1016/j.gca.2006.08.026
[43] 王雨婷, 李俊霞, 薛肖斌, 等. 华北平原与大同盆地原生高碘地下水赋存主控因素的异同[J]. 地球科学, 2021, 46(1): 308−320.
Wang Y T, Li J X, Xue X B, et al. Similarities and differences between the main controlling factors of native high iodine groundwater in the North China Plain and the Datong Basin[J]. Earth Science, 2021, 46(1): 308−320.
[44] Cao W G, Guo H M, Zhang Y L, et al. Controls of paleochannels on groundwater arsenic distribution in aquifers of alluvial plain in the Hetao Basin, China[J]. Science of the Total Environment, 2017, 613-614(1): 958−968.
-

图(10)
表(3)
计量
- 文章访问数: 1927
- PDF下载数: 178
- 施引文献: 0