Determination of Rhenium in Tungsten and Molybdenum Ore by ICP-MS with Lefort Aqua Regia Microwave Digestion and 8-hydroxyquinoline Precipitation
-
摘要:
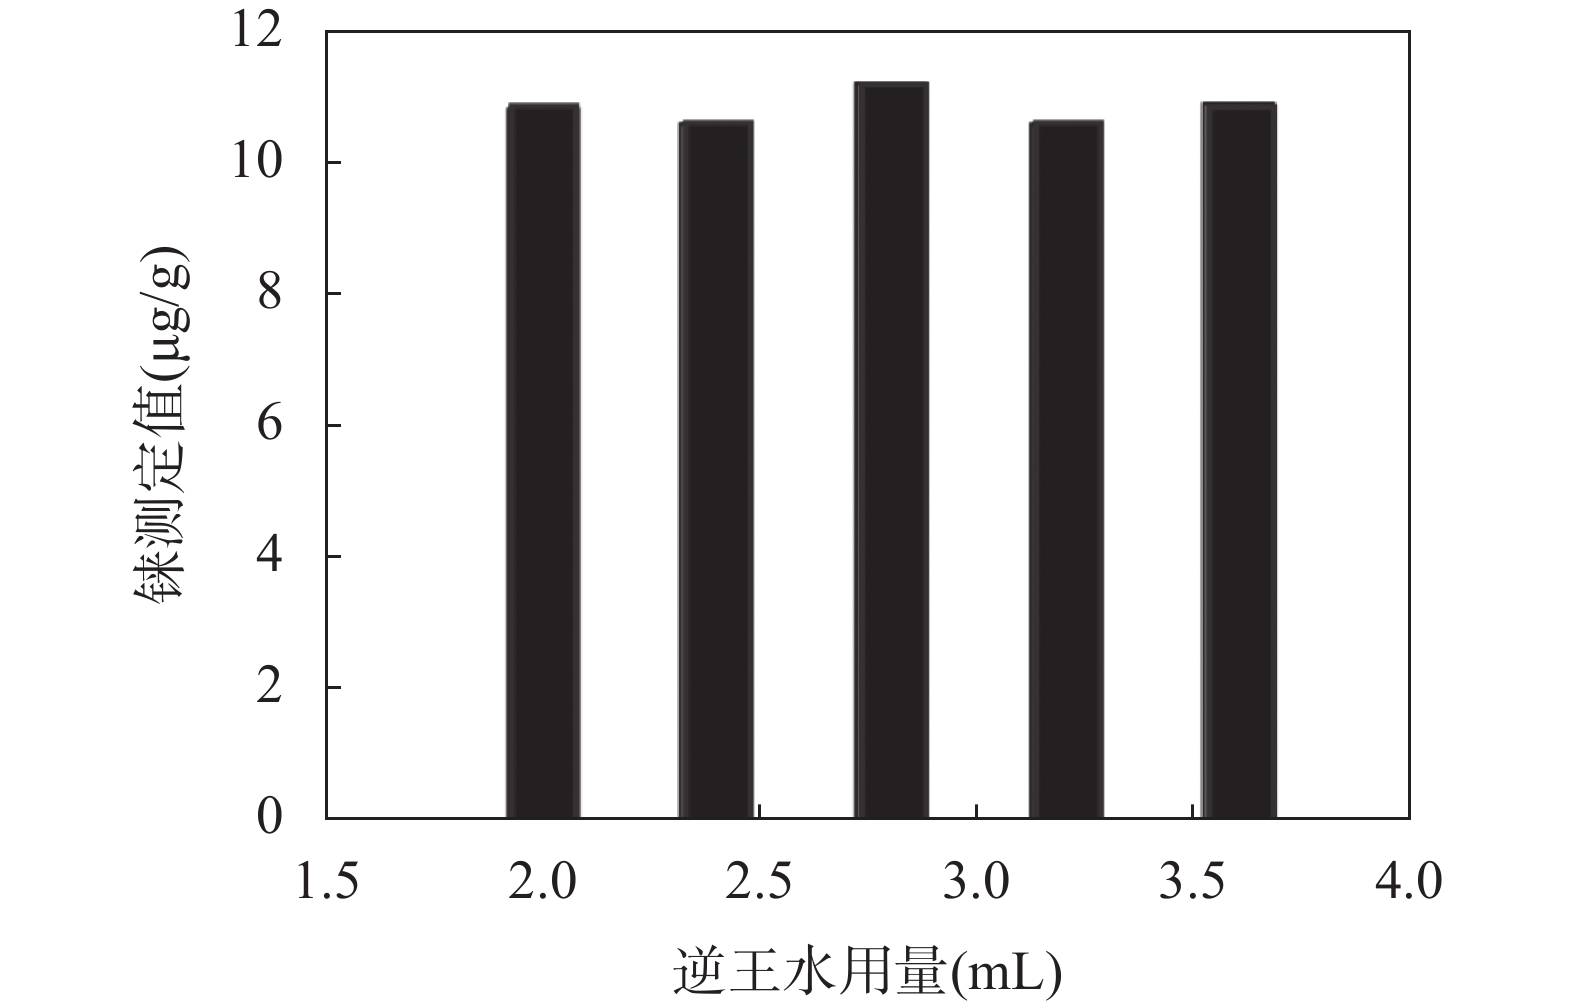
铼在地壳中的丰度低且分散,多伴生于钨钼矿中,现有方法常采用碱熔富集,流程长且繁琐,亟需开发一种简便快捷的检测方法。本文建立了逆王水微波消解钨钼矿石样品,8-羟基喹啉沉淀分离钨钼元素,与电感耦合等离子体质谱联用的检测方法。结果表明:0.0500g样品,2.80mL逆王水即可实现铼元素的全部溶出,0.20mL有机沉淀剂8-羟基喹啉(3%)在乙酸-乙酸铵缓冲体系(pH 4.5)中可选择性沉淀钼、钨元素,有效消除基体元素钼、钨(沉淀率>95%)对Re定量干扰,同时不引入新干扰元素。相比现有分离富集前处理流程更加简便快捷,前处理时间缩短为现有方法的1/4;该方法对Re的检出限为6.9ng/g,采用国家一级标准物质钼矿石(GBW07238)、钼矿石(GBW07285)、铼钼矿石(GBW07373)和钨锡铋矿石(GBW07369)对方法的准确度进行了验证,测定值与推荐值吻合,相对误差为0.71%~6.07%,RSD<5%。本方法建立的“消解-分离富集”处理流程所需时间从常规的8~12h缩短至2h左右,在准确定量矿石样品中Re的同时简化了样品前处理流程,快速的样品处理及低廉的测试成本有助于关键稀有金属矿产的开发利用。
Abstract:BACKGROUND Rhenium (Re) is a key mineral resource widely used in the aerospace field. As one of the rarest elements in the earth, Re rarely exists as an independent mineral but is dispersed in various sulfide ores. Due to its low content and dispersed distribution, the highly sensitive and accurate quantification of Re (ng/g) in complex ore is one of the challenges of modern geological analysis. In order to solve the problem of incomplete decomposition and the great interference caused by co-dissolution of high abundance matrix elements, the existing “digestion-separation” method using 8-12h for one sample is complicated, time-consuming and labor-intensive. Therefore, the development of a simple, fast and low-cost method is urgently required.
OBJECTIVES To establish an analytical method based on Lefort aqua regia microwave digestion, molybdenum and tungsten precipitation, ICP-mass spectrometry for the determination of rhenium in ore.
METHODS Lefort aqua regia microwave digestion was used to fully decompose ore, and then the organic precipitator 8-hydroxyquinoline (8-HQ) was used to selectively precipitate high-abundance matrix interference elements molybdenum (Mo) and tungsten (W) in the acid-ammonium acetate buffer system (pH 4.5). The organic precipitator 8-HQ was used to precipitate Mo and W to produce stable hydroxyquinoline molybdenum [MoO2(C9H6ON)2] and tungsten [WO2(C9H6ON)2], thereby removing the high-abundance Mo and W in the digestion solution and reducing the interference of matrix on the quantitative analysis of Re. The relevant parameters of Lefort aqua regia microwave digestion and 8-HQ precipitation were systematically studied, and the digestion and precipitation properties were deeply studied by using national certified reference materials.
RESULTS The key parameters that influence ore digestion including volume of Lefort aqua regia and temperature of microwave digestion, were determined as 2.8mL and 130℃ for step 1 and 150℃ for step 2 separately. The addition amount of 8-HQ was also determined as 0.2mL (3%, w%) by comparing precipitation rates of W, Mo and W-Mo solution (25g/mL) under different amounts, and results showed that the precipitation rate was greater than 95% in different ore digestion solutions. In the established method, the detection limit of Re was 6.9ng/g, the relative error was 0.71%-6.07%, and the RSD was less than 5%.
CONCLUTIONS The method established in this study can effectively eliminate the interference of matrix elements molybdenum and tungsten on Re quantification without introducing new interference elements. Compared with the existing “digestion-separation” process, the method is simpler and faster (shortened from 8-12h for one sample to approximately 1h) and the method has been successfully applied in molybdenum ore, rhenium molybdenum ore and tungsten-tin bismuth ore. This study proves that interfering instead of target element precipitation is feasible and provides a simple, fast and low-cost method for accurate quantification of Re in complex ore.
-
1. 引言
西秦岭造山带位于青藏高原的东北缘,其岩石圈结构与变化记录着高原向东北发展演化的深部过程信息。西秦岭造山带又处于中国大陆东西及南北构造交接部位,特殊的构造环境使其成为研究中国大陆南北汇聚及其与祁连造山带、南北构造带构造转折关系的窗口,地震活动频繁。中国大陆许多关键时期的构造演化、资源开发及大陆动力学等重大问题,都与西秦岭造山带密切相关。西秦岭造山带也是我国资源开发的远景区,特别是随着全球石油的紧缺,我国石油地质界加快了新区勘探,西秦岭造山带与其两侧盆地被列为中国油气勘探评价值得重视和重新认识的战略选区之一。
合作—永靖地震反射剖面跨越西秦岭和南祁连两条造山带。其中以西秦岭北缘逆冲—走滑断裂为界,南部为西秦岭造山带,北部临夏盆地(图 1)。在临夏盆地内部,零星出露钾长花岗岩和基性岩脉,反映了临夏盆地的基底物质组成。该盆地记录了青藏高原隆生过程中的大量构造事件和气候事件而且由于水系的切割,地层出露完好,因而临夏盆地是利用沉积物揭示青藏高原隆升过程的理想场所(李吉均等,1995;方小敏等,1997;郑德文等,2003)。
临夏盆地记录的两次青藏高原隆升的时间,分别为约14 Ma和5.4~8.0 Ma(郑德文等,2003)。其中,约14 Ma的快速剥露事件可能反映青藏高原北部由于岩石圈对流减薄而发生的地壳增厚、高原隆升事件,与区域上钾质碱性火山岩的活动时限相似(喻学惠等, 1994, 2001);后一期事件可能与高原隆升到相当高度后,由于维持其巨大高度和继续调节南北汇聚的需要, 青藏高原的东北边界向东向北扩展有关(郑德文等,2003)。
地震反射剖面测线(图 1中的虚线)跨越西秦岭和位于南祁连的临夏盆地。为更好地解译地震反射剖面揭示的深部地质构造所代表的构造意义,在野外观测的基础上,对合作—永靖地震反射剖面沿线的重要地质体进行了系统采样,开展了锆石U-Pb地质年代学、全岩元素和同位素(Sr和Nd)组成的测试工作,来厘定不同岩浆岩的形成年代和地球化学性质。
西秦岭—临夏盆地深地震反射剖面沿线重要岩浆岩岩石地球化学测试数据集元数据简表如表 1所示。
表 1. 数据库(集)元数据简表2. 区域地质概况
临夏盆地的西北侧为地形较高的积石山,出露花岗岩和巨晶闪长岩,其中的花岗岩与临夏盆地内部的类似。临夏盆地位于兰州市西南约100 km, 是一个以青藏高原东北缘雷积山深大断裂、西秦岭北缘深大断裂,和马衔山东延余脉围成的具有山前坳陷性质的盆地,属于古近-新近纪大型陇中盆地的西南隅(图 1),盆地开始发育于30 Ma年前,此后新生代地层几乎连续完整至今,沉积中心古近-新近纪沉积物厚达1600 m。
3. 数据采集和处理方法
3.1 样品采集
在项目执行过程中,沿甘肃兰州—合作一线的开展了详细地野外地质调查,采集了有代表性的岩石样品(图 2, 图 3),其中锆石U-Pb年代学样品7件,包括花岗岩、钾长花岗岩、花岗闪长岩、闪长岩、英安岩和安山岩。
3.2 样品测试方法及精度
3.2.1 锆石LA-MC-ICP MS分析方法和锆石特征
选择代表性样品,粉碎至60目,通过淘洗—磁选—电磁选—手工挑取等一系列方法分离锆石。在双目镜下,选择干净透明的单矿物颗粒,逐粒整齐排放于双面胶带上,按上PVC环,将环氧树脂和固化剂混合均匀后注入PVC环,然后放入烘箱,60摄氏度恒温48 h。取出样品靶,利用砂纸磨至样品中心部位并用抛光布抛光。靶制备完成后对矿物进行反射光和透射光显微照相,以查明样品表面的裂隙和内部的包裹体。之后,在扫描电镜实验室对锆石进行阴极发光图像采集,检查矿物颗粒的内部结构和成分环带,以确定合适的位置进行分析测试。在分析测试前,用酒精超声清洗样品靶,除去可能的表面污染。采用离子探针方法分析的样品靶需在分析前进行表面镀金。阴极发光成像观察在北京离子探针中心进行,在中国地质科学院地质研究所,利用扫描电镜进行了BSE图像和锆石内部包裹体的成分测试。通过阴极发光和BSE图像来查明锆石内部生长层的分布和结构,选取测试点。锆石U-Pb同位素定年测试在中国地质科学院矿产资源研究所MC-ICP-MS实验室完成,锆石定年分析所用仪器为Finnigan Neptune型MC-ICPMS及与之配套的Newwave UP 213激光剥蚀系统。激光剥蚀所用斑束直径为25μm,频率为10 Hz,能量密度约为2.5 J/cm2,以He为载气。信号较小的207Pb,206Pb,204Pb(+204Hg), 202Hg用离子计数器(multi-ion-counters)接收,208Pb,232Th,238U信号用法拉第杯接收,实现了所有目标同位素信号的同时接收并且不同质量数的峰基本上都是平坦的,进而可以获得高精度的数据,均匀锆石颗粒207Pb/206Pb,206Pb/238U,207Pb/235U的测试精度(2)均为2%左右,对锆石标准的定年精度和准确度在1%(2)左右。LA-MC-ICP-MS激光剥蚀采样采用单点剥蚀的方式,数据分析前用锆石GJ-1进行调试仪器,使之达到最优状态, 锆石U-Pb定年以锆石GJ-1为外标,U、Th含量以锆石M127(U:923×10-6; Th:439×10-6; Th/U: 0.475. Nasdala et al, 2008)为外标进行校正。测试过程中在每测定5~7个样品前后重复测定两个锆石GJ1对样品进行校正,并测量一个锆石Plesovice,观察仪器的状态以保证测试的精确度。数据处理采用ICPMSDataCal程序(Liu et al. 2010),测量过程中绝大多数分析点206Pb/204Pb > 1000, 未进行普通铅校正,204Pb由离子计数器检测,204Pb含量异常高的分析点可能受包体等普通Pb的影响,对204Pb含量异常高的分析点在计算时剔除,锆石年龄谐和图用Isoplot 3.0程序获得。完成了7件锆石U/Pb地质年代学测试。
样品0412为英安岩,采自于西秦岭造山带内,锆石呈自形、长柱状,棱角清晰,粒度在100~250 μm,长宽比一般为2:1,个别可达3:1。锆石阴极发光和背散射图像都显示锆石没有核部,较干净,基本上不含包裹体,具明显的韵律环带结构(图 4a),核部环带密度小,而边部环带密度大,为岩浆锆石。
ZHZ08为花岗闪长岩,采自于西秦岭造山带内。锆石呈自形、柱状,棱角清晰,粒度在100~250 μm,长宽比一般为2:1~3:1。锆石阴极发光和背散射图像都显示锆石没有核部,较干净,个别含包裹体,具弱化的韵律环带结构(图 4b),为岩浆锆石,但可能受到后期热事件的影响。
ZHZ09为安山岩,采自于西秦岭造山带内,锆石呈自形—半自形,大部分为长柱状,个别为浑圆状,粒度在50~200 μm,长宽比一般为2:1~3:1。锆石阴极发光和背散射图像都显示锆石没有核部,较干净,个别含包裹体,具弱化的韵律环带结构(图 4c),个别锆石边部由于含有较高的U和Th,显示暗色发光的韵律环带,但是与核部锆石为同一期,可能是由于同期事件中锆石生长时U、Th变化引起的。
0419为钾长花岗岩,采自于积石山。锆石呈自形—半自形,长柱状,粒度在100~200 μm,长宽比一般为2:1,个别达4:1。锆石阴极发光和背散射图像都显示锆石具有核-幔-边结构,白色模糊环带的核部,灰色弱环带的幔部和黑色弱发光的边部,个别锆石的幔部含有包裹体(图 4d)。
0429B为闪长岩,采自于临夏盆地的北侧的唐旺镇。锆石呈半自形—他形,柱状、浑圆状,粒度在50~150 μm,大部分长宽比为2:1,少量为1:1。锆石阴极发光和背散射图像都显示锆石具有核-幔-边结构,弱振荡环带的核部,灰色无环带的幔部和白色的窄边(图 4e)。
0429C为钾长花岗岩,采自于临夏盆地的北侧的唐旺镇。锆石呈自形,长柱状,粒度为100~150 μm,长宽比一般为2:1。锆石阴极发光和背散射图像都显示锆石具有核-边结构,白色含有包裹体的核部,明显的振荡环带的边部(图 4f)。
0430-2为花岗岩,采自于临夏市北3 km处。锆石呈自形,柱状,粒度在150~200 μm,长宽比为2:1。锆石阴极发光和背散射图像都显示锆石显示均一的明显振荡环带(图 4g)。
3.2.2 主量元素、微量元素分析方法
为确定岩石的地球化学特征,分析了岩石的全岩主量、微量元素和Rb-Sr、Sm-Nd同位素组成。主量及微量元素的测试在国土资源部国家地质实验测试中心进行。全岩主量元素采用X荧光光谱(XRF)玻璃熔片法进行分析。流程如下:首先将全岩粉末在105 ℃的烘箱中烘烤2 h,去除样品中的吸附水。将样品从烘箱中取出后迅速放入干燥器中冷却。待样品冷却至室温后,准确称取0.5 g (0.5000±0.0007g)样品放入已恒重的坩埚中,之后将盛有样品的坩埚放入马弗炉中加热至1000 ℃灼烧1.5 h。取出灼烧后的样品置于干燥器中,冷却至室温后称重,计算样品的烧失量。之后,准确称取混合试剂(成分为溶剂Li2B4O7、助溶剂LiF、氧化剂NH4NO3) 5 g,与样品混合并研磨至均匀。将混合样品倒入铂金坩埚中,加入3滴溴化锂(脱模剂),在高频熔样机内1000 ℃下充分熔融后倒出,冷却形成玻璃熔片。最后,利用XRF(X荧光光谱仪3080E)对样品进行主量元素分析。在分析过程中,选用国家标准物质中心提供的岩石标样GSR.1 (花岗岩)、GSR.2(安山岩),GSR.3(玄武岩)作为标准参考物质。分析结果中,分析精度为5%。
全岩微量元素的分析采用混合酸溶法溶样。分析测试采等离子质谱仪(ICP-MSExcell)完成。分析流程如下:首先将样品放入烘箱内在105 ℃下烘烤2 h,除去吸附水。将样品取出后置于干燥器中冷却至室温。准确称量50.00 mg (49.00~51.00 mg)样品放入Teflon有盖溶样弹中,并加入1.5 mL高纯HNO3、1.5 mL高纯HF和0.01 mL高纯HClO4。将盛有样品的溶样弹置于140 ℃的电热板上开盖蒸干,以除去大部分SiO2。蒸干后,再向溶样弹中加入1.5 mL高纯HNO3、1.5 mL高纯HF。随后将溶样弹加盖并装入钢套密封, 放入烘箱中190 ℃恒温120 h。取出溶样弹,蒸干样品,然后加入3 mL高纯HNO3再次蒸干,以去除残余的HF。之后,加入3 mL 1:1高纯HNO3,放入钢套中置于烘箱中150 ℃恒温12 h,以保证完全提取样品。冷却后,将样品倒入100 mL PET瓶中,并加入1 g Rh内标,加水定容至100 g,待上机测试。微量元素和稀土元素(REE)含量大于10×10-6的元素的测试精度为5%,而小于10×10-6的元素精度为10%。个别在样品中含量低的元素,测试误差大于10%。
3.2.3 全岩Sr-Nd-Pb同位素分析方法
Rb-Sr和Sm-Nd同位素分析在中国地质科学院地质研究所同位素实验室进行。首先称取100~150 mg样品放入Teflon有盖溶样弹中,加入1.5 mL高纯HNO3,1.5 mL高纯HF和0.01 mL高纯HClO4,放在140 ℃的电热板上开盖加热蒸干。蒸干后加入1 mL高纯HNO3,2 mL高纯HF,加盖装入钢套中,放入烘箱中190 ℃温度下加热120 h。取出样品后置于140 ℃电热板上蒸干。加入1 mL 6N HCl,再次蒸干并升温至200 ℃直至白烟冒净。加入1 mL 3N HCl,保持80 ℃温度下静置保温过夜,待化学分离。通过同位素稀释法,利用Finnigan MAT-262质谱仪测试Sr同位素组成及Rb、Sr、Sm和Nd的浓度。利用Nu Plasam HR MC-ICP-MS多接收等离子质谱仪(Nu Instruments)进行Nd同位素分析。Nd和Sr分析结果通过分别标准化到146Nd/142Nd = 0.7219和86Sr/88Sr = 0.1194进行质量分馏校正。在分析样品期间,Sr同位素测试标准为NBS987,测试值为0.710247±12 (2σ)。Nd同位素标准为JMC Nd,测试值为0.511127±12(2σ)。Sr和Nd同位素的测试精度分别为±0.000010 (n=18), 和±0.000011 (n=18)。
4. 数据样本描述
以0412英安岩测试数据为例,说明本数据集的组成和结构。
合作北部西秦岭造山带和临夏盆地内岩浆岩的锆石LC-MC-ICP-MS定年数据表中记录了岩浆岩样品的锆石U-Pb年龄。“Pb”、“Th”、“U”为测试点的三个元素的含量,单位μg/g;“Th/U”为两个元素含量比值;“207Pb/206Pb(Ratio)”、“207Pb/206Pb(±%)”、“207Pb/235U(Ratio)”、“207Pb/235U(±%)”、“206Pb/238U(Ratio)”、“206Pb/238U(±%)”分别为各同位素比值及其误差;“207Pb/206Pb Age(Ma)”、“206Pb/238U Age(Ma)”、“Concordance”分别为计算获得的年龄值及误差,确定样品的锆石年龄时,使用“206Pb/238U(Ma)”值。以上数据均由实验室测定或计算提供。
合作北部西秦岭造山带和临夏盆地内岩浆岩的主量元素和微量元素特征表中,各主量元素(单位:wt.%)和微量元素(10-6)的含量由实验室测定;“Total”、“FeO#”、“Mg#”、“A/CNK”、“∑REE”、“Eu/Eu*”、“Ce/Ce*”、“(La/Yb)N”、“(La/Gd)N”、“(Gd/Yb)N”(标准化值据Sun and McDonough, 1989)、“Nb/Ta”、“Zr/Y”、“Zr/Hf”、“Rb/Sr”、“Rb/Cs”计算所得。
合作北部西秦岭造山带和临夏盆地内岩浆岩的Sr和Nd同位素特征表中,“Rb(10-6)”、“Sr(10-6)”、“87Rb/86Sr”、“87Sr/86Sr”、“±2σ”分别为Rb、Sr的含量及同位素比值和误差,由实验室测定提供;“Sm(10-6)”、“Nd(10-6)”、“147Sm/144Nd”、“143Nd/144Nd”、“±2σ”分别为该样品的Sm、Nd含量及同位素比值和误差,由实验室测定提供;“(87Sr/86Sr)i”为计算获得的岩石样品的初始同位素比值,“εNd(i)”计算获得。
5. 数据使用方法
以上数据测试结果均为实验室提供。锆石U-Pb年龄数据可使用Isoplot 3.0程序获得锆石年龄谐和图。主量元素、微量元素和岩石Sr-Nd测试数据可分别进行地球化学投图,从而获得岩石地球化学特征,进而推测所采岩石样品的形成机制及研究区的构造背景。
6. 结论
西秦岭—临夏盆地深地震反射剖面沿线重要岩浆岩岩石地球化学测试数据集中共包含三个数据表,分别为合作北部西秦岭造山带和临夏盆地内岩浆岩的锆石LA-MCICP-MS定年数据(共计7个测试样品、145个测试点)、合作北部西秦岭造山带和临夏盆地内岩浆岩的主量元素和微量元素特征(共计33个测试样品,每个样品有69个测试项)、合作北部西秦岭造山带和临夏盆地内岩浆岩的Sr和Nd同位素特征(共计27个测试样品)。这些数据为研究该区域岩石成因和地质构造背景提供了科学数据参考。
1. Introduction
Western Qinling orogenic belt is located in the northeastern margin of the Tibetan Plateau, and its lithosphere structure and record of change can show information on the deep processes of the northeastward development and evolution of the plateau. The western Qinling orogenic belt is also located in the east-west and south-north tectonic junction of the Chinese continent, and this special tectonic environment makes it the best region for studying the convergence of the north and south terranes/plates of the Chinese continent and their tectonic transition relationship with the Qilian orogenic belt and the north-south tectonic zone. Seismic activities are frequent in this region. Many major aspects such as tectonic evolution, resource exploitation and continental dynamics in many crucial periods of the Chinese continent are closely related to the western Qinling orogenic belt, which therefore is also a prospect area for China’s resource exploitation. Especially with the global oil shortage, China’s petroleum geoscience industry has speeded up exploration in such new areas. The western Qinling orogenic belt and basins on both its sides have been listed as one of the strategic target areas that deserve focus and re−understanding for oil and gas exploration in China.
The Hezuo—Yongjing seismic reflection profle crosses both the western Qinling and southern Qilian orogenic belts. In this profle, with a thrust−strike slip fault in the northern margin of the western Qinling as a boundary, the western Qinling orogenic belt is to the south, and the Linxia basin to the north located in southern Qilian (Fig. 1). In the Linxia basin, there are sporadic k-feldspar granites and mafic dikes outcropping, reflecting the basement material composition of the basin. The basin also records a large number of tectonic and climatic events during the uplift process of the Tibetan Plateau, and stratum outcrops are intact due to the cutting of the water system. Therefore, the Linxia basin is a satisfactory place to reveal the uplift process of the Tibetan Plateau through its sediments (Li et al., 1995; Fang et al., 1997; Zheng et al., 2003).
The two Tibetan Plateau uplift periods recorded in the Linxia basin were about 14 Ma and about 5.4–8.0 Ma, respectively (Zheng et al., 2003). The rapid denudation event that occurred in about 14 Ma may reflect contemporaneous crustal thickening and plateau uplift events, which happened in the northern part of the Tibetan Plateau due to the convective thinning of the lithosphere; the duration of this activity is similar to that of the potassium alkaline volcanic rocks in the area (Yu et al., 1994, 2001). The latter event may have been associated with the eastward and northward expansion of the northeast boundary of the Tibetan Plateau after the uplift of the plateau reached a considerable height, due to the need to maintain its great height and to continue to regulate the convergence of the north and south (Zheng et al., 2003).
The seismic reflection (SR) profle survey line (dotted line in Fig. 1) crossed the western Qinling and the Linxia basin. In order to better interpret the tectonic meaning of the deep geological structure revealed by the SR profile, on the basis of field observation, systematic sampling of important geological bodies along the Hezuo—Yongjing SR profle was carried out, and analysis of zircon U−Pb geochronology, whole rock elements and isotope (Sr and Nd) composition was conducted, in order to determine the formation age and geochemical characteristics of different magmatic rocks.
The brief table of metadata of the geochemical dataset of important magmatic rocks along the deep SR profle of the western Qinling—Linxia basin is shown in Table 1.
Table 1. Metadata table of dataset(s)2. Overview of regional geology
On the northwest side of the Linxia basin, Jishishan Hill has high terrain and outcropping granite and megacryst diorite, with the granite similar to that in the Linxia basin. Linxia basin is located about 100 km to the southwest of Lanzhou city. It is a basin with piedmont depression characteristics surrounded by the Leijishan deep fault in the northeastern margin of the Tibetan Plateau, the deep fault in the northern margin of the western Qinling, and the eastward extension of Maxianshan Hill. It belongs to the southwest corner of the large Tertiary Longzhong basin (Fig. 1), which began to develop around 30 Ma, after which, the Cenozoic strata have been almost continuous and kept intact till now. The thickness of the Tertiary sediments in the depocenter is up to 1600 m.
3. Data acquisition and processing methods
3.1 Sample collection
During the implementation of the project, a detailed field geological survey was conducted along the Gansu Lanzhou—Hezuo line, and representative rock samples were collected (Fig. 2 and Fig. 3), of which 7 pieces are zircon U−Pb geochronology samples, including granite, K−feldspar granite, granodiorite, diorite, quartz andesite, and andesite.
3.2 Sample analytical procedures and accuracy
3.2.1 Zircon LA−MC−ICP−MS analysis method and zircon characteristics
A representative sample was selected, crushed into 60 mesh, and the zircon separated by a series of methods, namely washing, magnetic separation, electromagnetic separation, and manual separation. Under a binocular microscope, clean and transparent single− mineral particles were selected, and placed one by one on double-sided tape, and then a PVC ring pressed on. After mixing epoxy resin and its curing agent evenly, the mixture is poured into the PVC ring, and then placed into an oven, and kept at 60℃ for 48 hours. Taking out the sample target, it was sanded with a piece of sandpaper to the central portion and polished with a piece of polishing cloth. After the target preparation was completed, reflected and transmitted light photomicrography was conducted on the mineral to identify surface cracks and internal inclusions of the sample. Thereafter, cathodoluminescence (CL) image acquisition was conducted for the zircon in the scanning electron microscope laboratory to examine the internal structure and composition zoning of mineral particles, to determine the appropriate position for analysis and testing. Prior to the analysis and testing, the sample target was cleaned ultrasonically with alcohol, to remove possible surface contamination. The sample target was plated with gold on the surface and then was analyzed using the ion probe method. The CL imaging observation was carried out at the Beijing SHRIMP Center, and the backscattered (BSE) imaging and the test of components of inclusions in zircon were conducted using scanning electron microscopy at the Institute of Geology, Chinese Academy of Geological Sciences, Beijing. The distribution and structure of the growth layer in zircon were determined by CL and BSE images, to select analysis points. The zircon U−Pb analyses were conducted in the MC-ICP-MS laboratory of the Institute of Mineral Resources, Chinese Academy of Geological Sciences. The equipment used for the zircon dating analysis is the Finnigan Neptune MC -ICP -MS and its accompanying Newwave UP 213 Laser Ablation system. In laser ablation, the diameter of the beam spot used is 25 μm, the frequency is 10 Hz, the energy density is about 2.5 J/cm2, and the carrier gas is He. Multi-ion-counters were used to receive signals for 207Pb, 206Pb, 204Pb(+204Hg) and 202Hg with weak signals, and the signals of 208Pb, 232Th, and 238U were received using Faraday cups; therefore, all target isotope signals were simultaneously received and all peaks with different mass numbers were substantially planar, to obtain data with high accuracy. The test accuracies (2s) of 207Pb/206Pb, 206Pb/238U and 207Pb/235U of uniform zircon particles are all about 2%, and the standard dating accuracy for zircon is about 1% (2s) accordingly. The single point ablation method was used for LA−MC−ICP− MS laser ablation sampling, and the zircon GJ−1 was used for adjustment of the equipment so that it achieved its optimal state before data analysis. The zircon GJ−1 was taken as an external standard for zircon U−Pb dating, and the zircon M127 (U: 923 ppm; Th: 439 ppm; Th/U: 0.475. Nasdala et al., 2008) was taken as an external standard for calibration for the U, Th contents. During the test, two zircons GJ1 were measured repeatedly for calibration of samples before and after every 5–7 samples were measured. One zircon Plesovice was measured, and the equipment state should be observed to ensure the test accuracy. The ICPMSDataCal program (Liu et al. 2010) was used for data processing. 206Pb/204Pb > 1000 for vast majority of analysis points, and the common Pb correction was not performed during the test. 204Pb was detected by an ion counter. The analysis points with abnormally high content of 204Pb might be affected by the common Pb in inclusions, etc., so the analysis points with abnormally high content of 204Pb were excluded from the calculation. The zircon age concordia diagram was obtained with Isoplot 3.0 program. The U−Pb geochronology analysis was completed for 7 zircon samples.
Sample 0412 is quartz andesite, collected from the western Qinling orogenic belt. The zircons are euhedral and long columnar with clear edges and corners, with grain sizes being between 100–250 mm and with length−width ratios being 2:1 generally and reaching 3:1 occasionally. Both CL and BSE images of the zircons show that the zircons have no evident cores, and are relatively clean and substantially free of inclusion, with distinct rhythmic zonal structure (Fig. 4a). The core zone density is low, but the edge zone density is higher, so the zircons are magmatic zircons.
Sample ZHZ08 is a granodiorite, collected from the western Qinling orogenic belt. The zircons are euhedral and columnar with clear edges and corners, with grain sizes being between 100–250 mm and with length-width ratios being generally 2:1–3:1. Both CL and BSE images of the zircons show that they have no evident cores and are relatively clean, and several of them have inclusions, with weakened rhythmic zoning structure (Fig. 4). The zircons are magmatic zircons, but they might have been affected by late thermal events.
Sample ZHZ09 is an andesite, collected from the western Qinling orogenic belt. The zircons are euhedral–subhedral, and most of them are long cylindrical and several are perfectly round. The grain sizes are between 50–200 mm, and the length-width ratios are generally 2:1–3:1. Both CL and BSE images of the zircons show that they have no nucleus and are relatively clean, and several of them have inclusions, with weakened rhythmic zoning structure (Fig. 4c). Some zircons have edges containing high U and Th and showing rhythmic zoning structure with dark luminescence, which are, however, in the same period with the core zircons. This may have been caused by the changes in the contents of U and Th in the growth of the zircon during the contemporaneous event.
Sample 0419 is a k-feldspar granite, collected from Jishishan Hill. The zircons are euhedral–subhedral, and long columnar, with grain sizes being between 100–200 mm and with length-width ratios being generally 2:1 and occasionally reaching 4:1. Both CL and BSE images of the zircons show that they have a core−mantle−edge structure, including a white fuzzy zoning core, a gray weak zoning mantle and a black weak luminescence edge. Several zircons contain inclusions in their mantles (Fig. 4d).
Sample 0429B is a diorite, collected from Tangwang Town on the north of the Linxia basin. The zircons are subhedral–anhedral, and columnar, perfectly round, with grain sizes being between 50–150 mm, and with length-width ratios being mostly 2:1 and 1:1 rarely. Both CL and BSE images show that the zircons have a core−mantle−edge structure, including a weakly oscillating zoning core, a gray unzoned mantle and a white narrow edge (Fig. 4e).
Sample 0429C is a k-feldspar granite, also collected from Tangwang Town. The zircons are euhedral, and long columnar, with grain sizes being between 100–150 mm and with length-width ratios being generally 2:1. Both CL and BSE images of the zircons show that they have a core−edge structure, including a white core containing inclusions, and an edge with distinct oscillating zone (Fig. 4f).
Sample 0430-2 is a granite, collected from a place about 3 km from the north of Linxia city. The zircons are euhedral and columnar, with grain sizes being between 150–200 mm, and with length–width ratios being 2:1. Both CL and BSE images show that the zircons have a homogeneous distinct oscillating zoning structure (Fig. 3g).
3.2.2 Analysis methods for major elements and trace elements
In order to determine the geochemical characteristics of the sample rocks, the compositions of the whole rock major elements, trace elements and Rb−Sr, Sm−Nd isotopes were analyzed. The testing of the major and trace elements was conducted at the National Geological Experiment and Testing Center of the Ministry of Land and Resources. The whole rock major elements were analyzed using the X−ray fluorescence spectroscopy (XRF) melting glass plate method. The procedure was as follows: frst, put the whole rock powder into an oven to bake at 105℃ for 2 hours so as to remove the adsorbed water from the sample. Remove the sample from the oven and quickly put it into a desiccator to cool. After the sample is cooled to room temperature, accurately weigh 0.5 g (0.5000 ± 0.0007g) of the sample into a crucible dried to a constant weight, and then put the crucible with the sample into a muffle furnace and heat to 1000℃ to burn for 1.5 hours. Take out the burned sample and put it in a desiccator to cool to room temperature, and then weigh it and calculate the loss on ignition of the sample. After that, accurately weigh 5 g of mixture reagent (composed of solvent Li2B4O7, cosolvent LiF, oxidant NH4NO3), mix with the sample, and grind till even. Pour the mixed sample into a platinum crucible, and add 3 drops of lithium bromide (release agent); pour it out after being suffciently melted at 1000℃ in the high frequency melting machine, and cool down to form a glass plate. Finally, the major element analysis of the sample was carried out by using XRF (X−ray fluorescence spectrometer 3080E). In the process of analysis, the rock standard samples GSR.1 (granite), GSR.2 (andesite) and GSR.3 (basalt) provided by the National Standard Material Center were selected as standard reference materials. In the analysis results, the analysis accuracy is 5%.
For analysis of the whole rock trace elements, the mixed acid dissolution method was used for sample dissolving. The analytical test was performed with an inductively coupled plasma mass spectrometer (ICP−MS−Excell). The analysis flow was as follows: first, put the sample into an oven to bake at 105℃ for 2 hours so as to remove the adsorbed water. Take out the sample and place it in a desiccator to cool to room temperature. Weigh accurately 50.00 mg (49.00–51.00mg) of sample and put into a Teflon sample-dissolving vessel with cover, and add 1.5 mL of highly pure HNO3, 1.5 mL of highly pure HF and 0.01 mL of highly pure HClO4. Put the sample-dissolving vessel with cover opened on an electric heating plate at 140℃ to evaporate to dryness, to remove most of the SiO2. After drying, add 1.5 mL of highly pure HNO3 and 1.5 mL of highly pure HF again into sampledissolving vessel. Then cover the sample-dissolving vessel, and load it into the steel jacket to seal; put into the oven at 190℃, and keep the constant temperature for 120 hours. Take out the sample-dissolving vessel, evaporate the sample to dryness, and then add 3 mL of highly pure HNO3. Evaporate to dryness again to remove the residual HF. After that, add 3 mL of highly pure HNO3 (1:1), load into steel jacket, and put into the oven at 150℃ and keep the constant temperature for 12 hours to ensure complete extraction of the sample. After cooling, pour the sample into a 100 mL PET bottle, add 1 g of Rh internal standard, and add water into the bottle to make 100 g, ready for test on the machine. The testing accuracy is 5% for trace elements and rare earth elements (REEs) with content greater than 10×10-6, and 10% for trace elements and REEs with content less than 10×10-6. The test error is greater than 10% for several elements with low content in the sample.
3.2.3 Analysis methods for whole rock Sr−Nd−Pb isotopes
The analysis of Rb−Sr and Sm−Nd isotopes was carried out at the isotope laboratory of the Institute of Geology, Chinese Academy of Geological Sciences. First, weigh 100–150 mg of sample into a Teflon sample-dissolving vessel with cover, add 1.5 mL of highly pure HNO3, 1.5 mL of highly pure HF and 0.01 mL highly pure HClO4, and put the vessel with cover opened on an electric heating plate at 140℃ to evaporate to dryness. After drying, add 1 mL of highly pure HNO3 and 2 mL of highly pure HF, load into steel jacket, and put into the oven at 190℃ and keep the constant temperature for 120 hours. Take out the sample and put on the electric heating plate at 140℃ to evaporate to dryness. Add 1 mL of 6N HCl, evaporate to dryness again, and heat to 200℃ until white smoke is fully released. Add 1 mL of 3N HCl, and keep at 80℃ overnight, waiting for chemical separation. With the isotope dilution method, the composition of Sr isotopes and the concentrations of Rb, Sr, Sm and Nd were measured using Finnigan MAT−262 mass spectrometer. Nd isotope analysis was conducted using Nu Plasam HR MC−ICP−MS Multi-collector plasma mass spectrometer (Nu Instruments). The analysis results of Nd and Sr were normalized to 146Nd/142Nd = 0.7219 and 86Sr/88Sr = 0.1194, respectively, for mass fractionation correction. During the analysis of the samples, the Sr isotope test standard was NBS987 and the test value was 0.710247±12(2σ). The Nd isotope test standard was JMC Nd, and the test value was 0.511127±12(2σ). The test accuracies of Sr and Nd isotopes are 0.000010 (n = 18) and 0.000011 (n = 18), respectively.
4. Description of data samples
With the test data of the quartz andesite sample 0412 as an example, the composition and structure of this dataset are described.
The zircon LC−MC−ICP−MS age data of the magmatic rocks in the western Qinling orogenic belt and the Linxia basin shows the zircon U−Pb ages of the magmatic rock samples “Pb”, “Th” and “U” are the contents of three elements at test points, in µg/g; “Th/U” is the content ratio of these two elements; “207Pb/206Pb(Ratio)”, “207Pb/206Pb(±%)”, “207Pb/235U(Ratio)”, “207Pb/235U(±%)”, “206Pb/238U(Ratio)” and “206Pb/238U(±%)” are corresponding isotope ratios and their errors, respectively; “207Pb/206Pb Age (Ma)”, “206Pb/238U Age (Ma)” and “Concordance” are age values and errors obtained by calculation, respectively, and the value of “206Pb/238U(Ma)” is used for determination of the zircon age of samples. All of the above data are measured or calculated by laboratories.
The characteristics of major elements and trace elements in magmatic rocks collected from the western Qinling orogenic belt and Linxia basin in the northern part of Hezuo show the contents of various major elements (in wt.%) and trace elements (×10-6) measured by laboratories; “Total”, “FeO#”, “Mg#”, “A/CNK”, “∑REE”, “Eu/Eu*”, “Ce/Ce*”, “(La/Yb)N”, “(La/Gd)N”, “(Gd/Yb)N” (normalized values according to Sun and McDonough, 1989), “Nb/Ta”, “Zr/Y”, “Zr/Hf”, “Rb/Sr” and “Rb/Cs” are obtained by calculation.
The characteristics of Sr and Nd isotopes in magmatic rocks collected from the western Qinling orogenic belt and Linxia basin in the northern part of Hezuo shows that “Rb(×10-6)”, “Sr(×10-6)”, “87Rb/86Sr”, “87Sr/86Sr” and “±2σ” are the contents of Rb and Sr, and the isotope ratios and errors, respectively, determined and provided by laboratories; Sm (×10-6)”, “Nd (×10-6)”, “147Sm/144Nd”, “143Nd/144Nd” and “±2σ” are the contents of Sm and Nd, and the isotope ratios and errors, respectively, determined and provided by laboratories; “(87Sr/86Sr)i” is the initial isotope ratio of a rock sample obtained by calculation, and “εNd(i)” is obtained by calculation.
5. Data usage
The above test result data are provided by known laboratories. With zircon U−Pb age data, the zircon age concordia diagram can be obtained using the program Isoplot 3.0. The test data of major elements, trace elements and rock Sr−Nd can be used respectively for geochemical mapping to obtain the geochemical characteristics of rock, and then to infer the formation mechanism of rock samples and the tectonic setting of the research area.
6. Conclusions
The geochemical dataset of important magmatic rocks along the deep seismic reflection profile of the western Qinling—Linxia basin comprises three data sheets, namely, the zircon LA -MC -ICP -MS age data for magmatic rocks in the western Qinling orogenic belt and Linxia basin (a total of 7 test samples, 145 test points), the characteristics of major elements and trace elements of the magmatic rocks in the northern part of Hezuo (a total of 33 test samples, with 69 test items per sample), and the characteristics of Sr and Nd isotopes of the magmatic rocks (a total of 27 test samples). These data from the western Qinling orogenic belt and Linxia basin provide scientific reference for the study of the lithogenesis and geological and tectonic setting in the area.
-
表 1 微波消解两段式程序升温中温度的优化
Table 1. Optimization of temperature in two-step microwave digestion program (50mg sample in 1000W microwave).
第一段温度
(℃)铼测定值
(µg/g)第二段温度
(℃)铼测定值
(µg/g)铼推荐值
(µg/g)110 10.5 140 10.5 10.9±0.7
10.9±0.7
10.9±0.7120 10.4 150 10.8 130 10.8 160 10.6 表 2 逆王水微波消解过程中W、Mo的溶出
Table 2. Dissolution of W and Mo in Lefort aqua regia microwave digestion (130℃ for 8min and 150℃ for 38 min in 1000W microwave).
标准样品编号 钨标准值
(µg/g)钨测定值
(µg/g)钨溶出率
(%)钼标准值
(%)钼测定值
(%)钼溶出率
(%)GBW07285 54.7 52.0 95.1 5.17 5.27 102.0 GBW07373 370 344 93.0 9.09 8.99 98.9 GBW07238 3600 1312 25.0 1.51 1.50 99.3 GBW07369 79600 1652 0.8 0.361 0.360 99.7 表 3 W、Mo单元素及双元素溶液在不同8-HQ添加量下的沉淀率
Table 3. Precipitation rate of W, Mo and W-Mo solution (25µg/mL) under different 8-HQ addition amount.
沉淀剂及
相应浓度沉淀剂用量
(mL)单元素沉淀率
(%)双元素沉淀率
(%)Mo W Mo W 8-HQ
(0.3%,w%)0.20 99.21 28.72 53.19 22.41 0.50 99.66 31.36 99.77 70.72 0.75 99.81 53.37 99.86 90.95 1.00 99.94 79.32 99.86 97.27 1.50 99.96 92.73 99.84 99.16 2.00 99.97 93.08 99.81 99.39 8-HQ
(3%,w%)0.20 99.99 99.54 99.83 99.32 0.50 99.97 99.80 99.85 99.56 0.75 99.99 99.96 99.85 99.57 1.00 99.96 99.96 99.86 99.76 1.50 99.97 99.97 99.77 99.73 2.00 99.99 99.97 99.81 99.79 表 4 8-HQ对实际样品中W、Mo元素的沉淀率
Table 4. Precipitation rate of W, Mo elements in real samples under 8-HQ.
标准物质
编号待测
元素沉淀前元素含量
(µg/mL)沉淀后元素含量
(µg/mL)沉淀率
(%)GBW07238 Mo 3.020 0.0224 99.26 W 0.2625 0.0035 98.67 GBW07373 Mo 18.20 0.0511 99.72 W 0.6880 0.0013 99.81 GBW07369 Mo 0.7251 0.0326 95.50 W 0.3304 0.0054 98.37 表 5 方法的精密度和准确度
Table 5. Accuracy and precision tests of the method.
标准物质
编号铼含量测定值
(μg/g)铼含量标准值
(μg/g)相对误差
(%)RSD
(%)GBW07238 0.37±0.01 (0.35) 6.07 2.6 GBW07285 32.50±0.49 31.20±3.70 4.09 1.5 GBW07373 10.80±0.20 10.90±0.70 0.85 2.0 GBW07369 0.35±0.01 0.35±0.03 0.71 4.6 注:测定值以“平均值±标准偏差”的形式表示(平行实验次数n=8)。 -
[1] 郭娟, 崔荣国, 王卉, 等. 世界铼资源供需现状及展望[J]. 国土资源情报, 2020(10): 67−74.
Guo J, Cui R G, Wang H, et al. Supply and demand situation and outlook of global rhenium resources[J]. Natural Resources Information, 2020(10): 67−74.
[2] 陈喜峰, 陈秀法, 李娜, 等. 全球铼矿资源分布特征与开发利用形势及启示[J]. 中国矿业, 2019, 28(5): 7−12. doi: 10.12075/j.issn.1004-4051.2019.05.031
Chen X F, Chen X F, Li N, et al. Distribution characteristics and development & utilization status of global rhenium resources and enlightenments[J]. China Mining Magazine, 2019, 28(5): 7−12. doi: 10.12075/j.issn.1004-4051.2019.05.031
[3] Karadjov M, Velitchkova N, Veleva O, et al. Spectral interferences in the determination of rhenium in molybdenum and copper concentrates by inductively coupled plasma optical emission spectrometry (ICP-OES)[J]. Spectrochimica Acta Part B:Atomic Spectroscopy, 2016, 119: 76−82. doi: 10.1016/j.sab.2016.03.011
[4] 赵庆令, 李清彩. 电感耦合等离子体发射光谱法测定钼矿石和铜矿石中的铼[J]. 岩矿测试, 2009, 28(6): 593−594. doi: 10.15898/j.cnki.11-2131/td.2009.06.008
Zhao Q L, Li Q C. Determination of rhenium in molybdenum and copper ores by inductively coupled plasma atomic emission specrometry[J]. Rock and Mineral Analysis, 2009, 28(6): 593−594. doi: 10.15898/j.cnki.11-2131/td.2009.06.008
[5] 王景凤. 基体分离-电感耦合等离子体原子发射光谱法测定辉钼精矿中痕量铼[J]. 冶金分析, 2023, 43(1): 62−67. doi: 10.13228/j.boyuan.issn1000-7571.011848
Wang J F. Determination of trace rhenium in molybdenite concentrate by matrix separation-inductively coupled plasma emission spectrometry[J]. Metallurgical Analysis, 2023, 43(1): 62−67. doi: 10.13228/j.boyuan.issn1000-7571.011848
[6] 贾雷, 左修源. 四酸密闭消解-电感耦合等离子体质谱(ICP-MS)法测定铀矿中的铼和钪[J]. 中国无机分析化学, 2023, 13(5): 469−474.
Jia L, Zuo X Y. Determination of rhenium and scandiumin uranium ores by inductively coupled plasma mass spectrometry (ICP-MS) with tetraacid confinement ablation[J]. Chinese Journal of Inorganic Analytical Chemistry, 2023, 13(5): 469−474.
[7] Zhen Y, Chen H, Zhang M, et al. Cadmium and cobalt ions enhanced-photochemical vapor generation for determination of trace rhenium by ICP-MS[J]. Applied Spectroscopy Reviews, 2022, 57(4): 318−337. doi: 10.1080/05704928.2021.1878368
[8] Bettinardi D J, Brown M A, Paulenova A, et al. Separation and determination of ultratrace rhenium quantities in molybdenum matrix[J]. Separation Science and Technology, 2021, 56(16): 2789−2800. doi: 10.1080/01496395.2020.1849304
[9] 李明, 蔡玉曼, 张培新. 电感耦合等离子体质谱(ICP-MS)法测定钨矿石、钼矿石中的铼[J]. 中国无机分析化学, 2019, 9(6): 29−34. doi: 10.3969/j.issn.2095-1035.2019.06.007
Li M, Cai Y M, Zhang P X. Determination of Re in tungsten ore and molybdenum ore by inductively coupled plasma mass spectrometry[J]. Chinese Journal of Inorganic Analytical Chemistry, 2019, 9(6): 29−34. doi: 10.3969/j.issn.2095-1035.2019.06.007
[10] 申玉民, 边朋沙, 李晓敬, 等. 电感耦合等离子体质谱法测定地质样品中痕量铼[J]. 冶金分析, 2018, 38(12): 7−12.
Shen Y M, Bian P S, Li X J, et al. Determination of trace rhenium in geological sample by inductively coupled plasma mass spectrometry[J]. Metallugical Analysis, 2018, 38(12): 7−12.
[11] 王妍力, 罗明标, 柯麟, 等. 氧化镁烧结-电感耦合等离子体质谱法测定砂岩型铀矿中的痕量铼[J]. 岩矿测试, 2016, 35(4): 373−377.
Wang Y L, Luo M B, Ke L, et al. Determination of trace rhenium in sandstone-type uranium deposits by inductively coupled plasma-mass spectrometry with magnesium oxide sintering[J]. Rock and Mineral Analysis, 2016, 35(4): 373−377.
[12] 张艳, 郝辉, 雒虹. 电感耦合等离子体质谱(ICP-MS)法测定矿石中的铼——三种前处理方法比较[J]. 中国无机分析化学, 2016, 6(1): 34−37. doi: 10.3969/j.issn.2095-1035.2016.01.009
Zhang Y, Hao H, Luo H. Comparison of three sample pretreatment methods in determination of rhenium in ores by ICP-MS[J]. Chinese Journal of Inorganic Analytical Chemistry, 2016, 6(1): 34−37. doi: 10.3969/j.issn.2095-1035.2016.01.009
[13] 熊英, 吴峥, 董亚妮, 等. 封闭消解-阳离子交换分离-电感耦合等离子体质谱法测定铜铅锌矿石中的铼[J]. 岩矿测试, 2015, 34(6): 623−628. doi: 10.15898/j.cnki.11-2131/td.2015.06.004
Xiong Y, Wu Z, Dong Y N, et al. Determination of rhenium in copper-lead-zinc ore by inductively coupled plasma-mass spectrometry with closed decomposition and cation exchange separation[J]. Rock and Mineral Analysis, 2015, 34(6): 623−628. doi: 10.15898/j.cnki.11-2131/td.2015.06.004
[14] 任志海, 夏照明, 李树强. 电感耦合等离子体质谱法(ICP-MS)测定钼矿石中的铼[J]. 中国无机分析化学, 2013, 3(3): 27−29.
Ren Z H, Xia Z M, Li S Q. Determination of rhenium in molybdenum ores by inductively coupled plasma mass spectrometry (ICP-MS)[J]. Chinese Journal of Inorganic Analytical Chemistry, 2013, 3(3): 27−29.
[15] 屈文俊, 杜安道. 高温密闭溶样电感耦合等离子体质谱准确测定辉钼矿铼-锇地质年龄[J]. 岩矿测试, 2003, 22(4): 254−257.
Qu W J, Du A D. Highly precise Re-Os dating of molybdenite by ICP-MS with Carius tube sample digestion[J]. Rock and Mineral Analysis, 2003, 22(4): 254−257.
[16] 李丽君, 薛静. 微波消解-电感耦合等离子体质谱法测定高岭土中10种微量元素[J]. 岩矿测试, 2022, 41(1): 22−31.
Li L J, Xue J. Determination of 10 trace elements in kaolin by ICP-MS with microwave digestion[J]. Rock and Mineral Analysis, 2022, 41(1): 22−31.
[17] 王娜, 徐铁民, 魏双, 等. 微波消解-电感耦合等离子体质谱法测定超细粒度岩石和土壤样品中的稀土元素[J]. 岩矿测试, 2020, 39(1): 68−76.
Wang N, Xu T M, Wei S, et al. Determination of rare earth elements in ultra-fine rock and soil samples by ICP-MS using microwave digestion[J]. Rock and Mineral Analysis, 2020, 39(1): 68−76.
[18] 张莉娟, 方蓬达, 王力强, 等. 微波消解-电感耦合等离子体发射光谱法测定砂岩型铀矿中的铀钍[J]. 岩矿测试, 2022, 41(5): 798−805.
Zhang L J, Fang P D, Wang L Q, et al. Determination of uraniumand thorium in sandstone uranium deposits by inductively coupled plasma-optical emission spectrometry with microwave digestion[J]. Rock and Mineral Analysis, 2022, 41(5): 798−805.
[19] 郑智慷, 曾江萍, 王家松, 等. 常压密闭微波消解-电感耦合等离子体发射光谱法测定锑矿石中的锑[J]. 岩矿测试, 2020, 39(2): 208−215.
Zheng Z K, Zeng J P, Wang J S, et al. Determination of antimony in antimony ores by inductively coupled plasma-optical emission spectrometry with microwave digestion[J]. Rock and Mineral Analysis, 2020, 39(2): 208−215.
[20] 黄靖, 王英滨, 周冠轩, 等. 微波消解-电感耦合等离子体发射光谱法测定粉煤灰中的镓[J]. 岩矿测试, 2020, 39(1): 92−98.
Huang J, Wang Y B, Zhou G X, et al. Determination of gallium in coal fly ash by inductively coupled plasma-optical emission spectrometry with microwave digestion[J]. Rock and Mineral Analysis, 2020, 39(1): 92−98.
[21] 邱朝辉, 钟宏, 曹占芳, 等. 铼的分离分析方法研究进展[J]. 稀有金属与硬质合金, 2010, 38(1): 56−59.
Qiu Z H, Zhong H, Cao Z F, et al. The latest development of rhenium separation and analysis methods[J]. Rare Metals and Cemented Carbides, 2010, 38(1): 56−59.
[22] Chen S, Wang X, Niu Y, et al. Simple and cost-effective methods for precise analysis of trace element abundances in geological materials with ICP-MS[J]. Science Bulletin, 2017, 62(4): 277−289. doi: 10.1016/j.scib.2017.01.004
[23] 李晓云, 王羽, 金婵, 等. 微波消解-高分辨电感耦合等离子体质谱法测定土壤中8种金属元素[J]. 岩矿测试, 2022, 41(3): 374−383.
Li X Y, Wang Y, Jin C, et al. Determination of 8 metal elements in soil by high-resolution inductively coupled plasma-mass spectrometry with microwave digestion[J]. Rock and Mineral Analysis, 2022, 41(3): 374−383.
-