

Some Difficulties and Status in the Application of X-Ray Spectrometry in Geological Analysis: A Review
-
摘要:
X射线荧光光谱法(XRF)具有无损、快速、环保和分析精度高等特点,常作为地质样品中主量和微量元素分析的首选方法。然而,由于地质样品的矿物组成、物理结构特征(如尺寸、形状和分层等)和化学成分(如元素组成、化学形态等)的复杂性与多样性,XRF在地质样品分析的实际应用中存在一些技术难点。本文从小样品量和珍贵样品的分析、XRF的散射效应的应用、易挥发元素分析、变价元素分析和稀有金属分析等方面,对XRF在地质分析中的难点进行了总结与评述。指出制备易于保存和便于反复测量的小尺寸样片是小样品量和珍贵样品XRF分析的合适方法;XRF散射效应可用于成分未知的样品中更多化学成分信息的获取以及异质性样品原位分析误差的校正;超细粉末制样、稳定剂的加入和标准加入法建立工作曲线是解决易挥发元素XRF分析困难的方法。认为元素的特征X射线相对强度可用于变价元素价态和形态的分析;优化校准曲线、降低熔融制样的稀释比、高压激发和改善谱线重叠干扰是解决稀有金属分析困难的有效途径。
Abstract:X-ray fluorescence spectrometry (XRF) has become one of the widely used methods for main and trace elements analysis in geological samples, due to its characteristics of non-destructive, fast, environmentally-friendly and high analytical precision. Currently, XRF can qualitatively and quantitatively analyze most of the major and trace elements (4Be−92U, especially 10Na−92U) with the concentration ranges from μg/g to percent. However, there are still some difficulties in practical analysis of geological samples with XRF due to the complexity and diversity of mineral composition, physical structural characteristics (e.g. size, shape, delamination and inclusions) and chemical composition (e.g. elemental composition, chemical morphology) of geological samples. This paper elaborates difficulties and corresponding possible solutions of XRF analysis in geological samples from five aspects including small size samples or precious samples analysis, the application of scattering effect, the analysis of volatile elements, variable valence elements and rare metals. Finally, the limitations and challenges of the XRF technique that still exist in the geological analysis are presented. The BRIEF REPORT is available for this paper at
http://www.ykcs.ac.cn/en/article/doi/10.15898/j.ykcs.202403150052 . -

-

图 1 (a)制备微玻璃珠试样时,将混合粉末放置在Pt-Au坩埚中的工艺原理图;(b)用硅胶聚合物黏合剂将微玻璃珠(直径约3.5mm)安装在直径35mm的空白玻璃片上;(c)附着在35mm空白玻璃片上的微玻璃珠的两个表面:(1)平面;(2)半球面。修改自文献[16]
Figure 1.
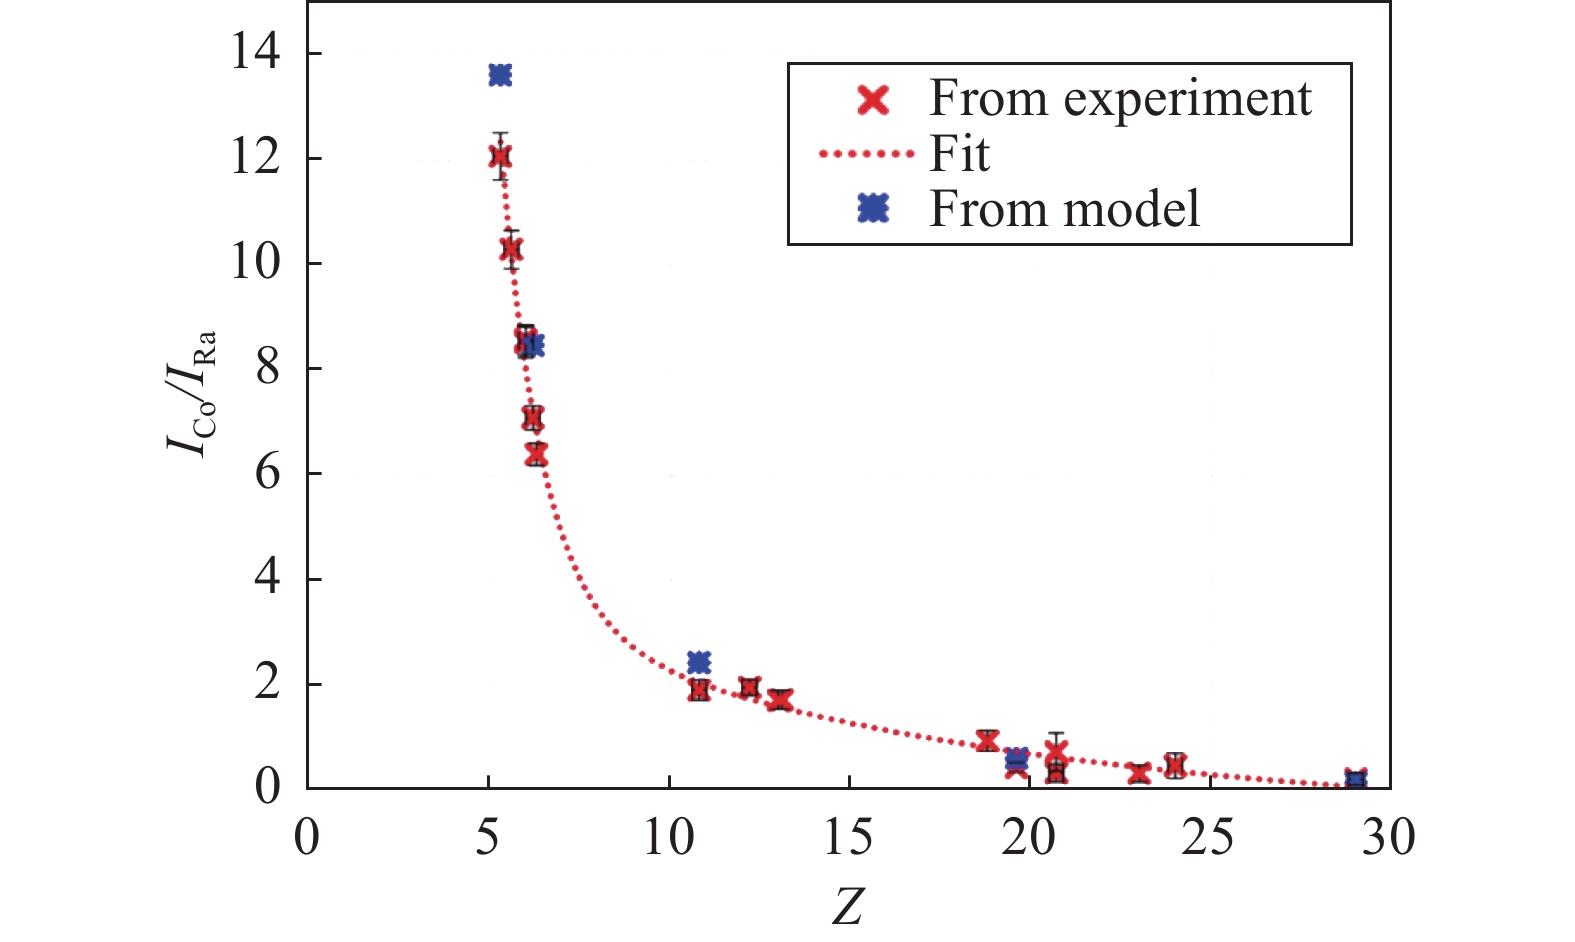
图 2 在45kV,用多毛细管X射线光学仪器在散射角为155.5°的几何结构下,用Rh靶X射线管激发获得的康普顿散射与瑞利散射强度比(ICo/IRa)与平均原子序数(Z)的校准曲线。修改自文献[19]
Figure 2.

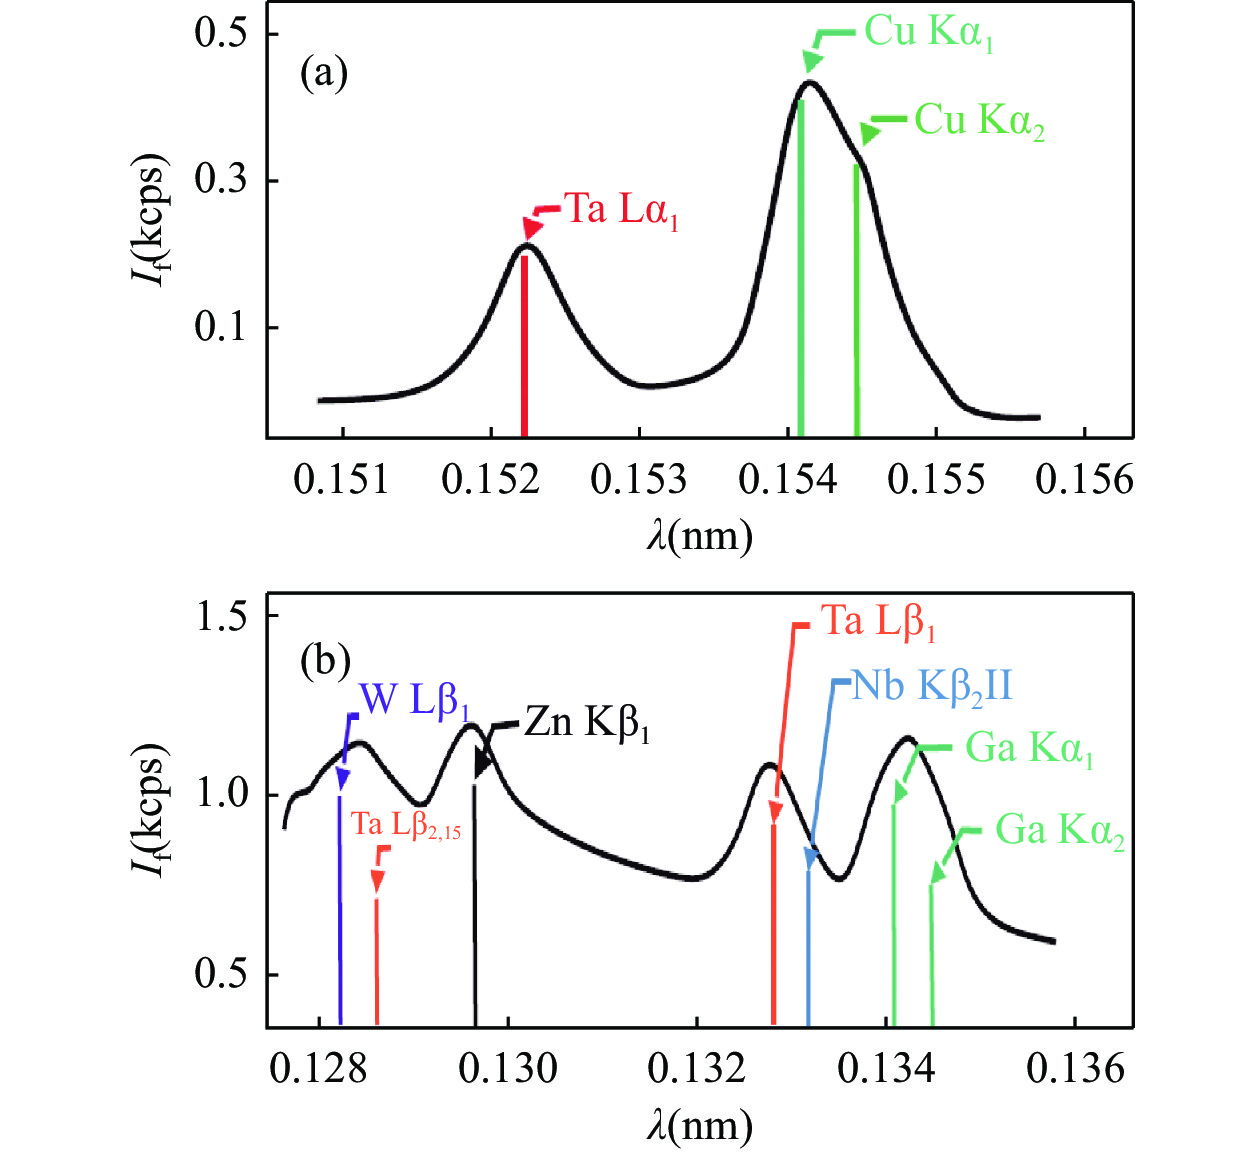
图 3 在相同的实验条件下测量了两种托帕石晶体的XRF光谱(a)。为了更好地呈现散射线的细节,将17keV到23keV的区域(b)放大显示,对应托帕石2的谱线平移到更高能量0.3keV处。修改自文献[19]
Figure 3.
-
[1] Jalali M, Jalali M. Geochemistry and background concentration of major ions in spring waters in a high-mountain area of the Hamedan (Iran)[J]. Journal of Geochemical Exploration, 2016, 165: 49−61. doi: 10.1016/j.gexplo.2016.02.002
[2] Shaltout A A, Castilho I NB, Welz B, et al. Method development and optimization for the determination of selenium in bean and soil samples using hydride generation electrothermal atomic absorption spectrometry[J]. Talanta, 2011, 85(3): 1350−1356. doi: 10.1016/j.talanta.2011.06.015
[3] 陶春军, 李明辉, 马明海, 等. 皖南某典型富硒区土壤-水稻重金属生态风险评估[J]. 华东地质, 2023, 44(2): 160−171. doi: 10.16788/j.hddz.32-1865/P.2023.02.005
Tao C J, Li M H, Ma M H, et al. Ecological risk assessment of heavy metals in soil-rice in a typical selenium-rich area of southern Anhui Province[J]. East China Geology, 2023, 44(2): 160−171. doi: 10.16788/j.hddz.32-1865/P.2023.02.005
[4] 唐志敏, 张晓东, 张明, 等. 新安江流域土壤元素地球化学特征: 来自岩石建造类型的约束[J]. 华东地质, 2023, 44(2): 172−185. doi: 10.16788/j.hddz.32-1865/P.2023.02.006
Tang Z M, Zhang X D, Zhang M, et al. Geochemical characteristics of soil elements in Xin’an River Basin: Constraints from rock formation types[J]. East China Geology, 2023, 44(2): 172−185. doi: 10.16788/j.hddz.32-1865/P.2023.02.006
[5] Oliveira E. Sample preparation for atomic spectroscopy: evolution and future trends[J]. Journal of the Brazilian Chemical Society, 2003, 14(2): 174−182. doi: 10.1590/S0103-50532003000200004
[6] 姚泽, 王干珍, 何功秀, 等. X射线荧光光谱法测定锡矿石中锡[J]. 中国无机分析化学, 2022, 12(6): 48−53. doi: 10.3969/j.issn.2095-1035.2022.06.008
Yao Z, Wang G Z, He G X, et al. Determination of tin in tin ore by X-ray fluorescence spectrometry[J]. Chinese Journal of Inorganic Analytical Chemistry, 2022, 12(6): 48−53. doi: 10.3969/j.issn.2095-1035.2022.06.008
[7] 李迎春, 张磊, 尚文郁. 粉末压片-X射线荧光光谱法分析富硒土壤样品中的硒及主次量元素[J]. 岩矿测试, 2022, 41(1): 145−152. doi: 10.15898/j.cnki.11-2131/td.202007090102
Li Y C, Zhang L, Shang W Y. Determination of selenium, major and minor elements in selenium-rich soil samples by X-ray fluorescence spectrometry with powder pellet preparation[J]. Rock and Mineral Analysis, 2022, 41(1): 145−152. doi: 10.15898/j.cnki.11-2131/td.202007090102
[8] 闵红, 刘倩, 张金阳, 等. X射线荧光光谱-X射线粉晶衍射-偏光显微镜分析12种产地铜精矿矿物学特征[J]. 岩矿测试, 2021, 40(1): 74−84. doi: 10.15898/j.cnki.11-2131/td.202004020038
Min H, Liu Q, Zhang J Y, et al. Study on the mineralogical characteristics of 12 copper concentrates by X-ray fluorescence spectrometry, X-ray powder diffraction and polarization microscope[J]. Rock and Mineral Analysis, 2021, 40(1): 74−84. doi: 10.15898/j.cnki.11-2131/td.202004020038
[9] 张敏, 甘黎明, 冯博鑫, 等. 熔融制样-X射线荧光光谱法测定铁矿石中铁、硅、铝[J/OL]. 中国无机分析化学(2024-07-06)[2024-03-15]. http://kns.cnki.net/kcms/detail/11.6005.O6.20240701.1017.002.html.
Zhang M, Gan L M, Feng B X, et al. Determination of iron, silicon and aluminum in iron ore by X-ray fluorescence spectrometry with fusion sample preparation[J]. Chinese Journal of Inorganic Analytical Chemistry (2024-07-06)[2024-03-15]. http://kns.cnki.net/kcms/detail/11.6005.O6.20240701.1017.002.html.
[10] 蒋奡松, 吴龙华, 李柱. 能量色散X射线荧光光谱技术在土壤重金属分析中的应用研究现状[J]. 岩矿测试, 2024, 43(4): 659−675.
Jiang A S, Wu L H, Li Z. Application of energy-dispersive X-ray fluorescence spectroscopy in analysis of heavy metals in soil[J]. Rock and Mineral Analysis, 2024, 43(4): 659−675.
[11] 陈春霏, 卢秋, 姚苏芝, 等. 粉末压片-X射线荧光光谱法测定富硅土壤和沉积物样品中的5种重金属元素[J]. 中国无机分析化学, 2024, 14(5): 513−520. doi: 10.3969/j.issn.2095-1035.2024.05.001
Chen C F, Lu Q, Yao S Z, et al. Determination of 5 heavy metal elements in silicon-rich soil sand sediments by X-ray fluorescence spectrometry with pressed powder pellet[J]. Chinese Journal of Inorganic Analytical Chemistry, 2024, 14(5): 513−520. doi: 10.3969/j.issn.2095-1035.2024.05.001
[12] Li W J, Wang C L, Gao B Y, et al. Determination of multi-element concentrations at ultra-low levels in alternating magnetite and pyrite by HR-ICP-MS using matrix removal and preconcentration[J]. Microchemical Journal, 2016, 127: 237−246. doi: 10.1016/j.microc.2016.03.018
[13] Zhang W X, Shi Z T, Chen G J, et al. Geochemical characteristics and environmental significance of Talede loess-paleosol sequences of Ili Basin in central Asia[J]. Environmental Earth Sciences, 2013, 70(5): 2191−2202. doi: 10.1007/s12665-013-2323-1
[14] Kelka U, Veveakis M, Koehn D, et al. Zebra rocks: compaction waves create ore deposits[J]. Scientific Reports, 2017, 7(1): 1−9. doi: 10.1038/s41598-017-14541-3
[15] Nakayama K, Nakamura T. Undersized (12.5mm diameter) glass beads with minimal amount (11mg) of geochemical and archeological silicic samples for X-ray fluorescence determination of major oxides[J]. X-Ray Spectrometry, 2012, 41(4): 225−234. doi: 10.1002/xrs.2382
[16] Ichikawa S, Nakamura T. X-ray fluorescence analysis with micro glass beads using milligram-scale siliceous samples for archeology and geochemistry[J]. Spectrochimica Acta Part B: Atomic Spectroscopy, 2014, 96: 40−50. doi: 10.1016/j.sab.2014.04.002
[17] Gazulla M F, Vicente S, Orduna M, et al. Chemical analysis of very small-sized samples by wavelength-dispersive X-ray fluorescence[J]. X-Ray Spectrometry, 2012, 41(3): 176−185. doi: 10.1002/xrs.2381
[18] Shakhreet B Z, Bauk S, Shukri A. Electron density ofRhizophora spp. wood using Compton scattering technique at 15.77, 17.48 and 22.16keV XRF energies[J]. Radiation Physics and Chemistry, 2015, 107: 199−206. doi: 10.1016/j.radphyschem.2014.11.002
[19] Hodoroaba V, Rackwitz V. Gaining improved chemical composition by exploitation of Compton-to-Rayleigh intensity ratio in XRF analysis[J]. Analytical Chemistry, 2014, 86(14): 6858−6864. doi: 10.1021/ac5000619
[20] Shen Y T, Luo L Q, Song Y F, et al. Matrix correction with Compton to Rayleigh ratio in a plant-soil-rock interface analysis using a laboratory micro-XRF[J]. X-Ray Spectrometry, 2019, 48(5): 536−542. doi: 10.1002/xrs.3080
[21] 马景治, 肖伟, 向兆, 等. 超细粉末压片-X射线荧光光谱法测定土壤和沉积物中21种主微量元素[J]. 分析试验室, 2025, 44(1): 29−35. doi: 10.13595/j.cnki.issn1000-0720.2023102505.
Ma J Z, Xiao W, Xiang Z, et al. Determination of major and trace elements in soil and sediment by X-ray fluorescence spectrometry with ultra-fine powder pressing[J]. Chinese Journal of Analysis Laboratory, 2025, 44(1): 29−35. doi: 10.13595/j.cnki.issn1000-0720.2023102505.
[22] 彭桦, 罗昆义, 张树洪, 等. 超细样品压片 X射线荧光光谱分析沙特阿拉伯磷矿中多元素含量[J]. 磷肥与复肥, 2018, 33(7): 39−42. doi: 10.3969/j.issn.1007-6220.2018.07.014
Peng H, Luo K Y, Zhang S H, et al. Analysis of multi-elements in phosphorus rock of Saudi Arabia by XRF ultra-fine sample squash method[J]. Phosphate & Compound Fertilizer, 2018, 33(7): 39−42. doi: 10.3969/j.issn.1007-6220.2018.07.014
[23] 曾江萍, 李小莉, 张莉娟, 等. 超细粉末压片 X射线荧光光谱法分析铬铁矿中的多种元素[J]. 矿物学报, 2015, 35(4): 545−549. doi: 10.16461/j.cnki.1000-4734.2015.04.020
Zeng J P, Li X L, Zhang L J, et al. Determination of multi-elements in chromite by X-ray fluorescence spectrometry with ultra-fine powder tabletting[J]. Acta Mineralogica Sinica, 2015, 35(4): 545−549. doi: 10.16461/j.cnki.1000-4734.2015.04.020
[24] 曾江萍, 张莉娟, 李小莉, 等. 超细粉末压片-X射线荧光光谱法测定磷矿石中 12 种组分[J]. 冶金分析, 2015, 35(7): 37−43. doi: 10.13228/j.boyuan.issn1000-7571.009526
Zeng J P, Zhang L J, Li X L, et al. Determination of twelve components in phosphate ore by X-ray fluorescence spectrometry with ultra-fine powder tabletting[J]. Metallurgical Analysis, 2015, 35(7): 37−43. doi: 10.13228/j.boyuan.issn1000-7571.009526
[25] 李小莉, 安树清, 徐铁民, 等. 超细粉末压片制样 X 射线荧光光谱测定碳酸岩样品中多种元素及 CO2[J]. 光谱学与光谱分析, 2015, 35(6): 1741−1745. doi: 10.3964/j.issn.1000-0593(2015)06-1741-05
Li X L, An S Q, Xu T M, et al. Ultra-fine pressed powder pellet sample preparation XRF determination of multi-elements and carbon dioxide in carbonate[J]. Spectroscopy and Spectral Analysis, 2015, 35(6): 1741−1745. doi: 10.3964/j.issn.1000-0593(2015)06-1741-05
[26] Gazulla M F, Gomez M P, Orduna M, et al. New methodology for sulfur analysis in geological samples by WD-XRF spectrometry[J]. X-Ray Spectrometry: An International Journal, 2009, 38(1): 3−8. doi: 10.1002/xrs.1092
[27] Li X L, Wang Y M, Zhang Q. Determination of halogen levels in marine geological samples[J]. Spectroscopy Letters, 2016, 49(3): 151−154. doi: 10.1080/00387010.2015.1109522
[28] Tiwari M, Sahu S K, Bhangare R C, et al. Depth profile of major and trace elements in estuarine core sediment using the EDXRF technique[J]. Applied Radiation and Isotopes, 2013, 80: 78−83. doi: 10.1016/j.apradiso.2013.06.002
[29] Obhođaš J, Valković V, Matjačić L, et al. Evaluation of elemental composition of sediments from the Adriatic Sea by using EDXRF technique[J]. Applied Radiation and Isotopes, 2012, 70(7): 1392−1395. doi: 10.1016/j.apradiso.2012.03.010
[30] Abderrahim H, Candela L, Queralt I, et al. X-ray fluorescence analysis for total bromine tracking in the vadose zone: Results for Mnsara, Morocco[J]. Vadose Zone Journal, 2011, 10(4): 1331−1335. doi: 10.2136/vzj2010.0150
[31] Pashkova G V, Aisueva T S, Finkelshtein A L, et al. Analytical approaches for determination of bromine in sediment core samples by X-ray fluorescence spectrometry[J]. Talanta, 2016, 160: 375−380.
[32] Chubarov V M, Finkelshtein A L. Determination of divalent iron content in igneous rocks of ultrabasic, basic and intermediate compositions by a wavelength-dispersive X-ray fluorescence spectrometric method[J]. Spectrochimica Acta Part B: Atomic Spectroscopy, 2015, 107: 110. doi: 10.1016/j.sab.2015.03.007
[33] Chubarov V M, Suvorova D, Mukhetdinova A, et al. X-ray fluorescence determination of the manganese valence state and speciation in manganese ores[J]. X-Ray Spectrometry, 2015, 44(6): 436. doi: 10.1002/xrs.2619
[34] Medeiros C A D, Trebat N M. Transforming natural resources into industrial advantage: The case of China’s rare earths industry[J]. Brazilian Journal of Poultry Science, 2017, 37(3): 504−526. doi: 10.1590/0101-31572017v37n03a03
[35] Jyothi R K, Thenepalli T, Ahn J W, et al. Review of rare earth elements recovery from secondary resources for clean energy technologies: Grand opportunities to create wealth from waste[J]. Journal of Cleaner Production, 2020: 122048.
[36] 钟坚海. 熔融制样-X射线荧光光谱法测定铝矿中 15 种组分[J]. 冶金分析, 2018, 38(11): 24−29. doi: 10.13228/j.boyuan.issn1000-7571.010399
Zhong J H. Determination of fifteen components in aluminum ore by X-ray fluorescence spectrometry with fusion sample preparation[J]. Metallurgical Analysis, 2018, 38(11): 24−29. doi: 10.13228/j.boyuan.issn1000-7571.010399
[37] 周伟, 曾梦, 王健, 等. 熔融制样-X射线荧光光谱法测定稀土矿石中的主量元素和稀土元素[J]. 岩矿测试, 2018, 37(3): 298−305. doi: 10.15898/j.cnki.11-2131/td.201706280113
Zhou W, Zeng M, Wang J, et al. Determination of major and rare earth elements in rare earth ores by X-ray fluorescence spectrometry with fusion sample preparation[J]. Rock and Mineral Analysis, 2018, 37(3): 298−305. doi: 10.15898/j.cnki.11-2131/td.201706280113
[38] Silva C D, Santana G P, Paz S P A. Determination of La, Ce, Nd, Sm, and Gd in mineral waste from cassiterite beneficiation by wavelength-dispersive X-ray fluore-scence spectrometry[J]. Talanta, 2020, 206: 120254. doi: 10.1016/j.talanta.2019.120254
[39] Price J R, Heitmann N, Hull J, et al. Long-term average mineral weathering rates from watershed geochemical mass balance methods: Using mineral modal abundances to solve more equations in more unknowns[J]. Chemical Geology, 2008, 254(1−2): 36−51. doi: 10.1016/j.chemgeo.2008.05.012
[40] Nakayama K, Shibata Y, Nakamura T. Glass beads/X-ray fluorescence analyses of 42 components in felsic rocks[J]. X-Ray Spectrometry: An International Journal, 2007, 36(2): 130−140. doi: 10.1002/xrs.936
[41] Ichikawa S, Onuma H, Nakamura T. Development of undersized (12.5mm diameter) low-dilution glass beads for X-ray fluorescence determination of 34 components in 200mg of igneous rock for applications with geochemical and archeological silicic samples[J]. X-Ray Spectrometry, 2016, 45(1): 34−47. doi: 10.1002/xrs.2652
[42] Suvorova D, Khudonogova E, Revenko A. X-ray fluorescence determination of Cs, Ba, La, Ce, Nd, and Ta concentrations in rocks of various composition[J]. X-Ray Spectrometry, 2017, 46(3): 200−208. doi: 10.1002/xrs.2747
[43] Orescanin V, Mikelic L, Roje V, et al. Determination of lanthanides by source excited energy dispersive X-ray fluorescence (EDXRF) method after preconcentration with ammonium pyrrolidine dithiocarbamate (APDC)[J]. Analytica Chimica Acta, 2006, 570(2): 277−282. doi: 10.1016/j.aca.2006.04.028
[44] 袁静, 沈加林, 刘建坤, 等. 高能偏振能量色散X射线荧光光谱仪测定地质样品中稀土元素[J]. 光谱学与光谱分析, 2018, 38(2): 582−589. doi: 10.3964/j.issn.1000-0593(2018)02-0582-08
Yuan J, Shen J L, Liu J K, et al. Determination of rare earth elements in geological samples by high-energy polarized energy-dispersive X-ray fluorescence spectrometry[J]. Spectroscopy and Spectral Analysis, 2018, 38(2): 582−589. doi: 10.3964/j.issn.1000-0593(2018)02-0582-08
[45] Maritz H, Cloete H, Elsenbroek J H. Analysis of high density regional geochemical soil samples at the council for geoscience (South Africa): The importance of quality control measures[J]. Geostandards and Geoanalytical Research, 2010, 34(3): 265−273. doi: 10.1111/j.1751-908X.2010.00078.x
-
 下载:
下载:
图(5)
计量
- 文章访问数: 227
- PDF下载数: 3
- 施引文献: 0