

Effects of Sunda Shelf exposure and vegetation changes on land-atmosphere carbon exchange during the Last Glacial Maximum
-
摘要:
末次盛冰期巽他陆架陆地暴露面积比现代增加将近一倍,该时期东南亚的碳汇能力是否比现代更强?本文利用GOSAT现代卫星数据集、实测碳密度数据集,对现代森林和草原生态系统碳通量(陆表碳通量)进行分析,发现二者的固碳能力相差较大,与地球系统模式的结果一致。本文基于末次盛冰期巽他陆架上植被分布类型的争议,为量化末次盛冰期巽他陆架暴露对大气二氧化碳浓度变化(陆表碳通量)的影响,利用美国国家大气研究中心(NCAR)的通用陆地模型(CLM4),以巽他陆架的植被、陆地面积为敏感条件进行了两组试验,考察末次盛冰期巽他陆架植被变化对陆表碳通量的影响。通过敏感试验结果分析,结合已有的孢粉化石证据,认为当末次盛冰期巽他陆架暴露且被热带雨林覆盖时,仅通过陆表碳交换就会使得东南亚的碳汇能力增强约0.16 PgC/a,在全球大气二氧化碳浓度的冰期-间冰期旋回中扮演着重要角色, 表明植被重建的可靠性对模拟末次盛冰期巽他陆架的陆地碳循环过程及其对气候的反馈非常重要。模拟结果还表明,末次盛冰期暴露的巽他陆架应具有较强的储碳能力,与冰期陆地的碳源角色相反,值得进一步研究。
Abstract:The land exposure area of the Sunda Shelf in the southern South China Sea during the last glacial maximum (LGM) was nearly twice that in modern times. Was the Sunda Shelf a stronger carbon sink at that time? Though the study of the LGM carbon cycle depends on reliable vegetation reconstruction, both GOSAT satellite data and measured carbon density data utilized show that the role of different ecosystems in the carbon cycle could be very different. Whether there were tropical forests or savanna grassland on the Sunda Shelf during the LGM is a controversy. The land-atmosphere carbon exchange of the forest ecosystem is much greater than that of the grassland ecosystem. We used the Community Land Model (CLM4) to carry out two groups of sensitivity cases, aiming at quantifying the impacts of land area increase and vegetation distribution on land-atmosphere carbon exchange. Combining the pollen fossil evidence, our results showed that the exposed Sunda Shelf covered by the forest ecosystem in the LGM absorbed more carbon from the atmosphere at a rate of 0.16 PgC/a than in modern times. It indicated that the Sunda Shelf in LGM was a carbon sink, which was opposite to the role of other terrestrial carbon sources and was worthy of further study.
-
Key words:
- vegetation change /
- land-atmosphere carbon exchange /
- carbon sink /
- Last Glacial Maximum /
- Sunda Shelf
-

-
表 1 敏感试验设计方案
Table 1. Experimental design
试验简称 海陆分布 植被覆盖 1850_tree 现代的海陆分布 东南亚全区为热带常绿阔叶林 1850_grass 现代的海陆分布 东南亚全区为C4草本植物 lgm_tree 东南亚全区海平面下降120 m 东南亚全区为热带常绿阔叶林 lgm_grass 东南亚全区海平面下降120 m 东南亚全区为C4草本植物 注:东南亚所指的具体范围是东经95°至130°、南纬10°至北纬20°。  下载: 导出CSV
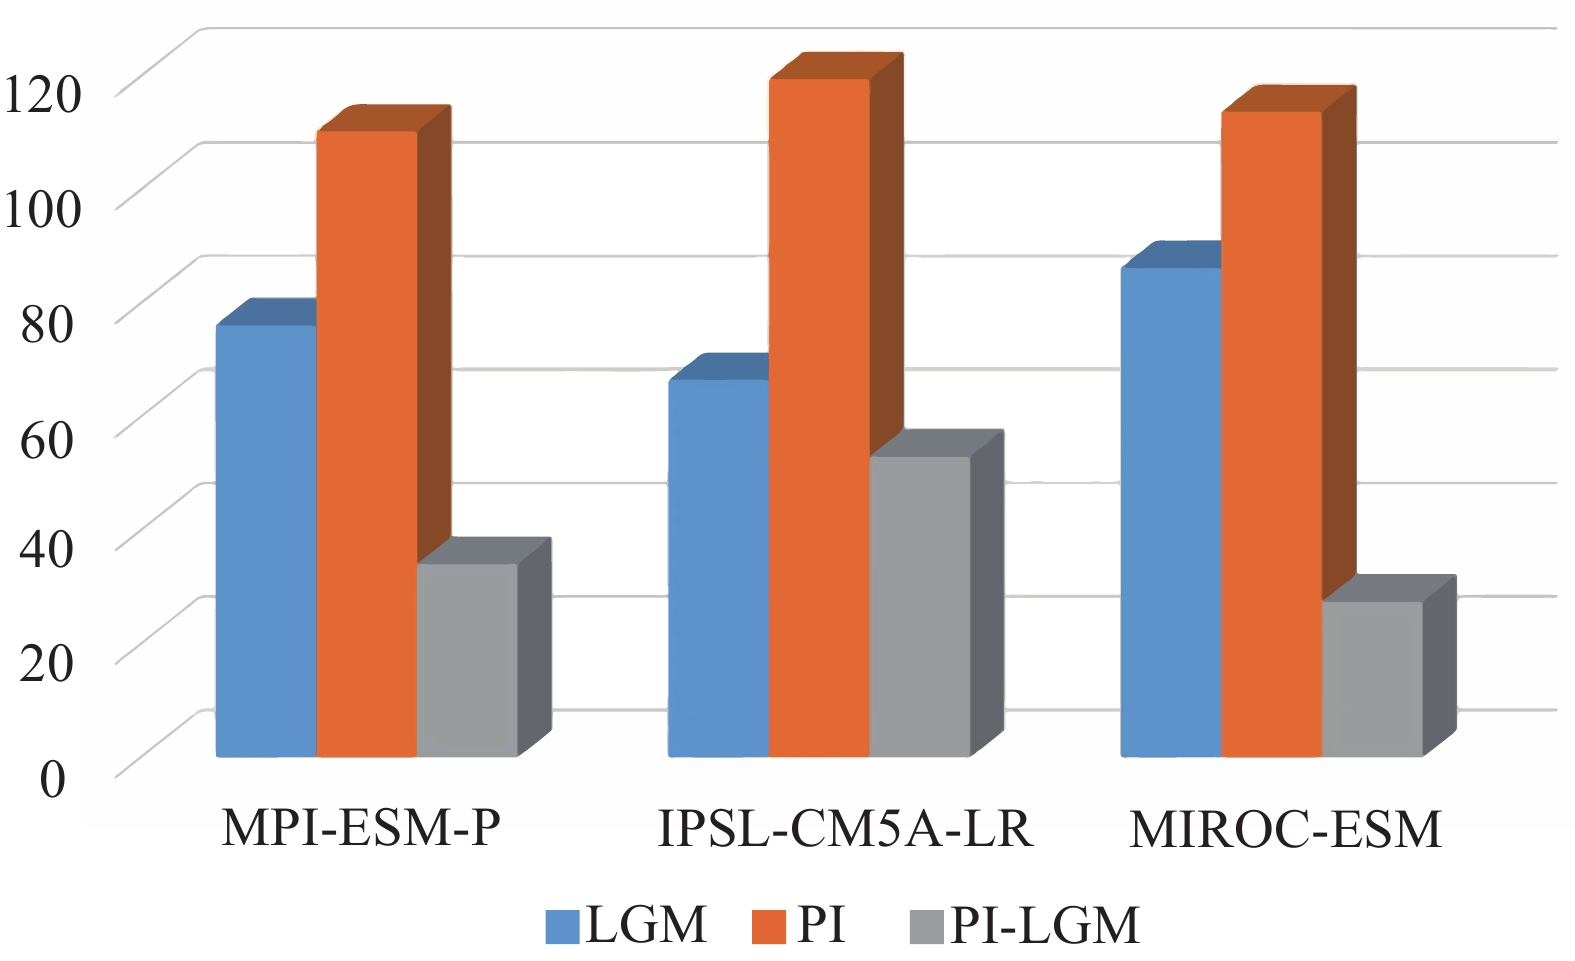
表 2 东南亚陆地GPP总和及其占全球的比例
Table 2. Terrestrial GPP in Southeast Asia and its proportion in the world
PgC/a LGM PI LGM-PI MPI-ESM-P 7.17(9.40%) 6.72(6.09%) 0.45(3.31%) IPSL-CM5A-LR 9.63(14.48%) 0.17(0.14%) 9.46(14.34%) MIROC-ESM 13.52(15.67%) 10.57(9.29%) 2.95(6.38%)
下载: 导出CSV
表 3 东南亚森林面积总和 及其占全球的比例
Table 3. Total forest area in Southeast Asia and its proportion in the world
1014 m2 LGM PI LGM-PI MPI-ESM-P 4.67(13.40%) 2.66(7.31%) 2.01(6.09%) IPSL-CM5A-LR 4.93(9.81%) 2.35(4.52%) 2.58(5.29%) MIROC-ESM 6.24(7.12%) 3.86(5.37%) 2.37(1.75%)
下载: 导出CSV
表 4 东南亚草地面积总和及其占全球的比例
Table 4. Total grassland area in Southeast Asia and its proportion in the world
1013 m2 LGM PI LGM-PI MPI-ESM-P 1.81(0.84%) 0.94(0.42%) 0.87(0.42%) IPSL-CM5A-LR 8.00(1.78%) 3.05(0.66%) 4.95(1.12%) MIROC-ESM 2.22(0.93%) 1.04(0.37%) 1.18(0.55%)
下载: 导出CSV
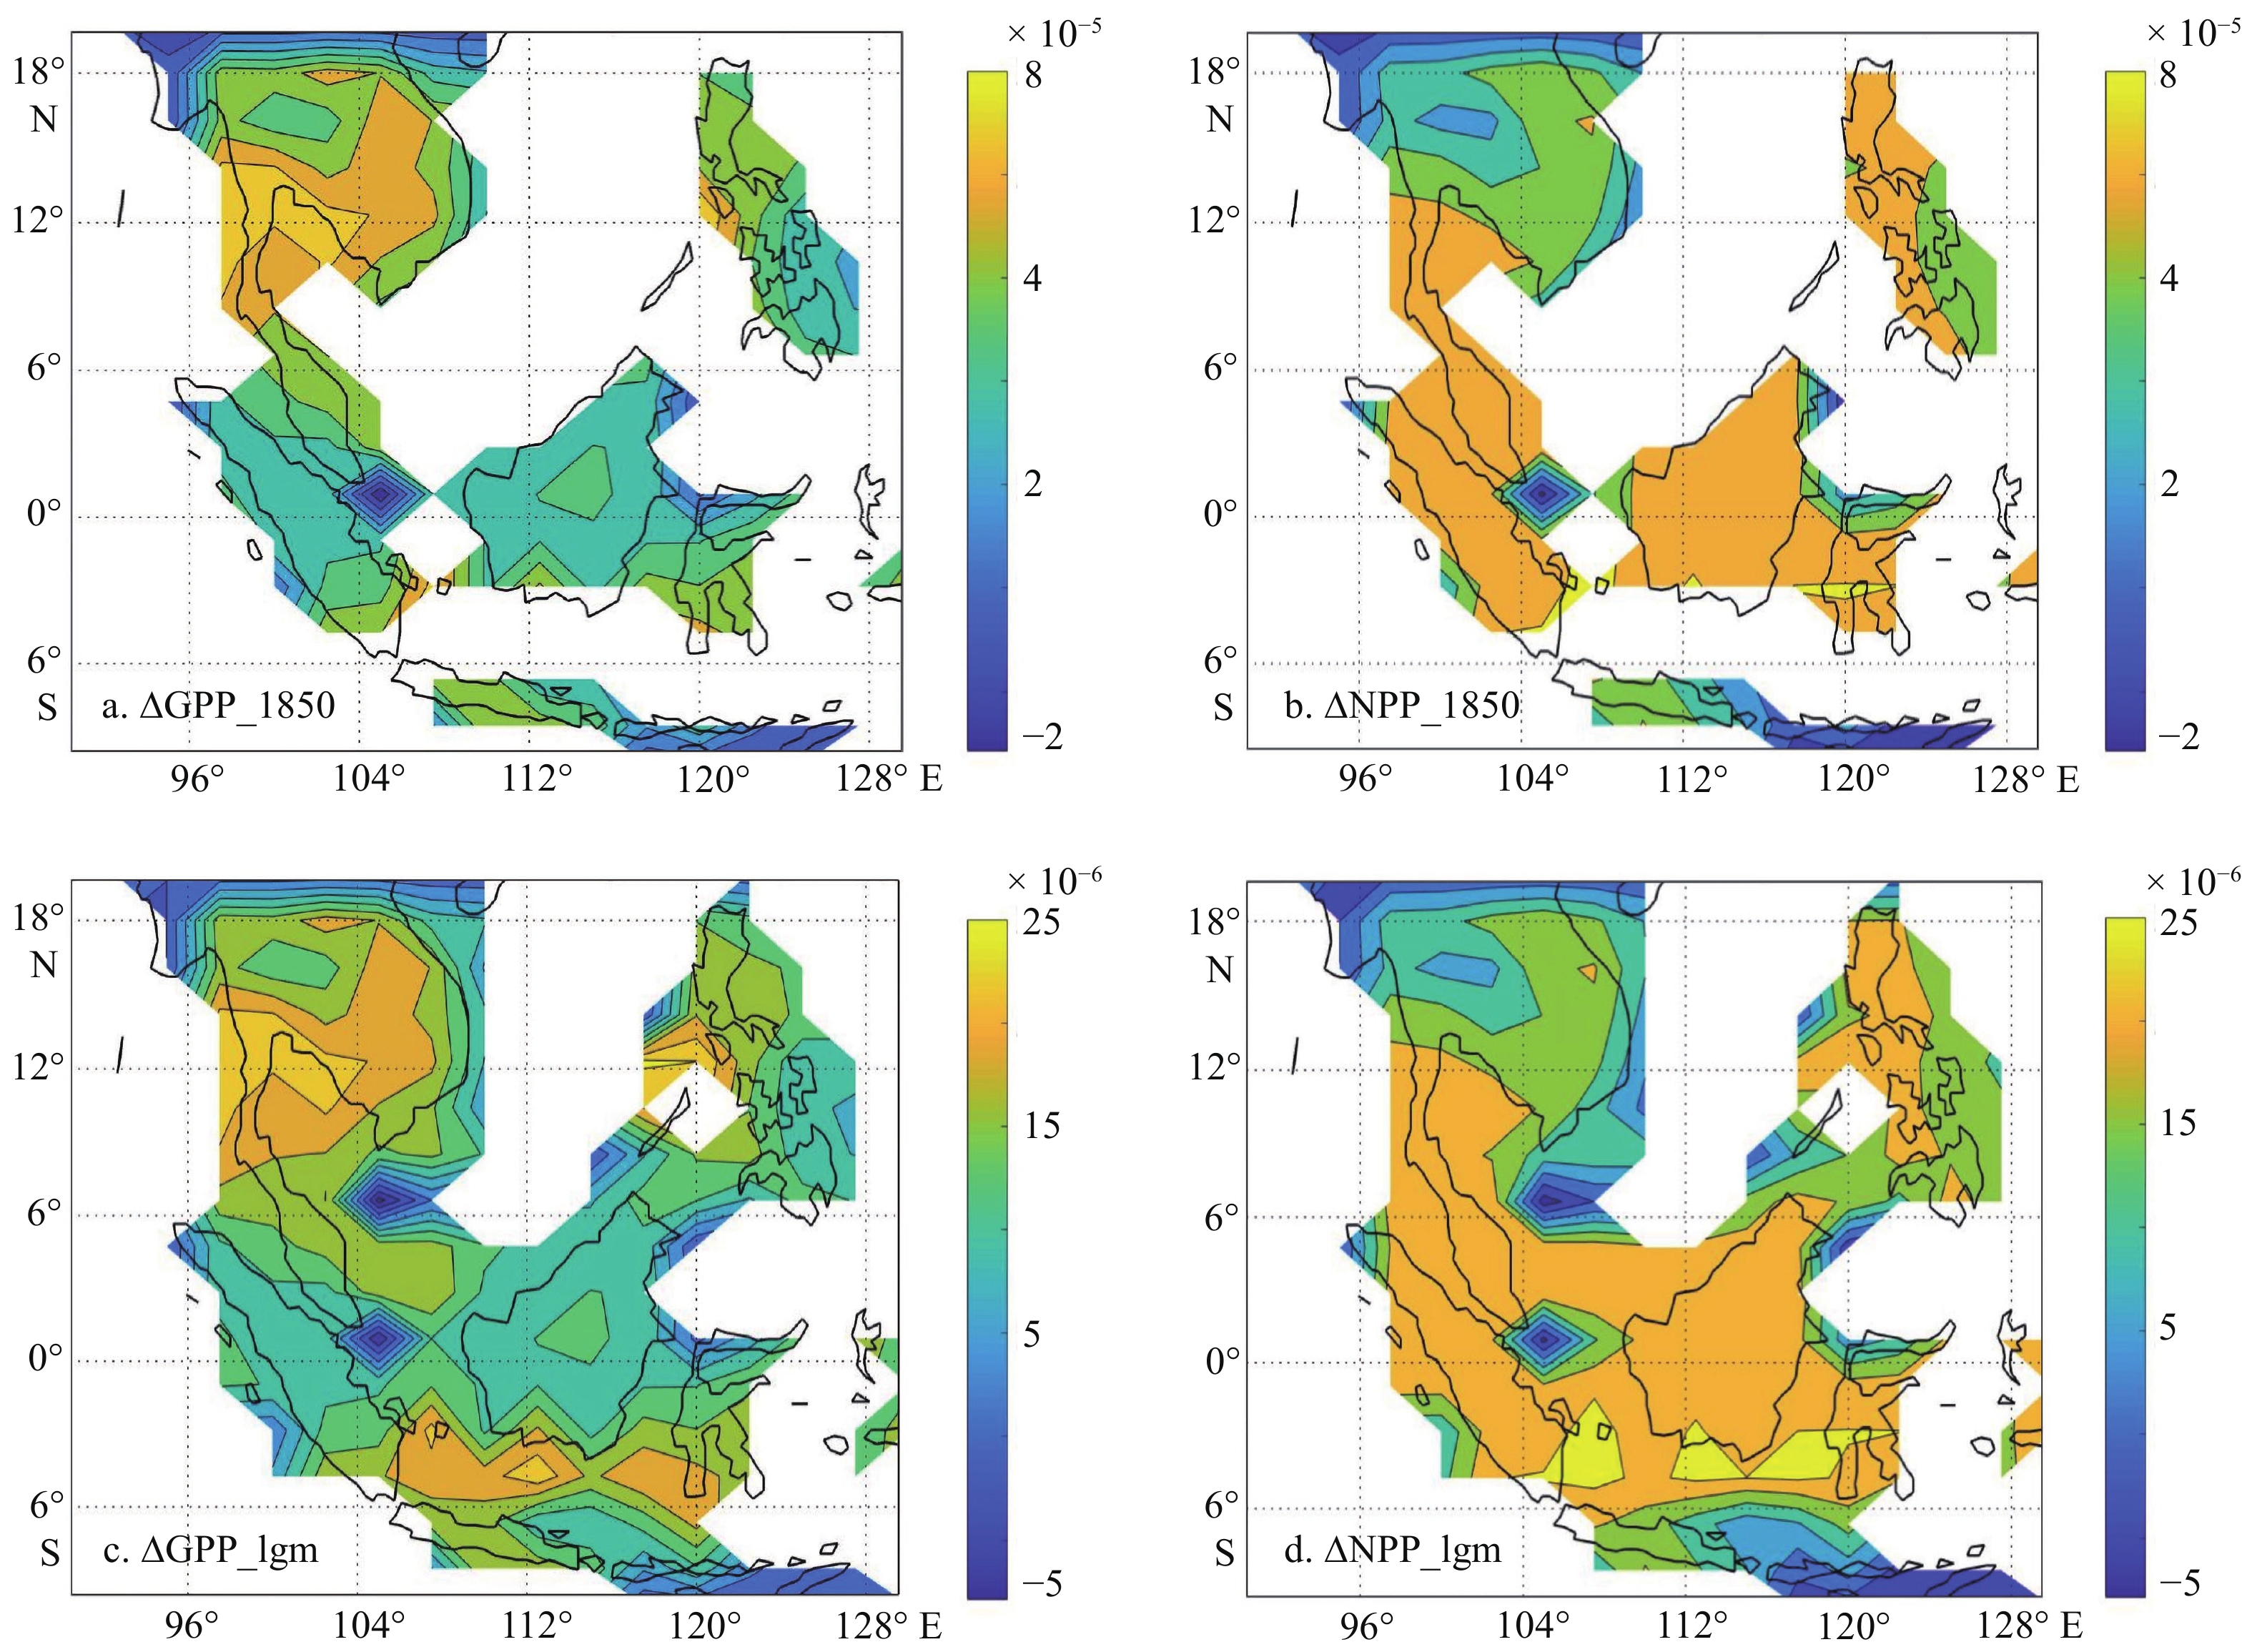
表 5 4个敏感试验的GPP、NPP比较
Table 5. Comparison of GPP and NPP in four sensitivity tests
PgC/a 1850_tree 1850_grass lgm_tree lgm_grass 全球GPP 117.00 112.53 126.22 118.72 全球NPP 39.52 37.72 42.30 39.34 东南亚GPP 11.66
(9.97%)7.78
(6.91%)20.86
(16.53%)13.65
(11.50%)东南亚NPP 3.66
(9.25%)2.12
(5.63%)6.48
(15.32%)3.64
(9.27%)注:括号内数值是东南亚占全球的比例。
下载: 导出CSV
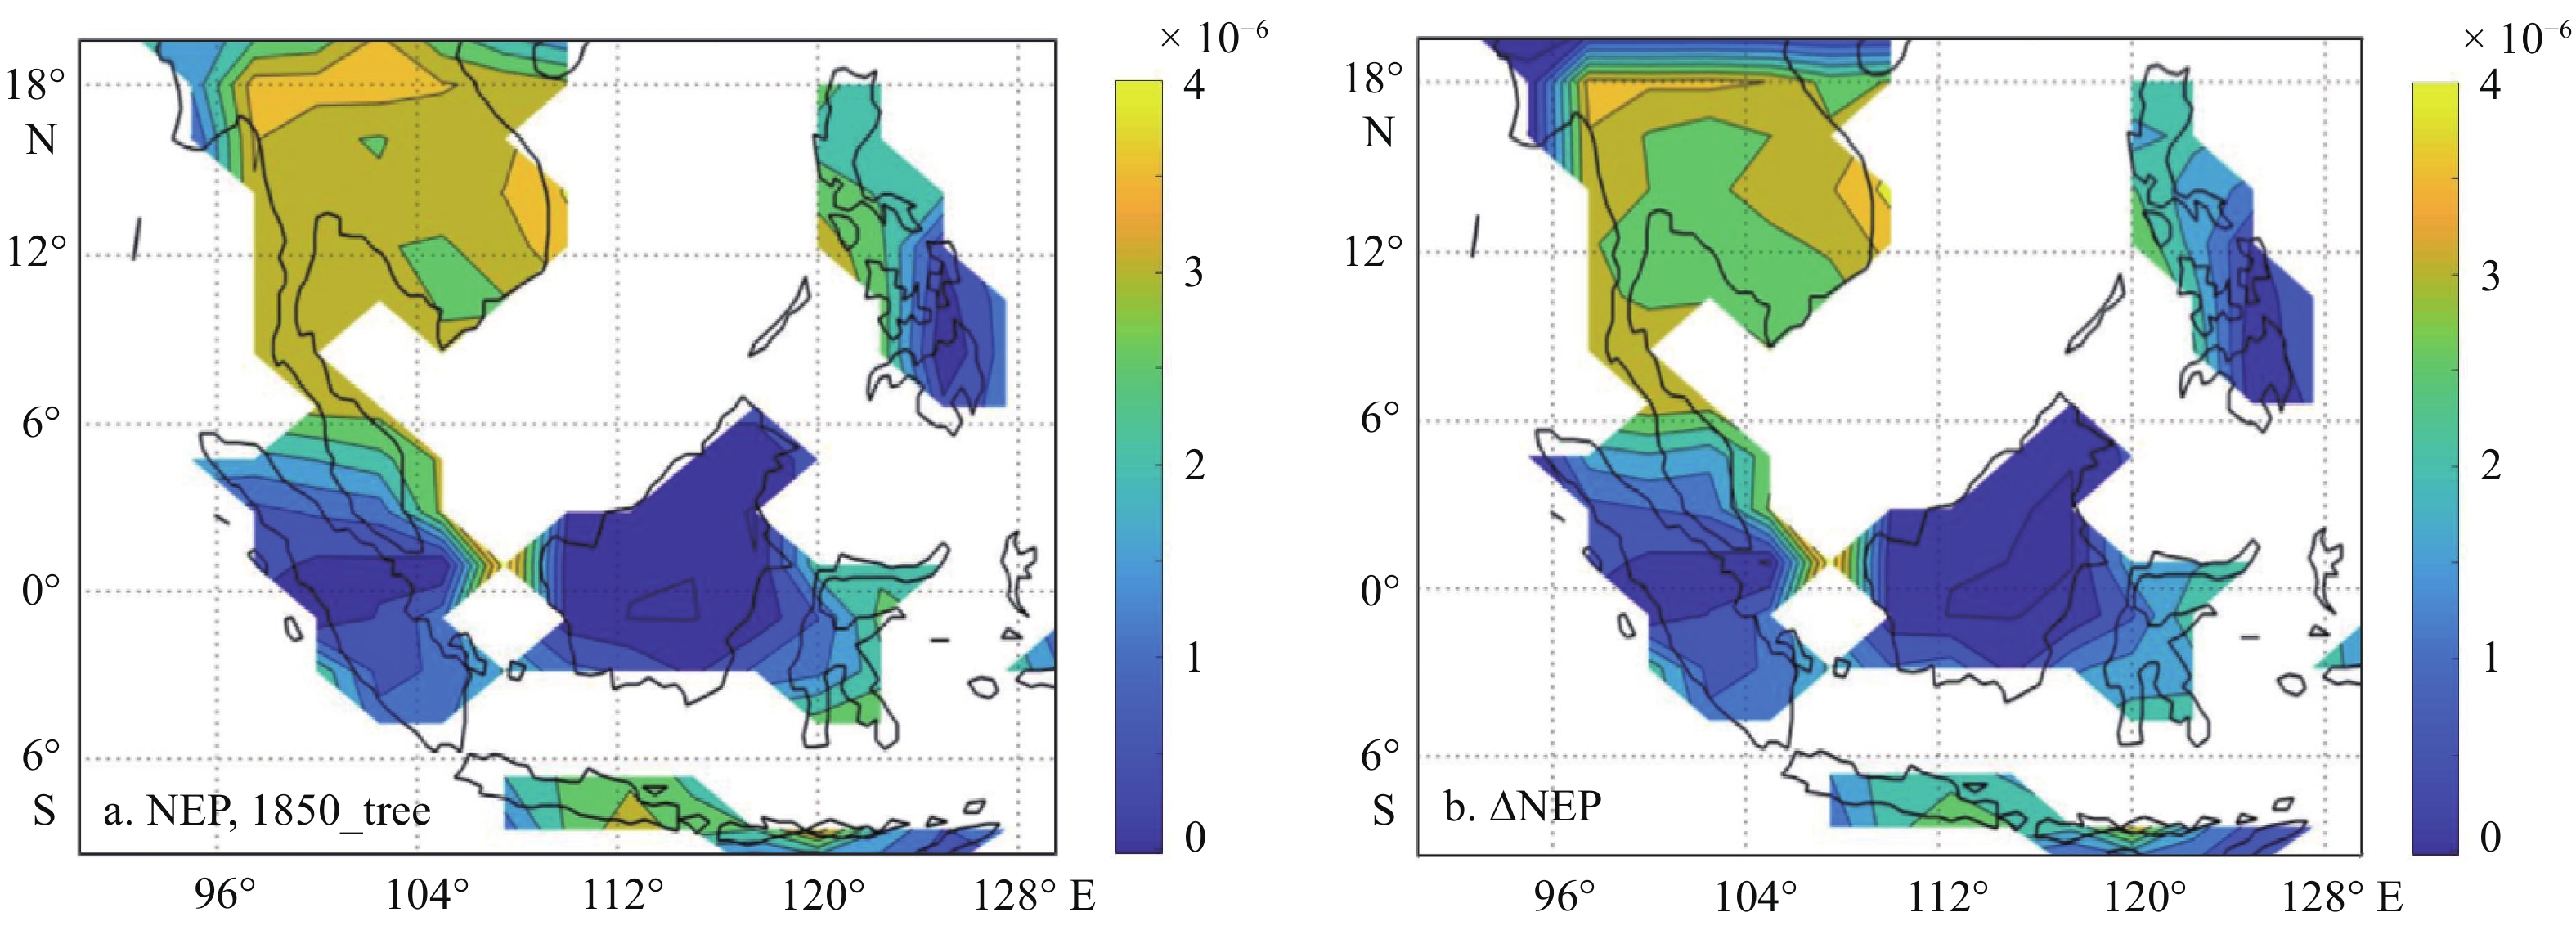
表 6 4个敏感试验的NBP、NEP比较
Table 6. Comparison of NBP and NEP in four sensitivity tests
PgC/a 1850_tree 1850_grass lgm_tree lgm_grass 全球NBP −0.025 0.0106 −0.0049 0.0093 东南亚NBP −0.0013 2.08×10⁻⁴ −0.001 2.58×10⁻⁴ 全球NEP 1.711 1.5943 1.8916 1.6121 东南亚NEP 0.1705
(9.96%)0.032
(2.01%)0.33
(17.45%)0.046
(2.85%)注:括号内数值是东南亚占全球的比例。
下载: 导出CSV
-
[1] Houghton R A. Balancing the global carbon budget [J]. Annual Review of Earth and Planetary Sciences, 2007, 35: 313-347. doi: 10.1146/annurev.earth.35.031306.140057
[2] Pan Y D, Birdsey R A, Phillips O L, et al. The structure, distribution, and biomass of the world's forests [J]. Annual Review of Ecology, Evolution, and Systematics, 2013, 44: 593-622. doi: 10.1146/annurev-ecolsys-110512-135914
[3] Melillo J M, McGuire A D, Kicklighter D W, et al. Global climate change and terrestrial net primary production [J]. Nature, 1993, 363(6426): 234-240. doi: 10.1038/363234a0
[4] Saatchi S S, Harris N L, Brown S, et al. Benchmark map of forest carbon stocks in tropical regions across three continents [J]. Proceedings of the National Academy of Sciences of the United States of America, 2011, 108(24): 9899-9904. doi: 10.1073/pnas.1019576108
[5] Hooijer A, Page S, Canadell J G, et al. Current and future CO2 emissions from drained peatlands in Southeast Asia [J]. Biogeosciences, 2010, 7(5): 1505-1514. doi: 10.5194/bg-7-1505-2010
[6] Malhi Y. The carbon balance of tropical forest regions, 1990–2005 [J]. Current Opinion in Environmental Sustainability, 2010, 2(4): 237-244. doi: 10.1016/j.cosust.2010.08.002
[7] Tjia H D. The sunda shelf, southeast Asia [J]. Zeitschrift Für Geomorphologie, 1980, 24(4): 405-427.
[8] De Deckker P, Tapper N J, van der Kaars S. The status of the Indo-Pacific Warm Pool and adjacent land at the Last Glacial Maximum [J]. Global and Planetary Change, 2003, 35(1-2): 25-35. doi: 10.1016/S0921-8181(02)00089-9
[9] Heaney L R. A synopsis of climatic and vegetational change in Southeast Asia [J]. Climatic Change, 1991, 19(1-2): 53-61. doi: 10.1007/BF00142213
[10] Taylor D, Yen O H, Sanderson P G, et al. Late Quaternary peat formation and vegetation dynamics in a lowland tropical swamp; Nee Soon, Singapore [J]. Palaeogeography, Palaeoclimatology, Palaeoecology, 2001, 171(3-4): 269-287. doi: 10.1016/S0031-0182(01)00249-8
[11] Sun X J, Li X, Luo Y L. Vegetation and climate on the sunda shelf of the South China Sea during the last Glactiation-Pollen results from station 17962 [J]. Acta Botanica Sinica, 2002, 44(6): 746-752.
[12] Bird M I, Taylor D, Hunt C. Palaeoenvironments of insular Southeast Asia during the Last Glacial Period: a savanna corridor in Sundaland? [J]. Quaternary Science Reviews, 2005, 24(20-21): 2228-2242. doi: 10.1016/j.quascirev.2005.04.004
[13] Wang X M, Sun X J, Wang P X, et al. Vegetation on the sunda shelf, South China Sea, during the last glacial maximum [J]. Palaeogeography, Palaeoclimatology, Palaeoecology, 2009, 278(1-4): 88-97. doi: 10.1016/j.palaeo.2009.04.008
[14] 方精云, 刘国华, 徐嵩龄. 中国陆地生态系统的碳库[M]//王庚辰, 温玉璞. 温室气体浓度和排放监测及相关过程. 北京: 中国环境科学出版社, 1996
FANG Jingyun, LIU Guohua, XU Songling. Carbon pool of terrestrial ecosystem in China[M]//WANG Gengchen, WEN Yupu. Greenhouse Gas Concentration and Emission Monitoring and Related Processes. Beijing: China Environmental Science Press, 1996.
[15] Xie Z B, Zhu J G, Liu G, et al. Soil organic carbon stocks in China and changes from 1980s to 2000s [J]. Global Change Biology, 2007, 13(9): 1989-2007. doi: 10.1111/j.1365-2486.2007.01409.x
[16] 徐丽, 何念鹏. 中国南北样带典型森林土壤属性数据集[J]. 中国科学数据, 2019, 4(1):73-81 doi: 10.11922/sciencedb.602
XU Li, HE Nianpeng. A dataset of forest soil properties in north-south transect of eastern China [J]. Science Data Bank, 2019, 4(1): 73-81. doi: 10.11922/sciencedb.602
[17] Bonan G B. Forests and climate change: forcings, feedbacks, and the climate benefits of forests [J]. Science, 2008, 320(5882): 1444-1449. doi: 10.1126/science.1155121
[18] Molengraaff G A F, Weber M. On the relation between the pleistocene glacial period and the origin of the Sunda sea (Java and South China-sea), and its influence on the distribution of coralreefs and on the land- and freshwater fauna [J]. Koninklijke Nederlandsche Akademie van Wetenschappen Proceedings, 1921, 23(1): 395-439.
[19] 李金澜, 田军. 末次冰期南海南部暴露的巽他陆架是大气碳汇?[J]. 海洋地质与第四纪地质, 2018, 38(4):155-163
LI Jinlan, TIAN Jun. The Sunda Shelf: a carbon sink during the last glacial period? [J]. Marine Geology & Quaternary Geology, 2018, 38(4): 155-163.
[20] Qian T T, Dai A G, Trenberth K E, et al. Simulation of global land surface conditions from 1948 to 2004. Part I: forcing data and evaluations [J]. Journal of Hydrometeorology, 2006, 7(5): 953-975. doi: 10.1175/JHM540.1
[21] Thornton P E, Rosenbloom N A. Ecosystem model spin-up: estimating steady state conditions in a coupled terrestrial carbon and nitrogen cycle model [J]. Ecological Modelling, 2005, 189(1-2): 25-48. doi: 10.1016/j.ecolmodel.2005.04.008
[22] Thomas H, Prowe A E F, Lima D I, et al. Changes in the North Atlantic Oscillation influence CO2 uptake in the North Atlantic over the past 2 decades [J]. Global Biogeochemical Cycles, 2008, 22(4): GB4027.
[23] Zhao M S, Running S W. Drought-induced reduction in global terrestrial net primary production from 2000 through 2009 [J]. Science, 2010, 329(5994): 940-943. doi: 10.1126/science.1192666
[24] Zhu L K, Southworth J. Disentangling the relationships between net primary production and precipitation in southern Africa savannas using satellite observations from 1982 to 2010 [J]. Remote Sensing, 2013, 5(8): 3803-3825. doi: 10.3390/rs5083803
[25] 戴璐, Yeok F S. 末次冰期时暴露的巽他大陆架可能被热带稀树草原覆盖吗?[J]. 地球科学进展, 2017, 32(11):1147-1156 doi: 10.11867/j.issn.1001-8166.2017.11.1147
DAI Lu, Yeok F S. Was there savanna corridor on the exposed Sunda shelf during the last glacial period? [J]. Advances in Earth Science, 2017, 32(11): 1147-1156. doi: 10.11867/j.issn.1001-8166.2017.11.1147
[26] Lehmann C E R, Archibald S A, Hoffmann W A, et al. Deciphering the distribution of the savanna biome [J]. New Phytologist, 2011, 191(1): 197-209. doi: 10.1111/j.1469-8137.2011.03689.x
-

图(5)
表(6)
计量
- 文章访问数: 2594
- PDF下载数: 200
- 施引文献: 0